Histologic features and genomic alterations of primary colorectal adenocarcinoma predict growth patterns of liver metastasis
2019-07-24JingBoWuAliLopezSarmientoPierreOlivierFisetAnthulaLazarisPeterMetrakosStephaniePetrilloZuHuaGao
Jing-Bo Wu, Ali Lopez Sarmiento, Pierre-Olivier Fiset, Anthula Lazaris, Peter Metrakos, Stephanie Petrillo,Zu-Hua Gao
Jing-Bo Wu, Department of Pathology, The Fifth People's Hospital, Fudan University,Shanghai 200240, China
Ali Lopez Sarmiento, Pierre-Olivier Fiset, Zu-Hua Gao, Department of Pathology, McGill University and the Research Institute of McGill University Health Center, Montreal H4A 3J1,Quebec, Canada
Anthula Lazaris, Peter Metrakos, Stephanie Petrillo, Cancer Research Program, The Research Institute of McGill University Health Center, Montreal H4A 3J1, Quebec, Canada
Corresponding author: Zu-Hua Gao, FRCPC, MD, PhD, Professor, Department of Pathology,McGill University and the Research Institute of McGill University Health Center, Room E04.1820, 1001 Decarie Boulevard, Montreal H4A 3J1, Quebec, Canada.zu-hua.gao@mcgill.ca
Abstract BACKGROUND Different histological growth patterns (HGPs) of colorectal carcinoma (CRC) liver metastasis are associated with patients' prognosis and response to antiangiogenic therapy. However, the relationship between HGPs of liver metastasis and clinicopathological and genomic characteristics of primary cancer has not been well established.AIM To assess whether certain clinicopathological and genomic features of primary CRC could predict the HGPs of liver metastasis.METHODS A total of 29 patients with paired resections of both primary CRC and liver metastasis were divided into two groups: A (15 cases with desmoplastic liver metastasis) and B (14 cases with replacement liver metastasis). Clinical information was obtained from patients' charts. Mismatch repair proteins,BRAFV600E, and PD-L1 were evaluated by immunohistochemistry. Five cases were selected randomly from each group for whole exome sequencing (WES)analysis.RESULTS In the primary tumor, expanding growth pattern, low tumor budding score(TBS), and Crohn's disease-like response (CDR) were associated with desmoplastic liver metastasis and better overall survival, whereas infiltrating growth pattern alone of primary carcinoma could predict the replacement liver metastasis and worse overall survival (P < 0.05). On WES analysis, primary carcinoma with desmoplastic liver metastasis showed mutations in APC (4/5);TP53 (3/5); KRAS, PIK3CA, and FAT4 (2/5); BRCA-1, BRCA2, BRAF, and DNAH5 (1/5), whereas primary carcinoma with replacement liver metastasis showed mutations in APC and TP53 (3/5); KRAS, FAT4, DNH5, SMAD, ERBB2,ERBB3, LRP1, and SDK1 (1/5).CONCLUSION The HGPs, TBS, and CDR of primary CRC as well as the presence of specific genetic mutations such as those in PIK3CA could be used to predict the HGPs of liver metastasis, response to therapy, and patients' prognosis.
Key words: Colorectal carcinoma; Liver metastasis; Histologic growth pattern;Clinicopathological characteristics; Whole exome sequencing authors declare no conflict of interest related to the article.
INTRODUCTION
Colorectal carcinoma (CRC) is the third and second most commonly diagnosed cancer in men and women, respectively, with an estimated global incidence of 1.4 million new cases, and 693900 deaths in the world every year[1]. The prognosis after curative resection depends entirely on the development of metastasis, especially liver metastasis. At the time of diagnosis, 25% of patients with CRC had liver metastases(CRCLMs) and another 50% of patients without initial liver metastases had liver metastasis during follow-up[2]. Metastatic CRC is one of the leading causes of cancerrelated deaths worldwide[3].
According to the international consensus guidelines for scoring the histological growth patterns (HGPs) of liver metastasis[4], CRCLMs present with distinct HGPs,including desmoplastic, pushing, replacement, and two rarer HGPs (sinusoidal and portal HGPs). The HGPs are defined based on the distinct interfaces between cancer cells and adjacent normal liver parenchyma. Importantly, the HGPs of liver metastases were shown to have prognostic and predictive value by some retrospective studies. Several studies showed that patients with desmoplastic liver metastasis had a longer recurrence free survival than patients with non-desmoplastic liver metastasis[5,6]. They attributed the poorer survival in patients with non-desmoplastic growth pattern to the higher recurrence rate. Frentzas et al[7]confirmed that CRC with replacement liver metastasis did not respond well to bevacizumab treatment, due to the fact that these tumors utilize vessel co-option instead of angiogenesis. On the other hand, desmoplastic liver metastasis, which relies on sprouting angiogenesis for its blood supply, showed a better response to bevacizumab. They proposed that the HGPs of CRCLMs could be used as a predictive biomarker for anti-angiogenic therapy.
It is natural to expect that the HGP and other clinicopathological characteristics of primary cancer may have biological, predictive, and important prognostic information. However, the relationship between HGPs of liver metastasis and clinicopathological characteristics of primary cancer have not been well established. In the study of Rajaganeshan et al[8], 69.2% of primary expanding CRCs developed capsulated liver metastases, whereas only 17.2% of infiltrating primary CRCs developed a capsulated phenotype (P < 0.001). Although almost all liver metastases from breast cancer adopt a replacement growth pattern, CRCLMs may present different HGPs[7,9]. Furthermore, the underlying genetic abnormalities and molecular pathways that drive the distinct HGPs remain unknown. In this study, we first analyzed the clinicopathological features of CRC patients with two distinct pattern of liver metastases. We then studied the genomic differences of primary CRCs between these two groups using whole exome sequencing analysis. Our study will provide new insights into the primary tumor in terms of their value in predicting the growth pattern of liver metastasis, response to antiangiogenic therapy, and patients'prognosis.
MATERIALS AND METHODS
Patients
With the approval of McGill University Health Center Research Ethics Board (No. 11-196-HGP), formalin-fixed, paraffin-embedded tissue blocks of matched primary CRC and liver metastases from 29 patients were obtained from the archives (2012-2017) of the Department of Pathology, McGill University Health Center. The primary cases were divided into two groups according to HGPs of matched CRCLMs: A (15 cases with matched CRCLMs showing desmoplastic growth pattern [DGP]) and B (14 cases with matched CRCLMs showing replacement growth pattern [RGP]). Tumor tissues of primary CRCs from five randomly selected cases in each group and their matched normal large intestinal mucosa were collected for whole exome sequencing. Clinical variables including age, gender, serum carcinoembryonic antigen (CEA) level, and survival data were obtained from patients' health records. Pathological characteristics of the primary colorectal tumor including localization, size, gross configuration,histologic grade, tumor depth, lymph node metastasis, tumor budding score (TBS),tumor deposit, lymphovascular invasion, and perineural invasion were retrieved from patients' pathology reports.
Evaluation of HGPs of primary and metastatic CRC
For each case, two pathologists (Gao ZH and Wu JB ) reviewed at least three slides stained with hematoxylin and eosin (H&E) under a light microscope (BX45, Olympus,Tokyo, Japan). Discrepancies of HGPs were resolved by reevaluation and discussion in a multi-head microscope setting.
The HGPs of liver metastasis were evaluated according to the international consensus on the HGPs of liver metastasis[4]. In the DGP, the metastatic cancer cells are separated from the liver tissue by a band of desmoplastic tissue. In the RGP,cancer cells form cell plates that are continuous with the hepatocyte plates. The invasive front of the primary cancers were classified as either expanding growth pattern (EGP) or infiltrating growth pattern (IGP) based on the predominant morphology, as defined by Jass et al[10], where the expanding type had been described as the pushing growth type of adenocarcinoma, whereas the infiltrating type had been described as the wide spread streaming form of adenocarcinoma (Figure 1A-D).
Evaluation of peri-tumoral inflammatory cell band (ICB) and Crohn's disease-like response (CDR) in primary CRC
The tumor-normal tissue interface was assessed for the degree of ICB and the presence or absence of CDR in H&E stained serial sections (Figure 1E-I). If ICB is present in less than 10% area of the tumor-normal tissue interface, the case was categorized as negative ICB; if between 10% and 50%, the case was categorized with low grade ICB; if ICB was observed in 50% or more of the tumor-normal tissue interface, the case was categorized with high grade ICB. CDR was defined as dense lymphoid aggregates, with or without germinal centers present at the mucosalsubmucosal junction, or in the deeper aspects of the bowl wall, including the subserosal adipose tissue (“Crohn's rosary”)[11].
Immunohistochemistry
All 29 formalin-fixed, paraffin-embedded colorectal tumor tissues and one normal intestinal tissue were used for tissue microarray construction, as previously described by Zhang et al[12]. Three 1.5 mm representative punches were included from each tumor tissue.
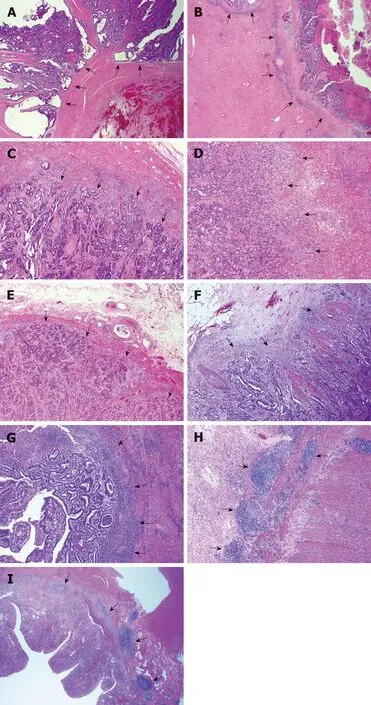
Figure 1 Representative histological images of the growth pattern of primary colorectal carcinoma and liver metastasis. A: Primary colorectal carcinoma (CRC) with an expanding growth pattern where the tumor gland pushes the surrounding stroma with a sharper dividing interface (arrows show expanding growth pattern); B: Liver metastasis with a desmoplastic growth pattern showing a stroma band separating the tumor with the surrounding liver parenchyma (arrows show desmoplastic growth pattern), the same case as A; C: Primary CRC with an infiltrating growth pattern where streams of tumor cells permeate into the stroma with an irregular interface (arrows show infiltrating growth pattern); D: Liver metastasis with a replacement growth pattern showing tumors cells in direct contact with hepatocytes and grow into the liver cell plate (arrows show replacement growth pattern), the same case as C; E: Negative inflammatory cell band (ICB) negative. There is no lymphocyte infiltration at the tumor-normal tissue interface, as arrows show; F: Low grade ICB. Lymphocyte infiltration is present in less than 50% tumor-normal tissue interface, as arrows show; G: High grade ICB. Lymphocyte infiltration is present in more than 50% tumornormal tissue interface, as arrows show; H: Positive Crohn's disease-like response (CDR) showing lymphoid aggregates at the deeper aspects of the bowl wall (arrows show aggregated lymphoid tissue); I: Positive CDR showing lymphoid aggregates at the mucosal-submucosal junction (arrows show aggregated lymphoid tissue).
Automated immunohistochemistry (IHC) was performed on 3-μm-thick TMA slides using a Ventana benchmark machine according to the manufacturer's instructions (Ventana Medical Systems, Inc., Tucson, AZ, United States). The following commercially available antibodies were used in the IHC: MLH1 [clone ES05, 1:100, Dako (Glostrup, Denmark)], MSH2 (clone FE11, 1:100, Dako), MSH6(clone EP49, 1:100, Dako), PMS2 (clone EP51, 1:100, Dako), programmed death receptor ligand-1 (PDL1) [clone ES05, SP263, VENTANA (Roche, United States)], and BRAFV600E [clone VE1, 1:100, Abcam (Cambridge, United Kingdom)]. On-slide positive and negative controls were used and the expected reaction was confirmed.
The IHC slides were evaluated independently by two gastrointestinal pathologists blindly using images of full slides obtained with a digital slide scanner (Aperio ScanScope AT Turbo, Leica microsystem, Concord, ON, Canada) and analyzed using the Aperio Image Analyzer. Deletion of MLH1, MSH2, MSH6, or PMS2 in cancerous tissues was defined as the absence of detectable nuclear staining of tumor cells. BRAF V600E staining was considered positive if the cytoplasmic staining was similar to the positive control in each batch. It was determined that any isolated nuclear staining was negative. In line with Zoroquiain et al[13], we defined PDL1 positivity by a threshold of 5% of tumor cells with strong cytoplasmic expression and membraneaccentuation or single membrane pattern. The expression of negative or equivocal protein expression detected in TMA was validated by IHC staining on the corresponding large tumor sections of the resection specimen using the same protocol.
Whole exome sequencing
Formalin-fixed, paraffin-embedded tumor tissue blocks and matched normal blocks were microdissected to remove residual normal tissue and enhance neoplastic cellularity. The DNA was extracted using the QIAamp DNA FFPE Tissue Kit (Qiagen,Netherlands) according to the manufacturer's protocol. The DNA concentration was determined using a Qubit 2.0 Fluorimeter (Invitrogen, Carlsbad, CA, United States).After DNA extraction, we obtained 282 to 6480 ng of DNA per lesion from 10 CRCs and matched normal tissues.
Whole exome sequencing was performed at McGill University and Genome Quebec Innovation Center. The gDNA library was prepared using a TruSeq DNA Sample Preparation Kit (Illumina) according to the manufacturer's instructions,followed by sequencing on an Illumina HiSeq, as previously described[14]. As shown in Figure 2, the raw DNA sequences were aligned, trimmed, and duplicates flagged to the NCBI human genome build 38 version 93, using Isaac aligner (Version: Isaac-04.18.01.19)[15]. Structural variant (SV) analysis calls were generated using Manta(version manta-1.4.0)[16]. Small variants [single nucleotide variant (SNV) and small indels] in germline and somatic variations in tumor/normal sample pairs were achieved using Strelka (Version: strelka-2.9.0)[17]. Copy number variant (CNV) calls were generated using Canvas (Version: Canvas/1.11.0/) with the tumor-normalenrichment workflow[18]. The callers share output, and therefore there is no double counting of calls. Manta and Strelka were run with Python (Version: 2.7.14).Annotation of the resulting calls was done with the Ensembl Variant Effect Predictor(VEP) using version 93.3 in a Perl (Version 5.22.4) environment[19]. Fastp (version 0.19.4) was used to collect QC metrics of the raw reads[20].
Sequencing result analyses and figures were prepared in the R statistical software suite (version 3.5.1) using standard R functions in custom code[21]. Circlize (version 0.4.4) was used to generate the Circos plots[22]. GGplot2 (version 3.0.0) was used to generate the heat maps. Custom R code was developed and run in RStudio (Version:1.1.453).
Statistical analysis
Statistical analyses were performed using Prism 7.00 statistical program (GraphPad,2015, San Diego, CA, United States); P < 0.05 was considered statistically significant.The statistical review of the study was performed by a biomedical statistician.Comparison of clinicopathological features and immunohistochemical staining results between groups was performed using the t-test, Wilcoxon Signed rank test, and Fisher's exact test. Survival analysis was performed using the Kaplan-Meier method and the log-rank test. Sensitivity, specificity, positive predictive value (PPV), and negative predictive value (NPV) were calculated to assess the prediction capacity of histologic features and genomic alternations of primary CRC for the growth patterns of liver metastasis.
RESULTS
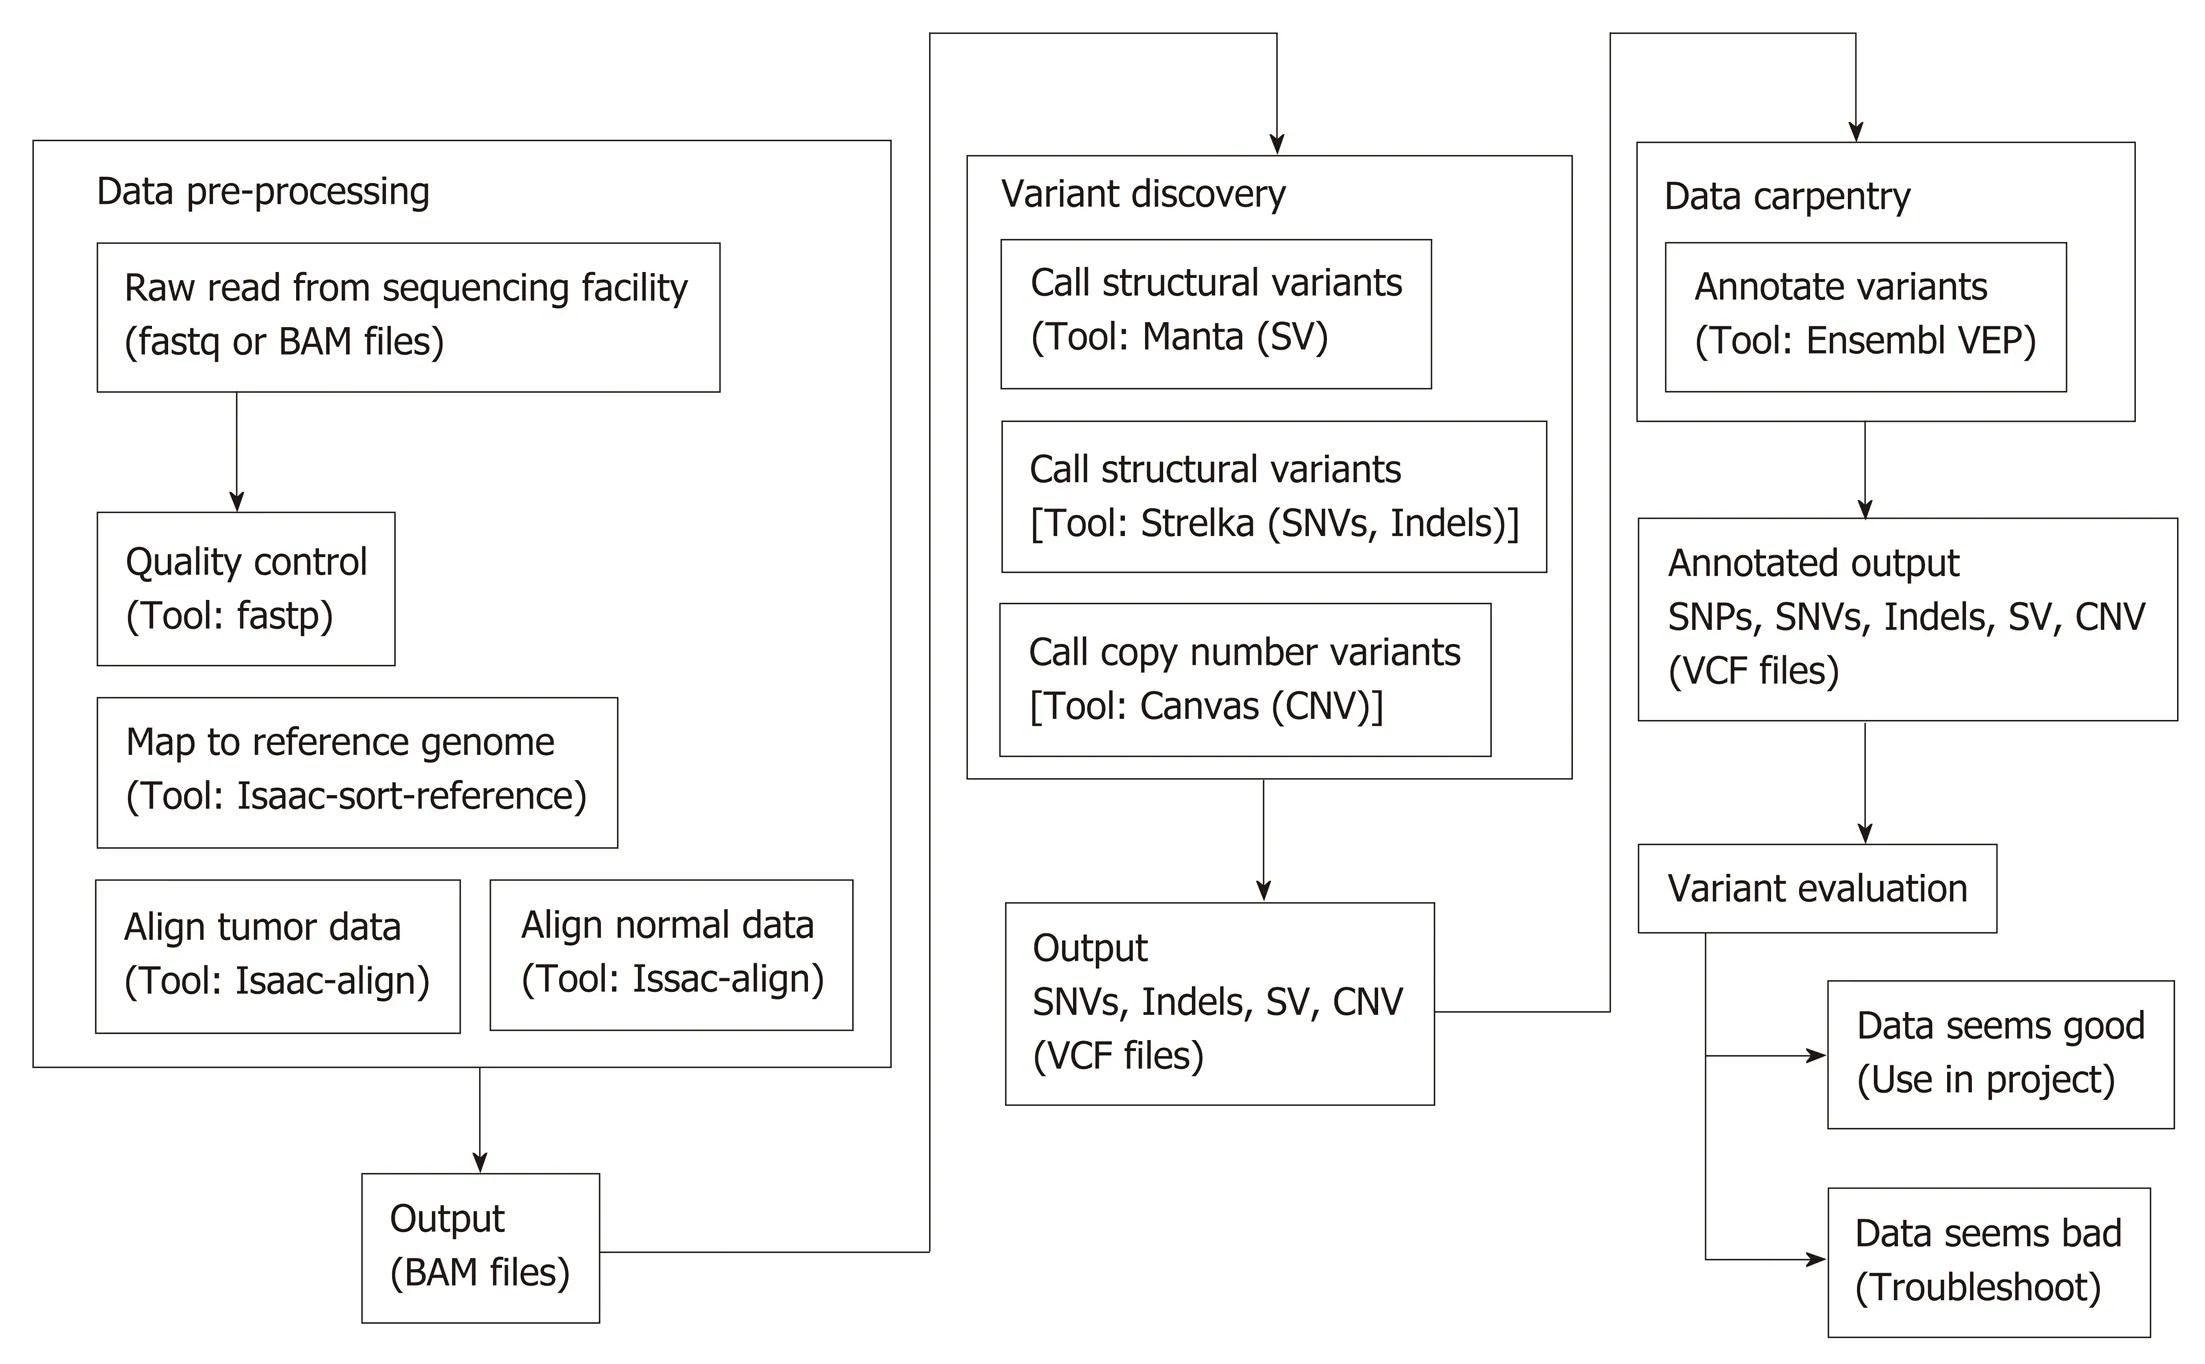
Figure 2 Work flow of whole exome sequencing bioinformatics analysis. SV: Structural variant; CNV: Copy number variant.
Clinical parameters
The clinical characteristics of the study population are shown in Table 1. The statistical comparison of the clinicopathological characteristics between Group A and Group B is shown in Table 2. Cases 1 to 15 belong to Group A, and cases 16 to 29 belong to Group B. With respect to age and gender, no significant differences were identified between Group A and Group B. The mean serum CEA level in Group B(46.9 μg/L) was noticeably higher than that in Group A (15.5 μg/L), although not statistically significant.
The mean length of follow-up for all patients was 36.8 mo (95%CI: 30.81-42.85 mo).Seventy-nine percent (23/29) patients were alive on completion of the study. There was no death in group A. Five cases were alive with liver, bone, or lung metastasis,the remaining 10 cases were alive without evidence of tumor recurrence or metastasis.In group B, however, 6 cases died of liver, lung, or brain metastasis and the remaining 8 cases had no evidence for tumor recurrence or metastasis. The length time for liver metastasis was calculated from the date of diagnosis of the primary CRC to the date of diagnosis of liver metastasis. The disease-free survival (DFS) was defined as the time from CRCLM resection to recurrence, or to the date of censoring in October, 2018,when the patient had no signs or symptoms of tumor recurrence or metastasis.Overall survival (OS) was calculated from the date of diagnosis of the primary carcinoma to the date of death, or to the date of censoring of live patients in October,2018. With respect to the length time of liver metastasis and the DFS, there were no significant differences between Group A and Group B (Figure 3A and B, P > 0.05).However, OS was significantly longer in Group A than Group B (Figure 3C, P =0.0337).
Pathological features
Among 29 cases, 37.9% (11/29) of the primary cancers were EGP and 62.1% (18/19)were IGP. Primary CRC with an EGP were more likely to have desmoplastic phenotype liver metastasis (81.8% vs 33.3%, P < 0.05). On the other hand, primary cancers with an IGP were significantly more likely to form replacement pattern liver metastasis (66.7% vs 18.2 %, P < 0.05)
TBS and tumor deposit were evaluated according to the American Joint Committee on Cancer (AJCC) Cancer Staging Manual (Eight Edition). Most of TBS was low(66.7%, 10/15) in Group A, and intermediate or high in group B (71.4%, 10/14). CDR was identified in 46.7% (7/15) of cases in Group A, and only in 7.1% (1/14) in Group B. There was no significant difference between Group A and Group B regarding tumor location, size, gross configuration, histologic grade, tumor depth, lymph node metastasis, tumor deposit, lymphovascular invasion, perineural invasion, or peritumoral ICB. With respect to TBS and CDR, there was significant higher TBS in Group B than in Group A (P < 0.05) and significantly more CDR in Group A than in Group B
(P < 0.05).
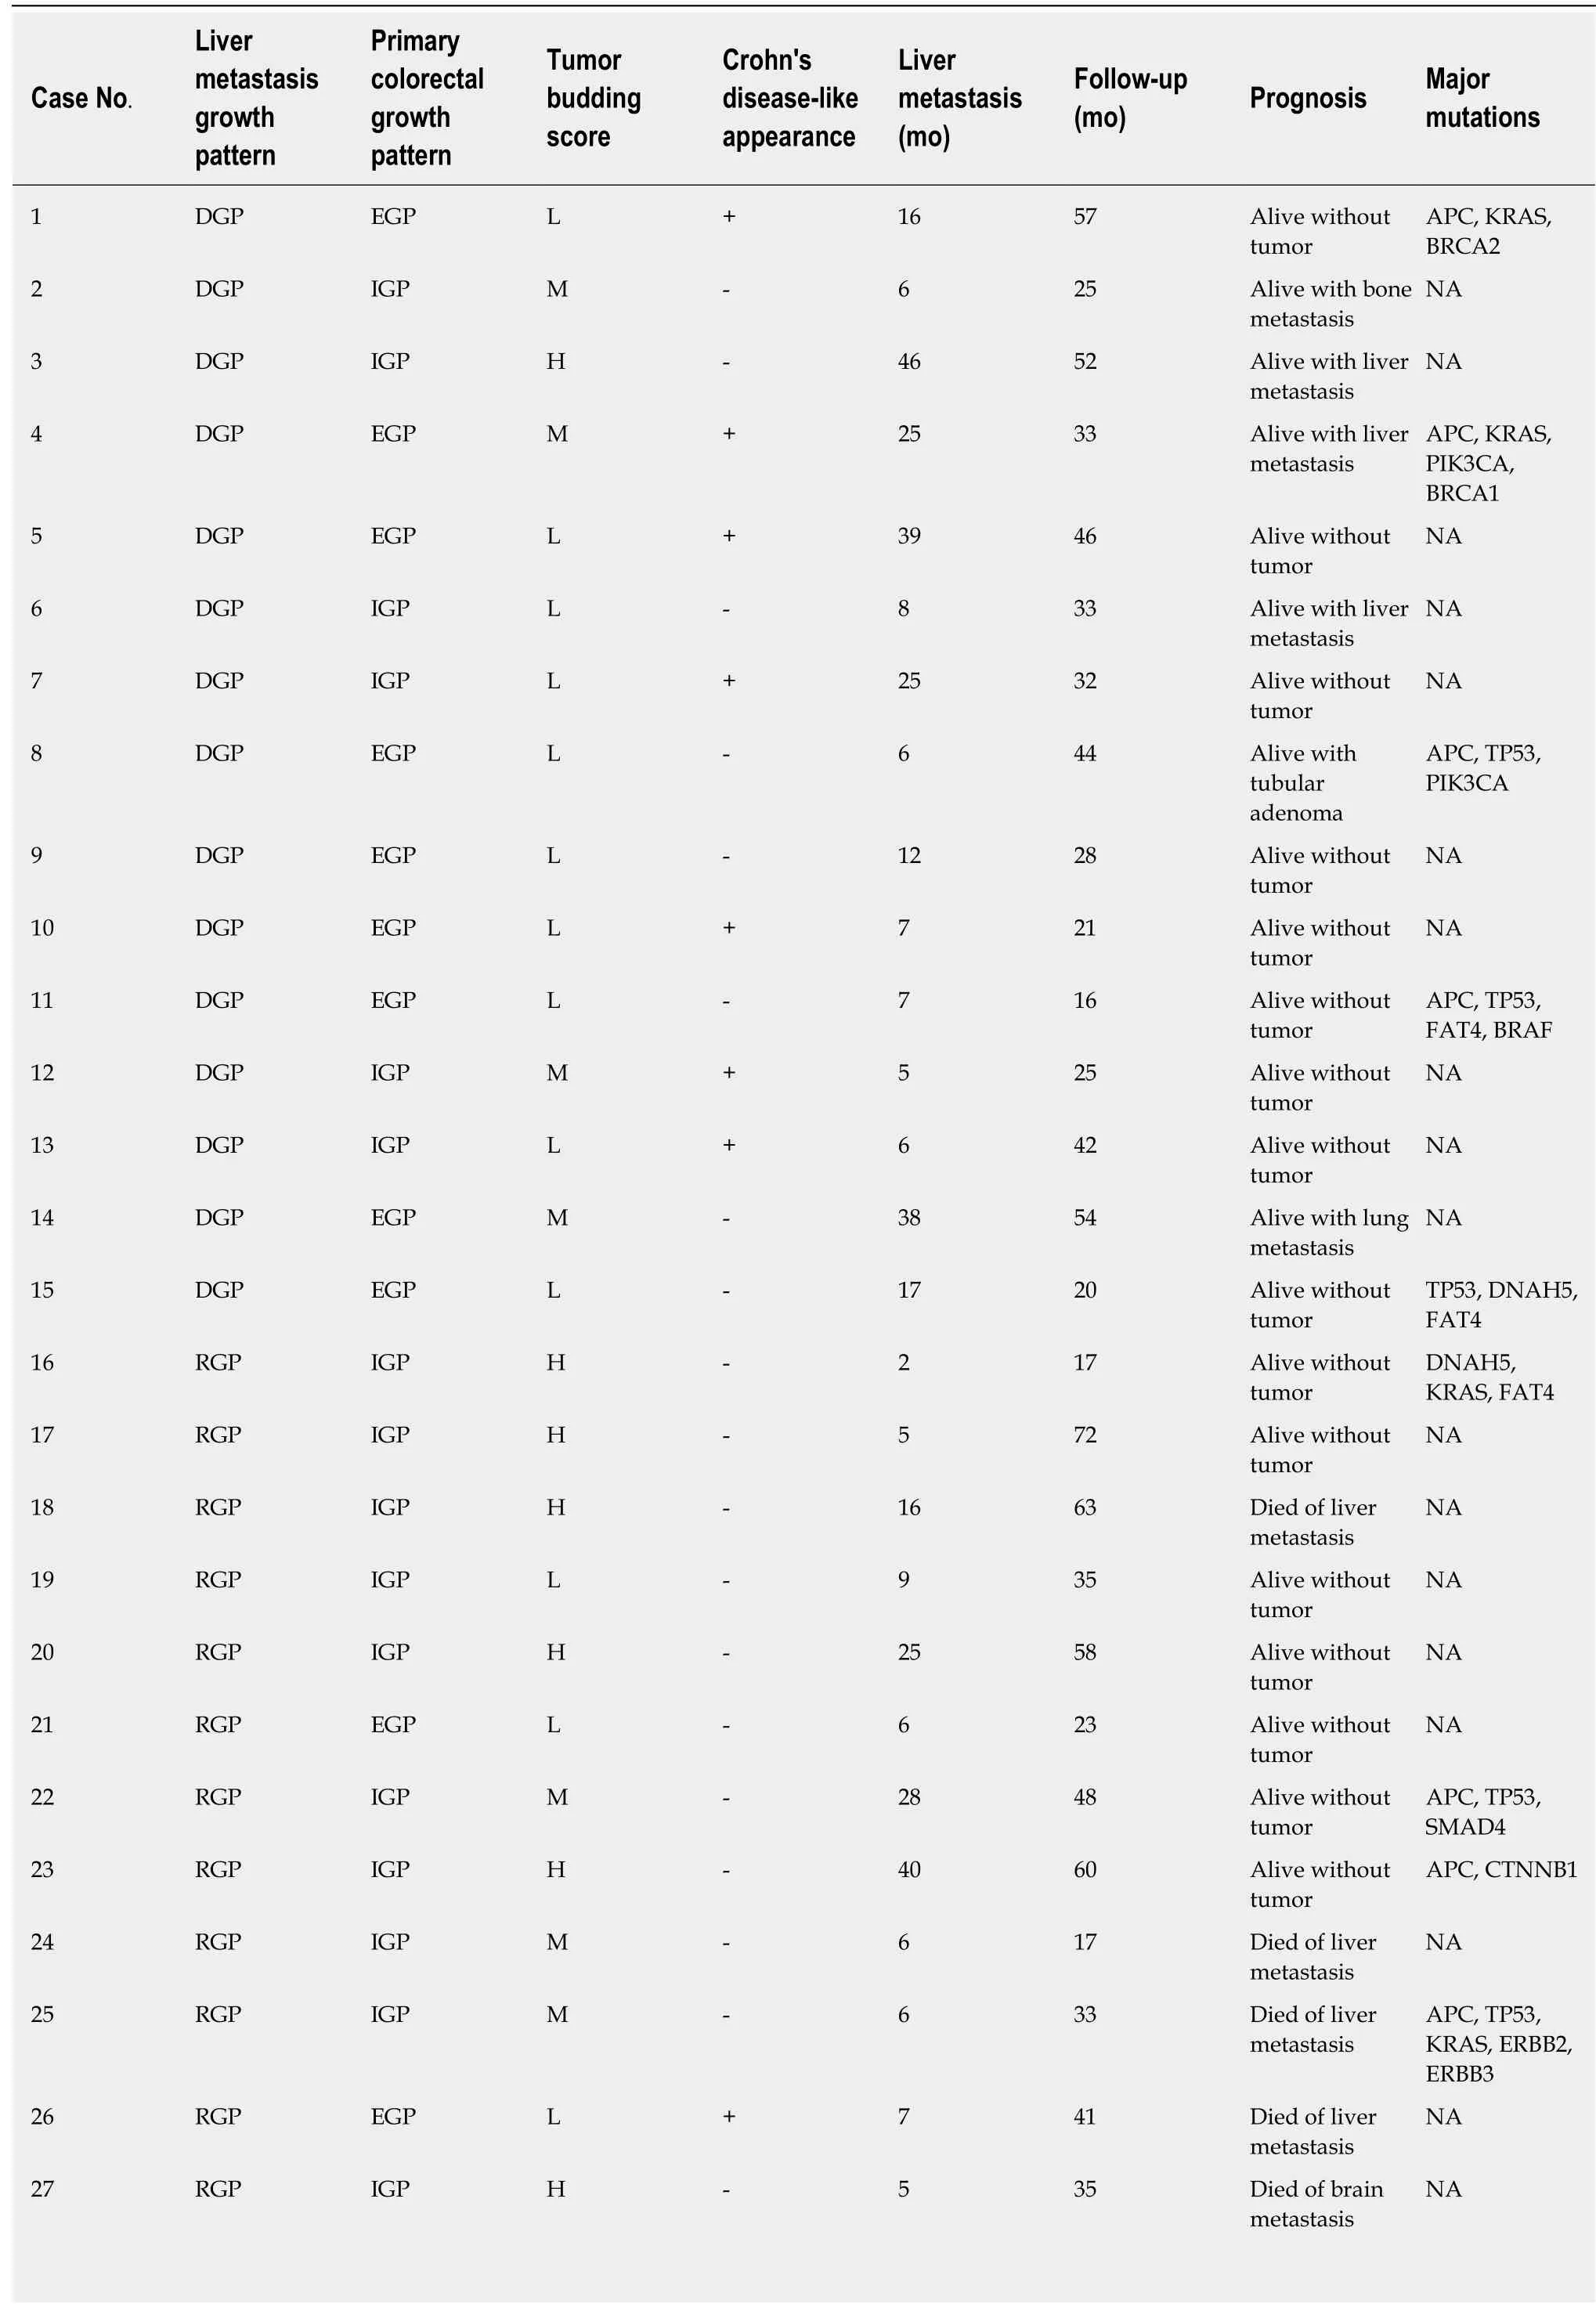
Table 1 Main clinical demographics and histological growth patterns in patients with colorectal carcinoma and liver metastasis in the study

DGP: Desmoplastic growth pattern; EGP: Expanding growth pattern; IGP: Infiltrating growth pattern; RGP: Replacement growth pattern; L: Low; M:Intermediate; H: High; NA: Not available.
Interestingly, as shown in Figure 4, we observed that the EGP of primary cancer could be divided into four subtypes: (1) Ordinary expanding, where the tumor gland pushes the stroma and forms a sharp dividing line at the interface; (2) Mucinous expanding, where pools of tumor epithelium containing mucin pushes the stroma and forms a sharp dividing line at the interface; (3) Cribriform expanding, where the tumor gland at the invasive front forms a round cribriform structure, and there is a clear dividing line between the tumor and the surrounding stroma; and (4)Micropapillary expanding, where the tumor cells at the invasive front form micropapillary architecture, and there is a clear dividing line between the tumor and the surrounding stroma. On the other hand, infiltrating growth pattern could be divided into two subtypes: (1) Ordinary infiltrating, where tumor cells infiltrate to the stroma and connect to the original tumor mass; and (2) Skip infiltrating, where there is a gap (>0.5 cm) of non-neoplastic tissue between the main tumor bulk and the invasive front.
As shown in Figure 5, there was no significant differences between the two groups in the tumor cell expression of MLH1, MSH2, MSH6, PMS2, BRAFV600E, or PDL1.Interestingly, the three MSI deficiency cases were all MSH2 protein deficient.
Value of selected pathological features in predicting the HGPs of CRCLMs
EGP, low TBS score, and positive CDR in the primary tumor were shown to have predictive value for the DGPs of CRCLMs. As shown in Table 3, HGP + TBS + CDR is the most sensitive and has the highest negative predictive value, whereas CDR alone is the most specific and has the highest positive predictive value.
IGP, high or intermediate TBS score, and negative CDR were shown to have predictive value for the RGP of CRCLMs. As shown in Table 3, CDR alone or combined with HGP and TBS are the most sensitive; TBS alone is the most specific;HGP or TBS has the highest PPV, whereas CDR has the highest NPV. When combining HGP, TBS, and CDR, although the sensitivity is 92.9%, the specificity is only 20.0%.
Whole-exome sequencing
Hierarchical clustering of Groups A and B based on SNV and indels is shown in Figure 6A, and frequency of SNV or indels in Group A and Group B is shown in Figure 6B. There was no statistical difference between the two groups in SNV or indels. However, our whole-exome sequencing revealed 14 major gene mutations, as shown in Table 1 and Figure 7. The most prevalent major mutation occurred in the APC gene, which occurred in 80% (4/5) of Group A cases and 60% (3/5) cases of Group B, followed by TP53 and KRAS mutations. Both Group A and Group B had the same frequency of TP53 and DNAH5 mutations. Interestingly, PIK3CA mutations were showed in 40% (2/5) cases of Group A but no one case in Group B, similarly, the mutations of BRCA1, BRCA2, and BRAF were only observed in Group A, and the mutations of SMAD, ERBB2, ERBB3, LRP2, and SDK1 were identified only in Group B, each in one patient.
DISCUSSION
Colorectal adenocarcinoma liver metastasis has been categorized into three growth patterns: desmoplastic, pushing, and replacement, each of which has characteristic morphological features[4]. Using this classification, Van den Eynden et al[6]reported that the pushing pattern was an independent predictor of poor survival. In contrast,Nielsen et al showed that patients with an RGP had a death risk 2 to 2.5 times higher than patients with a pushing growth pattern or mixed growth pattern, and almost 4 times more than patients with a DGP[5]. According to Eefsen et al[3], similar findings in chemonaive patients and patients receiving neoadjuvant therapy were identified.Histologically differentiating DGP and invasive growth pattern were more clearly cut with almost no interobserver discrepancies and the clinical relevance was more obvious[4]. For these reasons, only those CRCLMs with well-defined desmoplastic or replacement growth patterns were enrolled in this study.
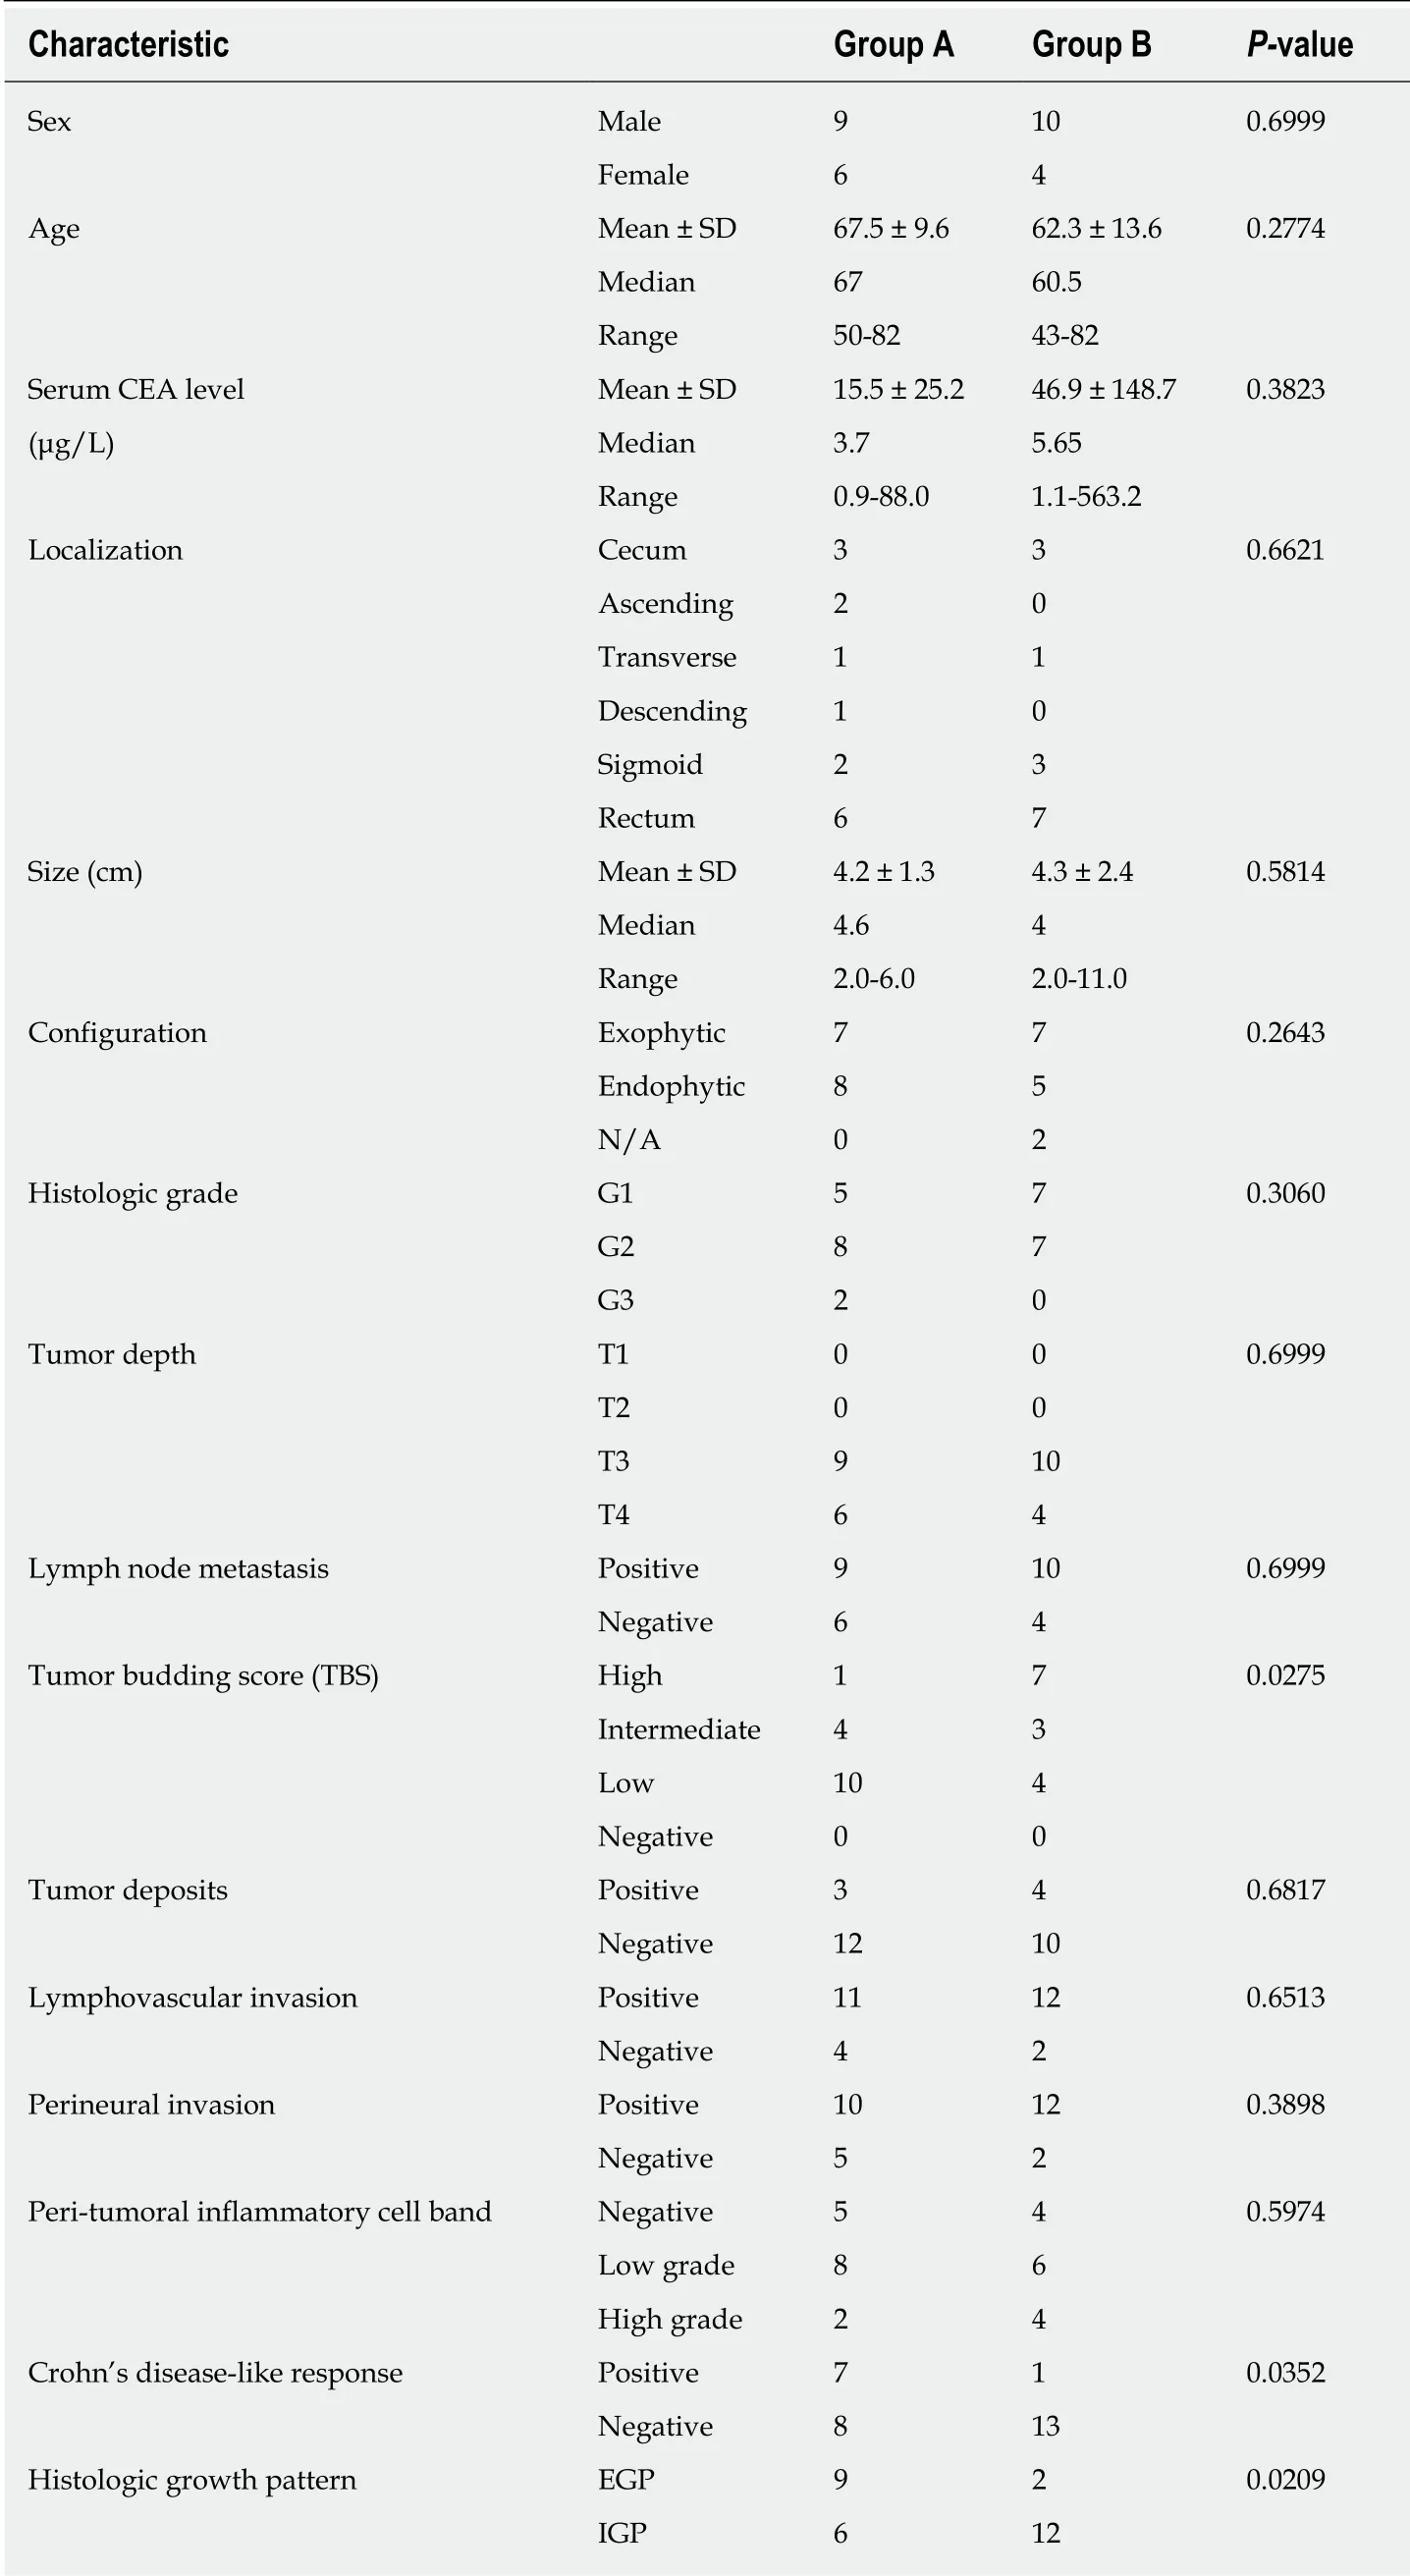
Table 2 Association between clinicopathological characteristics and growth patterns
Our results demonstrated that expanding CRCs tend to develop desmoplastic liver metastasis, whereas infiltrating CRCs tended to develop replacement liver metastasis,which is consistent with previous findings of Rajaganeshan et al[8]. Our study also confirmed that patients with expanding primary cancers had a significant longer OS than those with infiltrating primary tumors, which is in line with the previously reported findings of Cianchi et al[23], Nystrom et al[24], and Pinheiro et al[25]. Therefore,the growth pattern of primary CRC could, to a certain extent, predict the growth pattern of CRCLMs and patients' prognosis.
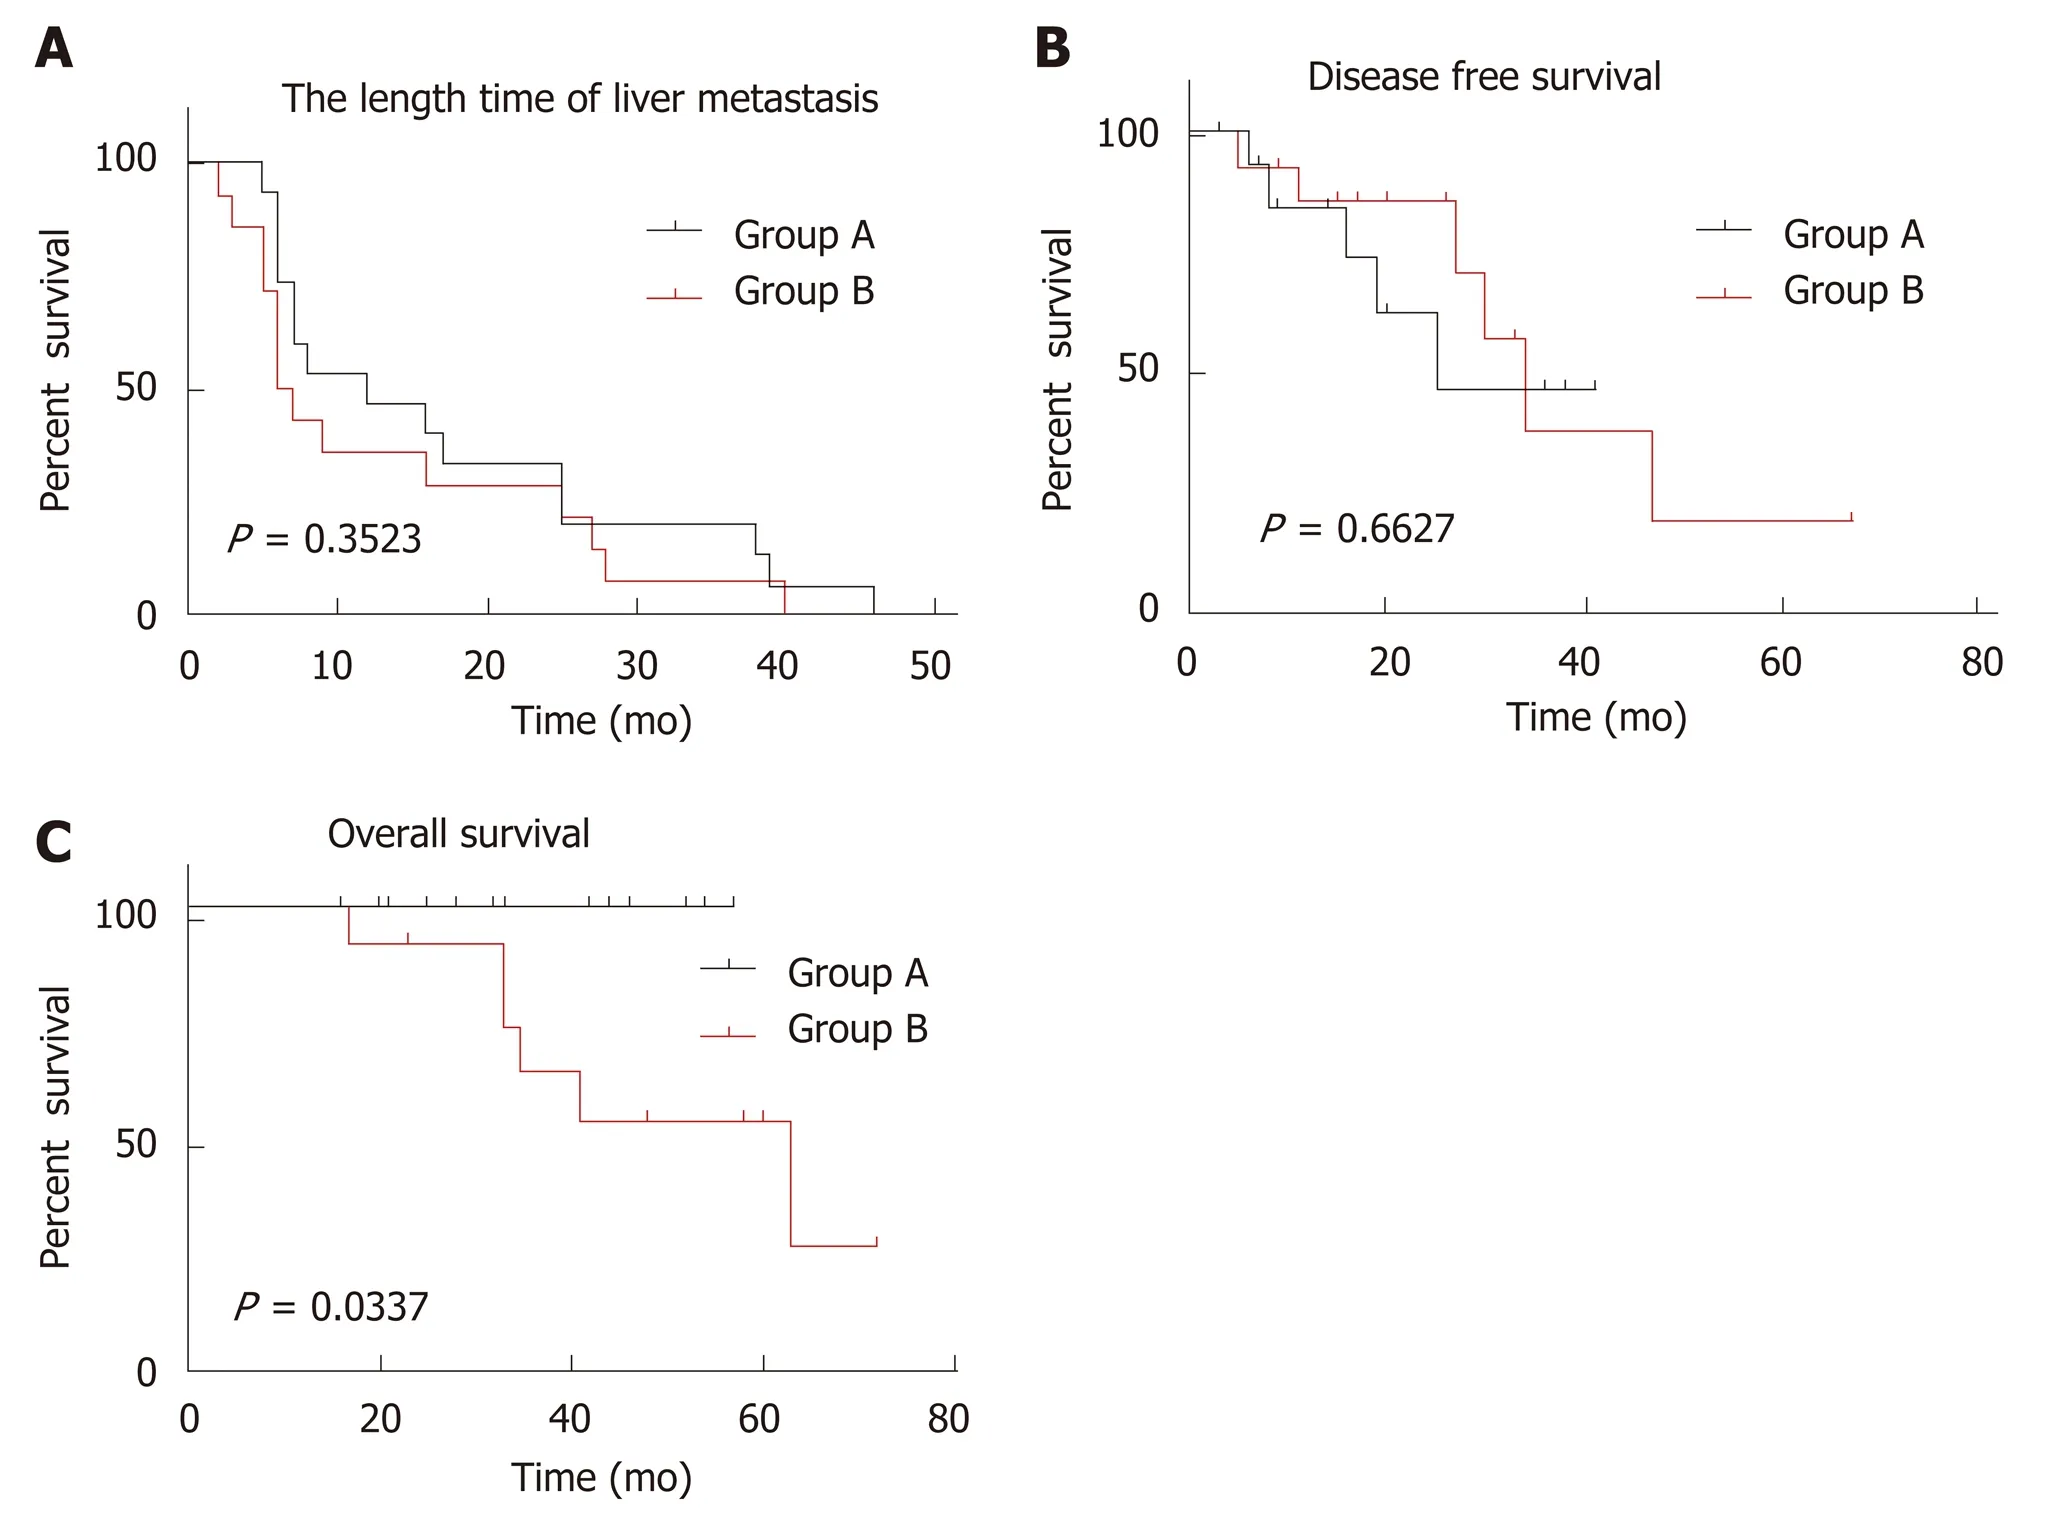
Figure 3 Kaplan-Meier curves for colorectal cancer liver metastasis between two groups. A: Comparison of length time of liver metastasis, showing no significant difference; B: Comparison of disease-free survival, showing no significant difference; C: Comparison of overall survival, showing a statistically significant difference (P = 0.0337).
During our study, we identified four subtypes of primary expanding CRC and two subtypes of primary infiltrating cancers. Awareness of these morphological variations is critical in order to appropriately subclassify the primary CRCs. Zoning on the epithelial-stromal interface, we found that the infiltrating CRC had higher TBS,whereas the expanding cancer was more prone to form CDR. Our observation is in keeping with the previous report on the prognostic value of TBS and CDR of primary CRC[26-29]. To the best of our knowledge, this study is the first comprehensive morphological sub-classification of the growth patterns of primary CRCs in association with clinical follow-up data and corresponding HGPs of CRCLMs.
Using a standard formula, we analyzed the sensitivity, specificity, PPV, and NPV of selected pathological characteristics (HGP, TBS, and CDR) in predicting the HGPs of CRCLMs. Our results indicated that combined EGP, low TBS, and positive CDR of primary cancer could be used to predict the DGP of CRCLMs, whereas IGP alone of primary cancer could be the best to predict the RGP of CRCLMs. Once validated by larger set of cases, these parameters have the potential for clinical application.
The prognostic value of immunohistochemical markers such as microsatellite instability (MSI), BRAF V600E mutation, and PD-L1 expression has been reported[30-33].However, there were no studies on the association between the expression of these IHC markers and the HGPs of CRC. Our study did not reveal any significant differences in the tumor cell expression of these IHC markers between the two groups.
It is reasonable to expect that the genomic makeup of the primary CRC plays an important role in determining the HGP of CRCLMs. However, to the best of our knowledge, there has been no report on the specific genomic drivers of the primary tumor that determine the specific growth pattern of liver metastasis. If the growth patterns of liver metastasis could be predicted based on the molecular biomarkers present in the primary CRC and each of the growth patterns could be associated with a different underlying biology, this could have important implications in the stratification of patients for the oncological treatment[34]. We compared the mutation rate of genes related to metastasis (WNA5A, TIMP1, MMP-1, MMP-2, COX-2, and HIF-1α), angiogenesis (VEGF, TGF, EGF, and TNF), epithelial-mesenchymal transition(E-cadherin, FGF, P63, and FOXC2), oncogenes (C-myc, K-ras, and Bcl-2), tumor suppressor genes (p53, APC, and NGX6), and other genes, such as Survivin and CIAPIN1, between the two groups[35-39]. The only gene that stands out is phosphoinositide-3-kinase, catalytic, alpha polypeptide (PIK3CA), which was present in 40% of tumors with desmoplastic group pattern in the CRCLMs. PIK3CA is an essential element of the signaling pathway of phosphatidylinositol-3 kinase (PIK3)downstream of EGFR. The PIK3CA mutation activates the PIK3 signaling pathway,improves cell proliferation, and ultimately leads to carcinogenesis[40]. It is associated with angiogenesis as it is essential in endothelial cell migration during vascular development through vascular endothelial growth factor-A (VEGFA) signaling,possibly by regulating RhoA activity[41]. The significantly higher expression of PIK13CA in primary CRC with desmoplastic liver metastasis indicates that metastasis can become vascularized through sprouting angiogenesis, in a process stimulated by VEGFA. In addition to PIK3CA, we also found that BRCA-1, BRCA-2, and BRAF genes were present only in primary CRC with desmoplastic liver metastasis, and SMAD, ERBB-2, ERBB-3, LRP2, and SDK1 genes were present only in CRCs with invasive liver metastasis. Once these findings are validated with a larger set of cases,these growth pattern-related genomic abnormalities could become new targets for precision therapy.
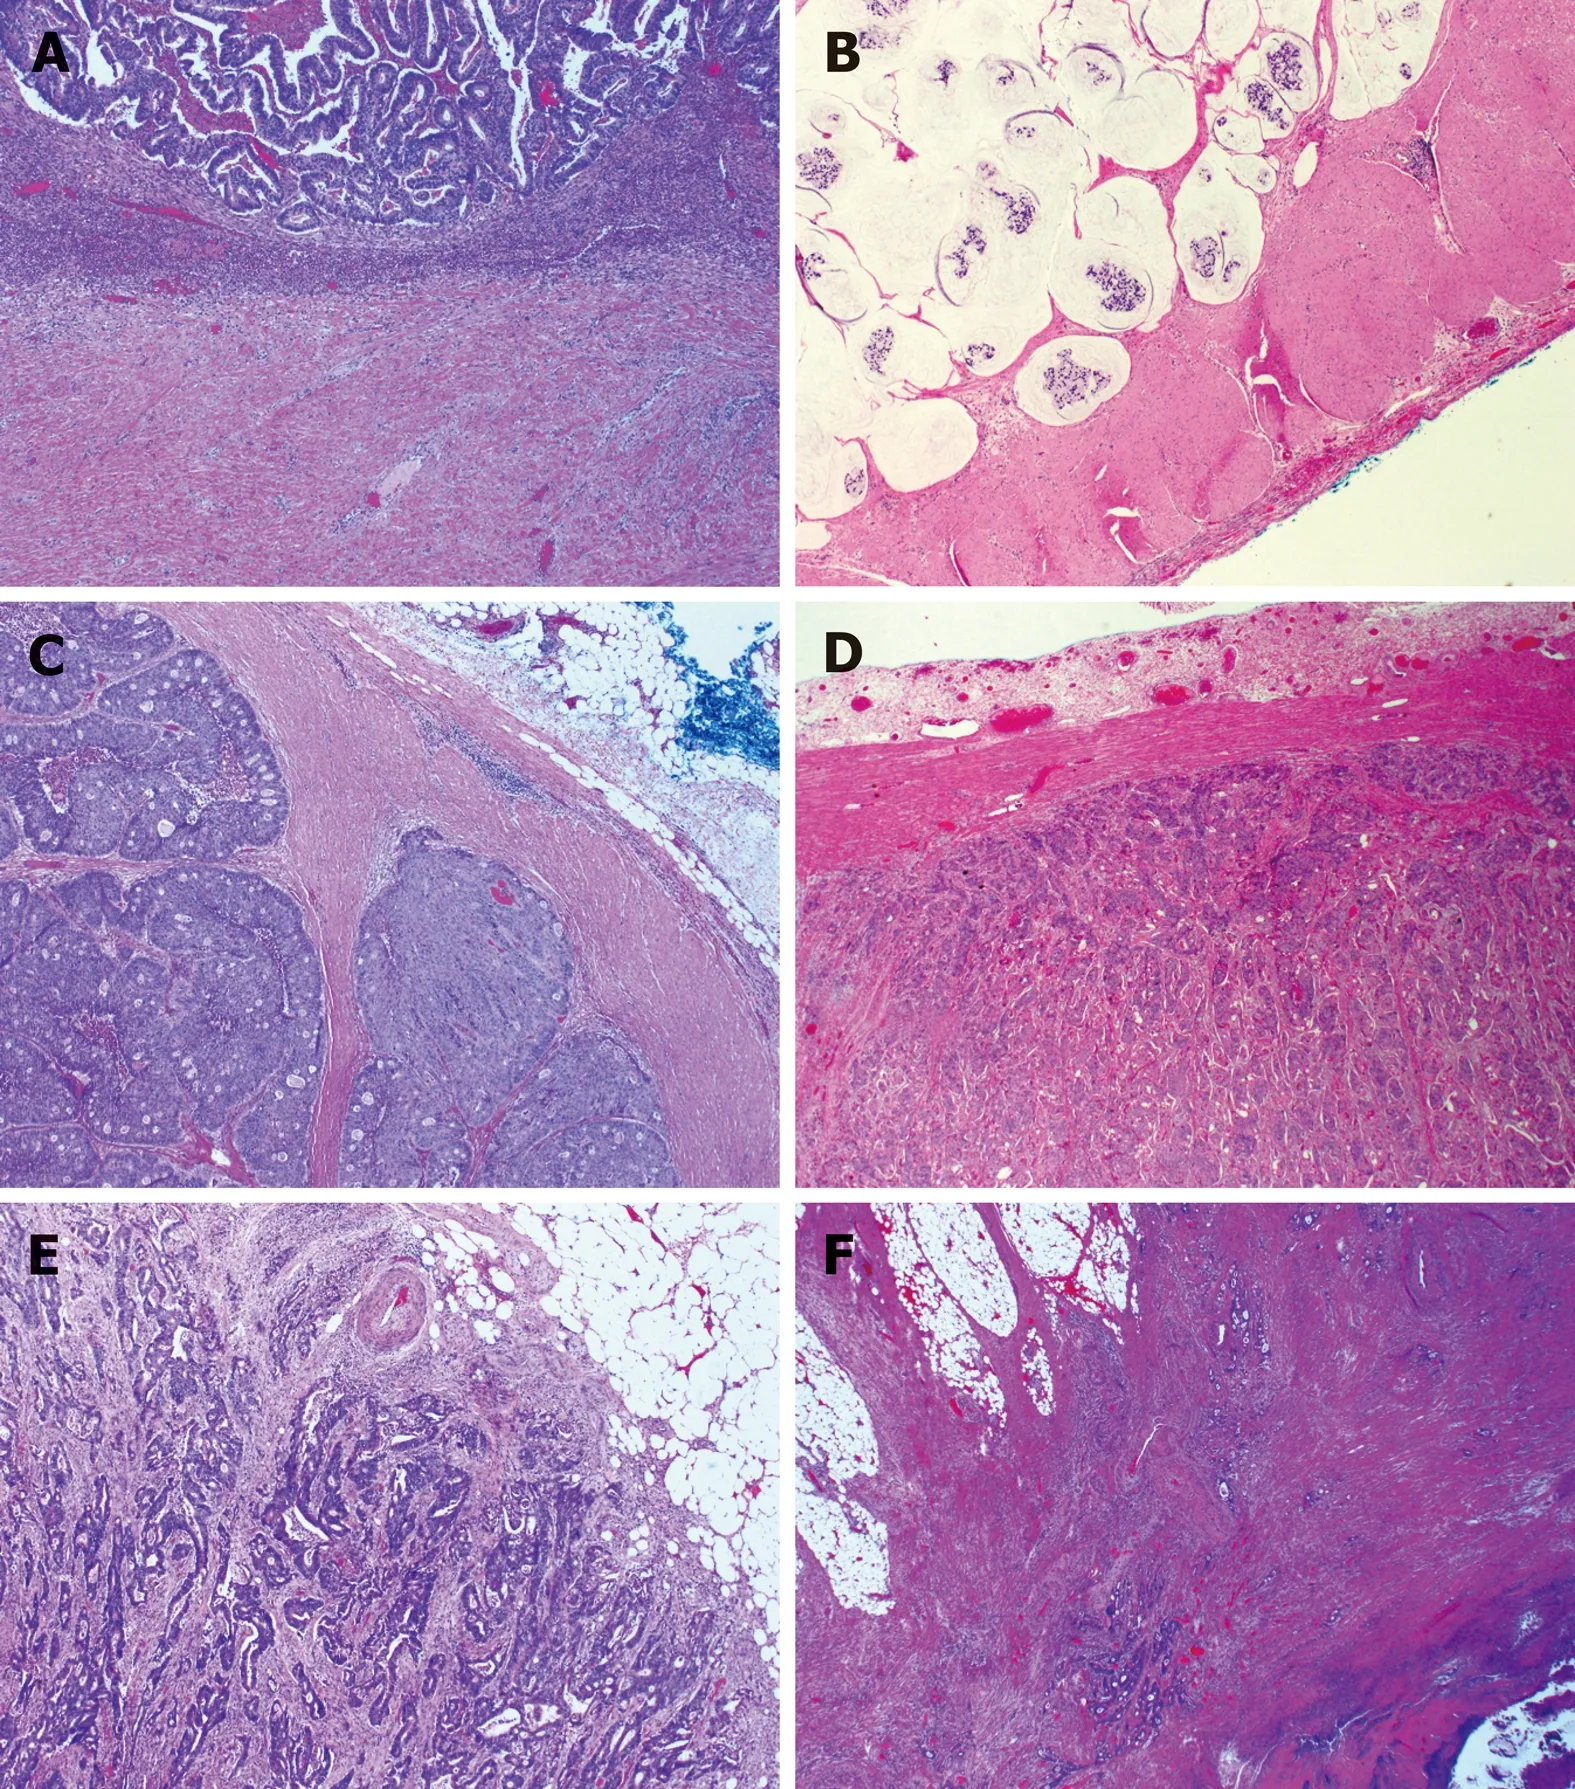
Figure 4 Subtypes of histologic growth pattern of primary colorectal carcinoma. A: Ordinary expanding, where the tumor gland pushes the stroma and forms a sharp dividing line at the interface; B: Mucinous expanding, where pools of tumor epithelium containing mucin pushes the stroma and forms a sharp dividing line at the interface; C:Cribriform expanding, where the tumor gland at the invasive front forms a round cribriform structure and there is a clear dividing line between the tumor and the surrounding stroma; D: Micropapillary expanding, where the tumor cells at the invasive front forms micropapillary architecture and there is a clear dividing line between the tumor and the surrounding stroma; E: Ordinary infiltrating, where tumor cells infiltrate to the stroma and connect to the original tumor mass; F: Skip infiltrating, where there is a gap (>0.5 cm) of non-neoplastic tissue between the main tumor bulk and the invasive front.
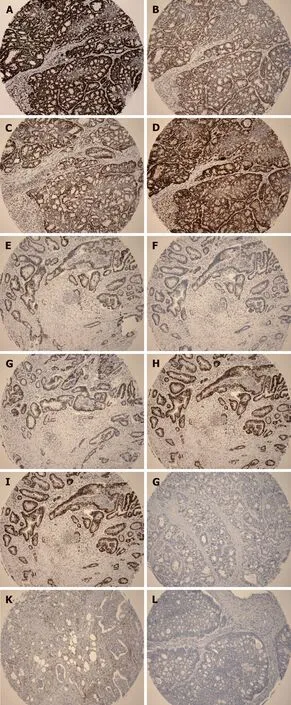
Figure 5 Representative immunohistochemical images. A: Positive staining for MLH1; B: Positive staining for MSH2; C: Positive staining for MSH6; D: Positive staining for PMS2; E: Positive staining for MLH2; F: Negative
Although the existence of two invasive phenotypes (expanding or infiltrating) in CRC is now well recognized and their prognostic implications proven, the biological mechanisms for their existence remain unexplained. It is unclear why some tumors cause a desmoplastic and angiogenic response while others adopt the replacement growth pattern and acquire nutrition through vessel co-option. In addition to the staining for MSH2; G: Positive staining for MSH6; H: Positive staining for PMS2; I: Positive staining for BRAF V600E;J: Negative staining for BRAF V600E; K: Positive staining for PD-L1; L: Negative staining for PD-L1. A-D is the same case; E-H is the same case.biology of primary tumor cells, the surrounding liver microenvironment may also play a role in determining the growth pattern or dependence of angiogenesis. One possible explanation for the desmoplastic or replacement liver metastasis is that these HGPs summarize the different responses of the liver to injury[4]. Fibrosis in the desmoplastic liver metastasis may be mediated by the same biological mechanisms which drive liver fibrosis in response to an injury[42]. In addition, replacement HGP is similar to liver regeneration because cancer cells replace liver cells in the same way that new liver cells replace old liver cells during liver regeneration[43]. Another explanation is that the different tumor growth patterns are related to differential gene expression, which may be a driving factor for HGP. Sakariassen et al[44]investigated that vessel co-opting glioblastomas (GBMs) upregulated gene expression associated with fetal development and cell motility, whereas angiogenic GBMs had higher angiogenic regulatory factors, such as VEGF and angiopoetin-2 expression. In the present study, mutation of the PIK3CA gene was present only in the primary CRC with desmoplastic CRCLMs, which further validated its role as a marker for sprouting angiogenesis and a potential target for anti-angiogenic gene therapy.
In summary, primary CRCs with an EGP have a better OS than those with an IGP.Expanding CRCs tend to develop desmoplastic liver metastasis, whereas infiltrating cancers tend to develop replacement liver metastasis. Combined HGP, TBS, and CDR of primary CRC could be used to predict the HGPs of liver metastasis. Up to 40% of primary CRCs with an EGP showed PIK3CA gene mutations in contrast to 0% of primary CRCs with an IGP. These genomic differences, if validated in a larger cohort of cases, have the potential to become not only clinically applicable diagnostic and prognostic biomarkers but also therapeutic targets of genomic engineering.
ACKNOWLEDGEMENTS
We thank Dr. Logan Walsh at Department of Human Genetics, Rosalind and Morris Goodman Cancer Research Center, McGill University for his assistance in analyzing the whole exome sequencing data, and associate professor Jianfeng Luo at Department of Biostatistics, School of Public Health, Fudan University for the help of biostatistical analysis.
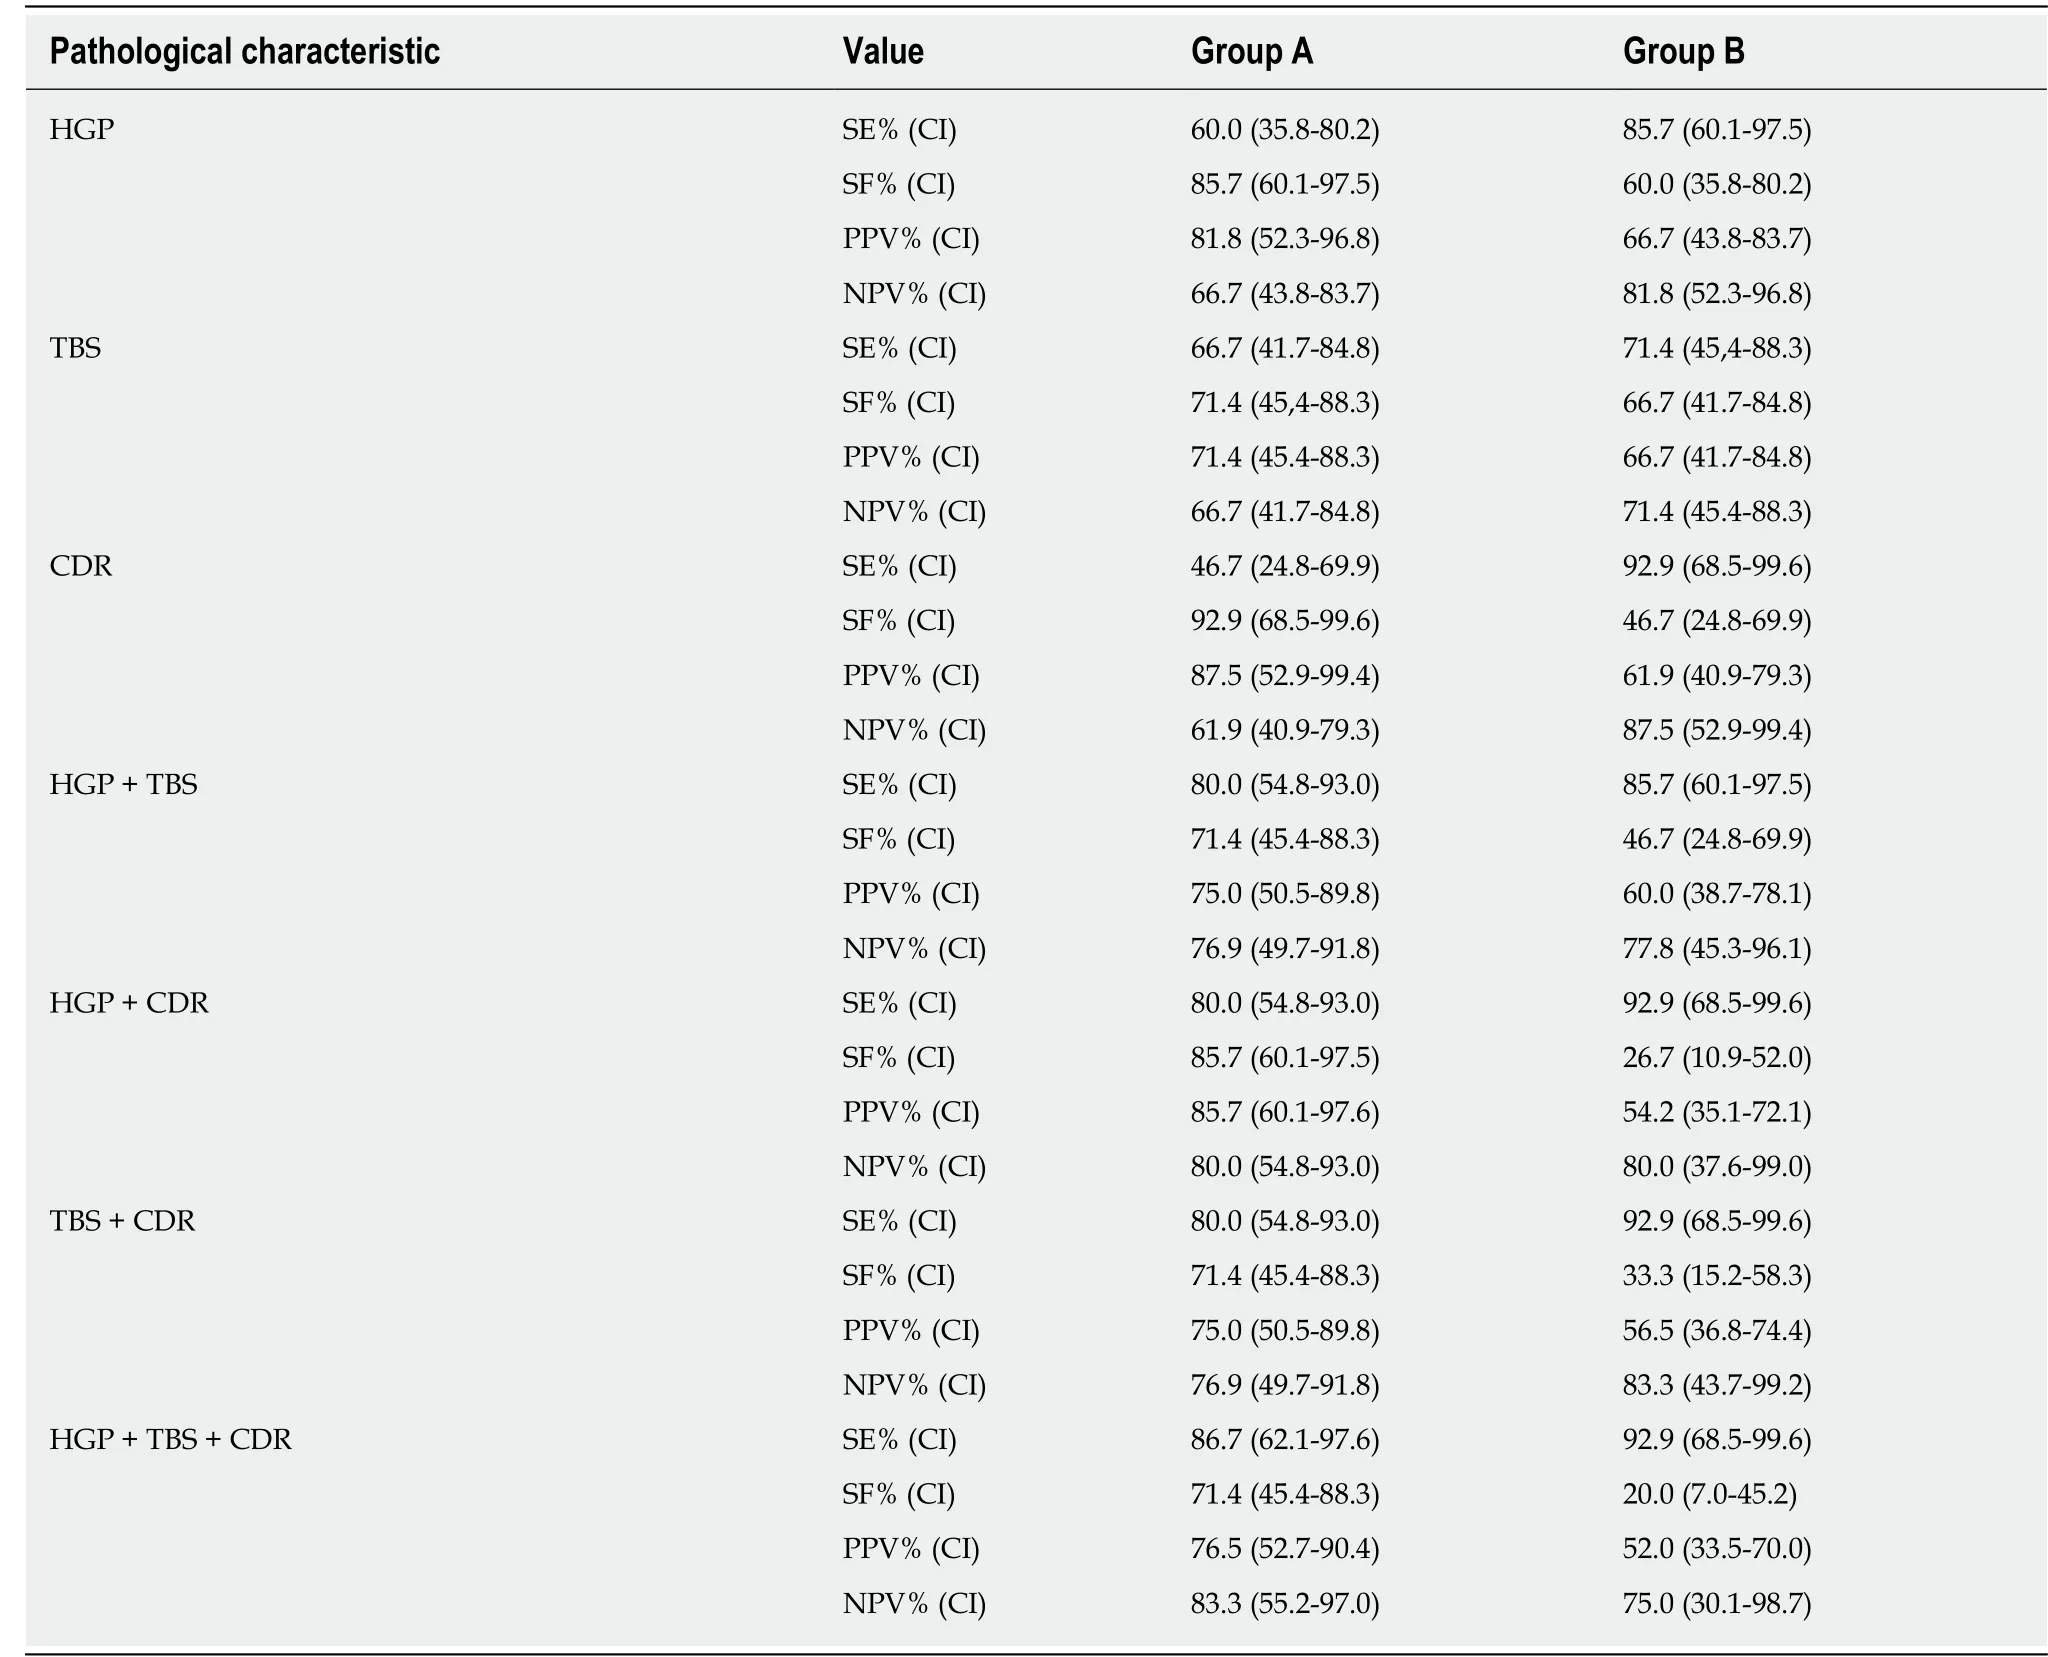
Table 3 Value of selected pathological characteristics in predicting the histological growth patterns of colorectal carcinoma liver metastasis
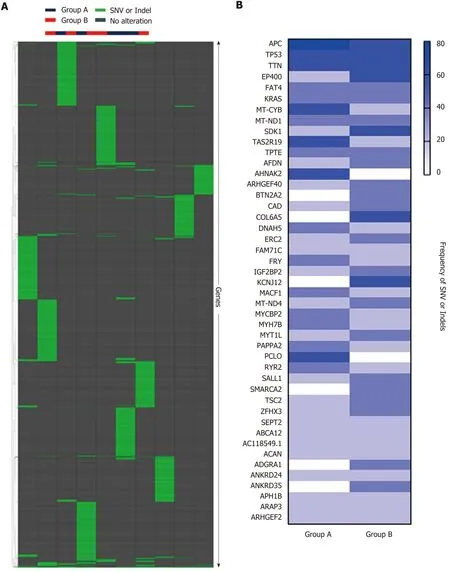
Figure 6 Whole exome sequencing analysis. A: Hierarchical clustering of Groups A and B based on single nucleotide variant (SNV) and indels, showing no significant difference between the two groups. B: Frequency of SNV or indels in Group A and Group B, showing no significant difference between the two groups.SNV: Single nucleotide variant.
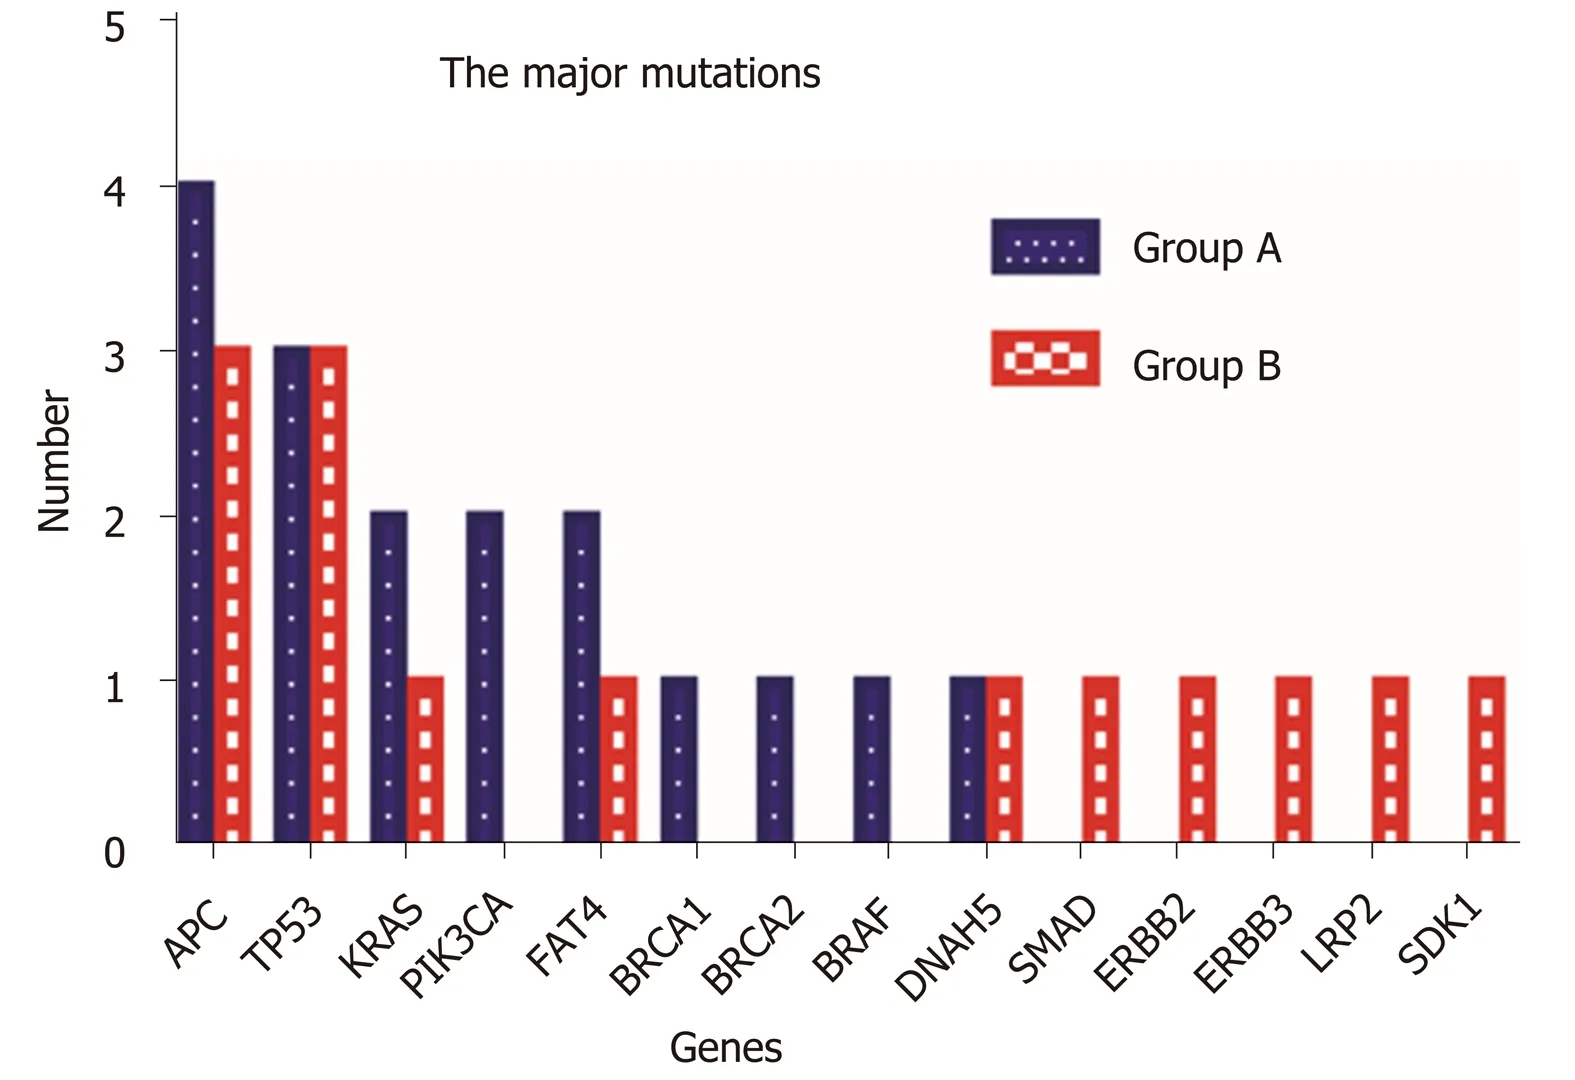
Figure 7 Comparison of the major mutations between Group A and Group B. Fourteen major gene mutations were identified. PIK3CA, BRCA1, BRCA2, and BRAF mutations were only observed in Group A, and SMAD, ERBB2, ERBB3, LRP2, and SDK1 mutations were identified only in Group B.
ARTICLE HIGHLIGHTS
Research background
Different histological growth patterns (HGPs) of colorectal carcinoma (CRC) liver metastasis are associated with patients' prognosis and response to antiangiogenic therapy.
Research motivation
Through studying the relationship between the different HGPs of liver metastasis and clinicopathological and genomic characteristics of primary cancer, we aimed to evaluate whether certain clinicopathological and genomic features of primary CRC could predict the HGPs of liver metastasis
Research objective
To understand the biology of the primary CRCs in association with different HGPs of liver metastasis, and to identify histological and biology markers in the primary tumor that could predict the HGPs of liver metastasis.
Research methods
A total of 29 patients with paired resections of both primary CRC and liver metastasis were divided into two groups: A (15 cases with desmoplastic liver metastasis) and B (14 cases with replacement liver metastasis). Clinical information was obtained from patients' charts. Mismatch repair proteins, BRAFV600E, and PD-L1 were evaluated by immunohistochemistry. Five cases from each group were randomly selected for WES analysis.
Research results
In the primary tumor, expanding growth pattern, low tumor budding score (TBS), and Crohn's disease-like response (CDR) were associated with desmoplastic liver metastasis and better overall survival, whereas infiltrating growth pattern alone of primary carcinoma could predict the replacement liver metastasis and worse overall survival (P < 0.05). On WES analysis, primary carcinoma with desmoplastic liver metastasis showed mutations in APC (4/5); TP53 (3/5);KRAS, PIK3CA, and FAT4 (2/5); BRCA-1, BRCA2, BRAF, and DNAH5 (1/5), whereas primary carcinoma with replacement liver metastasis showed mutations in APC and TP53 (3/5); KRAS,FAT4, DNH5, SMAD, ERBB2, ERBB3, LRP1, and SDK1 (1/5).
Research conclusion
The primary CRCs with an expanding growth pattern have a better overall survival that those with an infiltrating growth pattern. Expanding CRCs tend to develop desmoplastic liver metastasis, whereas infiltrating cancers tend to develop replacement liver metastasis. Combined HGP, TBS, and CDR of primary CRC could be used to predict the HGPs of liver metastasis. Up to 40% of primary CRCs with an expanding growth pattern show PIK3CA gene mutations in contrast to 0% of primary CRCs with an invasive growth pattern.
Research perspectives
Multicenter collaborative studies with a larger number of patients and prospective studies to assess the predictive value of the clinicopathological features of primary CRC on the HGPs of its liver metastasis could help to further validate our results. These genomic differences between the two groups of primary CRC, if validated in a larger cohort of case, have the potential to become not only clinically applicable diagnostic and prognostic biomarkers but also therapeutic targets of genomic engineering.
杂志排行
World Journal of Gastroenterology的其它文章
- Diuretic window hypothesis in cirrhosis: Changing the point of view
- Fluoroquinolones for the treatment of latent Mycobacterium tuberculosis infection in liver transplantation
- Reactivation of hepatitis B virus infection in patients with hemolymphoproliferative diseases, and its prevention
- Current status of endoscopic retrograde cholangiopancreatography in patients with surgically altered anatomy
- Choledochal cysts: Similarities and differences between Asian and Western countries
- Gastro-duodenal disease in Africa: Literature review and clinical data from Accra, Ghana
