两个基于双salamo型配体的镍(Ⅱ)和锌(Ⅱ)配合物的合成、结构、Hirshfeld分析和荧光性质
2019-07-10刘玲芝李肖妍康全鹏董文魁
刘玲芝 于 盟 李肖妍 康全鹏 董文魁
(兰州交通大学化学与生物工程学院,兰州 730070)
0 Introduction
Salen-type ligands and their transition metal,alkaline earth,and rare earth metal complexes[1-5]have been extensively investigated in modern coordination chemistry for several decades[6-10].Moreover,these complexes have been studied in obtaining biological systems[11-13],ion recognitions[14],supramolecular buildings[15-22],luminescence properties[23-28],catalyses[29],nonlinear optical materials[30],magnetic materials[31].Recently,a novel salen-type analogue,salamo,has been developed[32-40].The salamo-like ligands have their attractivepropertiesin supramolecular architectures[41-43],catalyses[44,45],electrochemical conducts[46],luminescent and magnetic materials[47-52],and biological fields[53].
Based on these above views,we have devised and prepared two new homo-trinuclear Ni(Ⅱ) and Zn(Ⅱ) complexes([Ni3(L)(μ-OAc)2(CH3OH)3]·CH3OH·0.25CHCl3(1)and[Zn3(L)(μ-OAc)2(CH3OH)(H2O)]·2CH3OH(2))with a flexible and symmetric bis(salamo)-like ligand H4L.Meanwhile,the fluorescent properties and Hirshfeld surfaces analyses of complexes 1 and 2 were also studied in detail.
1 Experimental
1.1 Materials and physical measurements
All solvents and chemicals were analytical grade and obtained from Tianjin Chemical Reagent Factory.Melting points were measured by a microscopic melting point apparatus made by the Beijing Taike Instrument Limited Company and the thermometer was uncorrected.Elemental(C,H,and N)analyses were performed on a GmbH Variuo EL V3.00 automatic elemental analyzer (Elementar,Berlin,Germany).Elemental analyses for Zn and Ni were obtained using an IRIS ER/S-WP-ICP atomic emission spectrometer(Elementar,Berlin,Germany).1H NMR spectra were determined using a German Bruker AVANCE DRX-400 spectrometer.IR spectra were recorded on a VERTEX70 FT-IR spectrophotometer,with samples prepared as KBr(500~4 000 cm-1)and CsI(100~500 cm-1)pellets.UV-Vis absorption and fluorescence spectra were recorded on a Shimadzu UV-2550(Shimadzu,Japan)and Hitachi F-7000(Hitachi,Tokyo,Japan)spectrometers,respectively.Thermal analyses(TGA)were carried out at a heating rate of 5℃·min-1on a ZRY-1P thermoanalyzer.X-ray single crystal structure determinations of complexes 1 and 2 were carried out on a Bruker APEX-ⅡCCD(Bruker AVANCE,Billerica,MA,USA)and SuperNova(Dual,Cu at zero)Eos diffractometers,respectively.The Hirshfeld surfaces analyses of complexes 1 and 2 were calculated using Crystal Explorer program.
1.2 Synthesis of the ligand H 4L
2,3-Dihydroxynaphthalene-1,4-dicarbaldehyde and 1,2-bis(aminooxy)ethane were synthesized according an analogous reported procedure[41,44,47].Major synthetic route to the ligand H4L are presented in Scheme 1.
2-Hydroxy-5-nitrobenzaldehyde (341.6 mg,2.01 mmol)dissolved in ethanol solution (50 mL)was added slowly to a colorless ethanol solution(20 mL)of 1,2-bis(aminooxy)ethane(280.2 mg,3.00 mmol)for more than 3 h.Subsequently,the above solution was heated at ca.55℃for about 4 h.The solution was concentrated by vacuum distillation.Then,the reaction mixture was separated by column chromatography with ethyl acetate/chloroform (1 ∶15,V/V)and expected intermediate product 2-(O-(1-ethyloxyamide))oxime-5-nitrophenol was gained.

Scheme 1 Synthetic route to H4L
A nucleophilic addition reaction between 2,3-dihydroxynaphthalene-1,4-dicarbaldehyde and 2-(O-(1-ethyloxyamide))oxime-5-nitrophenol was performed according to the previously literature[39].The orange solid of 2,3-dihydroxynaphthalene-1,4-dicarbaldehyde(216.19 mg,1 mmol)and the yellowish solid of 2-(O-(1-ethyloxyamide))oxime-5-nitrophenol(482.14 mg,2 mmol)were ground respectively,and then dissolved in absolute ethanol(20 mL).After the mixture was heated under reflux at ca.60 ℃ for 6 h,yellow precipitate was formed.A part of the solvent was removed under reduced pressure to obtain the crude products,which were filtered and washed several times with n-hexane to obtain the desired yellow crystalline product of H4L.Yield:82.0%.m.p.166~168 ℃.Anal.Calcd.for C30H26N6O12(%):C,54.38;H,3.96;N,12.68.Found(%):C,54.50;H,3.90;N,12.47.
1.3 Synthesis of complex 1
A solution of nickel(Ⅱ)acetate tetrahydrate(7.47 mg,0.03 mmol)in methanol(2 mL)was added to a stirring solution of the ligand H4L (6.62 mg,0.01 mmol)in chloroform (3 mL)at room temperature.The color of the mixed solution immediately turned yellowgreen.The mixture was filtered and the filtrate was allowed to stay in room temperature for slow evaporation.After about several days,several transparent block-shaped crystals suitable for X-ray measurements were obtained.Yield:78.5%.Anal.Calcd.for[Ni3(L)(μ-OAc)2(CH3OH)3]·CH3OH·0.25CHCl3(C38.25H44.25Cl0.75Ni3N6O20)(%):C 41.36;H 4.02;N 7.57;Ni 15.85.Found(%):C 41.49;H 4.11;N 7.47;Ni 15.76.
1.4 Synthesis of complex 2
To a stirred solution of H4L(6.62 mg,0.01 mmol)in absolute CHCl3(2 mL)were added a solution of zinc(Ⅱ) acetate tetrahydrate (6.60 mg,0.03 mmol)in absolute methanol(3 mL).The mixture was filtered after proper stirring for 10 min and the clear pale yellow solution was then cooled to room temperature.After allowed standing at room temperature for two weeks,yellow crystals suitable for X-ray diffraction analyses were collected.Yield:62.9%.Anal.Calcd.for[Zn3(L)(μ-OAc)2(CH3OH)(H2O)]·2CH3OH(C37H42Zn3N6O20)(%):C 40.89;H 3.90;N 7.73;Zn 18.05.Found(%):C 41.03;H 3.84;N 7.67;Zn 17.96.
1.5 Crystal structuredeterminationsof complexes 1 and 2
Suitable crystals of complexes 1 and 2 with approximate dimensions of 0.16 mm×0.17 mm×0.22 mm and 0.14 mm×0.15 mm×0.17 mm were performed on a Bruker APEX-ⅡCCD diffractometer with a graphite monochromated Mo Kα radiation source(λ=0.071 073 nm)at 153(2)K and SuperNova(Dual,Cu at zero)Eos diffractometer using a graphite monochromated Cu Kα radiation source (λ=0.154 184 nm)at 173.00(10)K,respectively.Diffraction data were collected by “multi-scan” mode.Semi-empirical absorption corrections were applied using SADABS(complex 1)and CrysAlisPro (complex 2)programs.The structures were solved by direct methods using refined with SHELXL-2015[54].All hydrogen atoms were added theoretically and difference-Fourier map revealed the positions of the remaining atoms.All non-hydrogen atoms were refined anisotropically using a full-matrix least-squares procedure on F2with SHELXL-2014[54].The crystal data and experimental parameters relevant to the structure determinations are listed in Table 1.
CCDC:1891627,1;1891628,2.

Table 1 Crystal and refinement parameter data for complexes 1 and 2
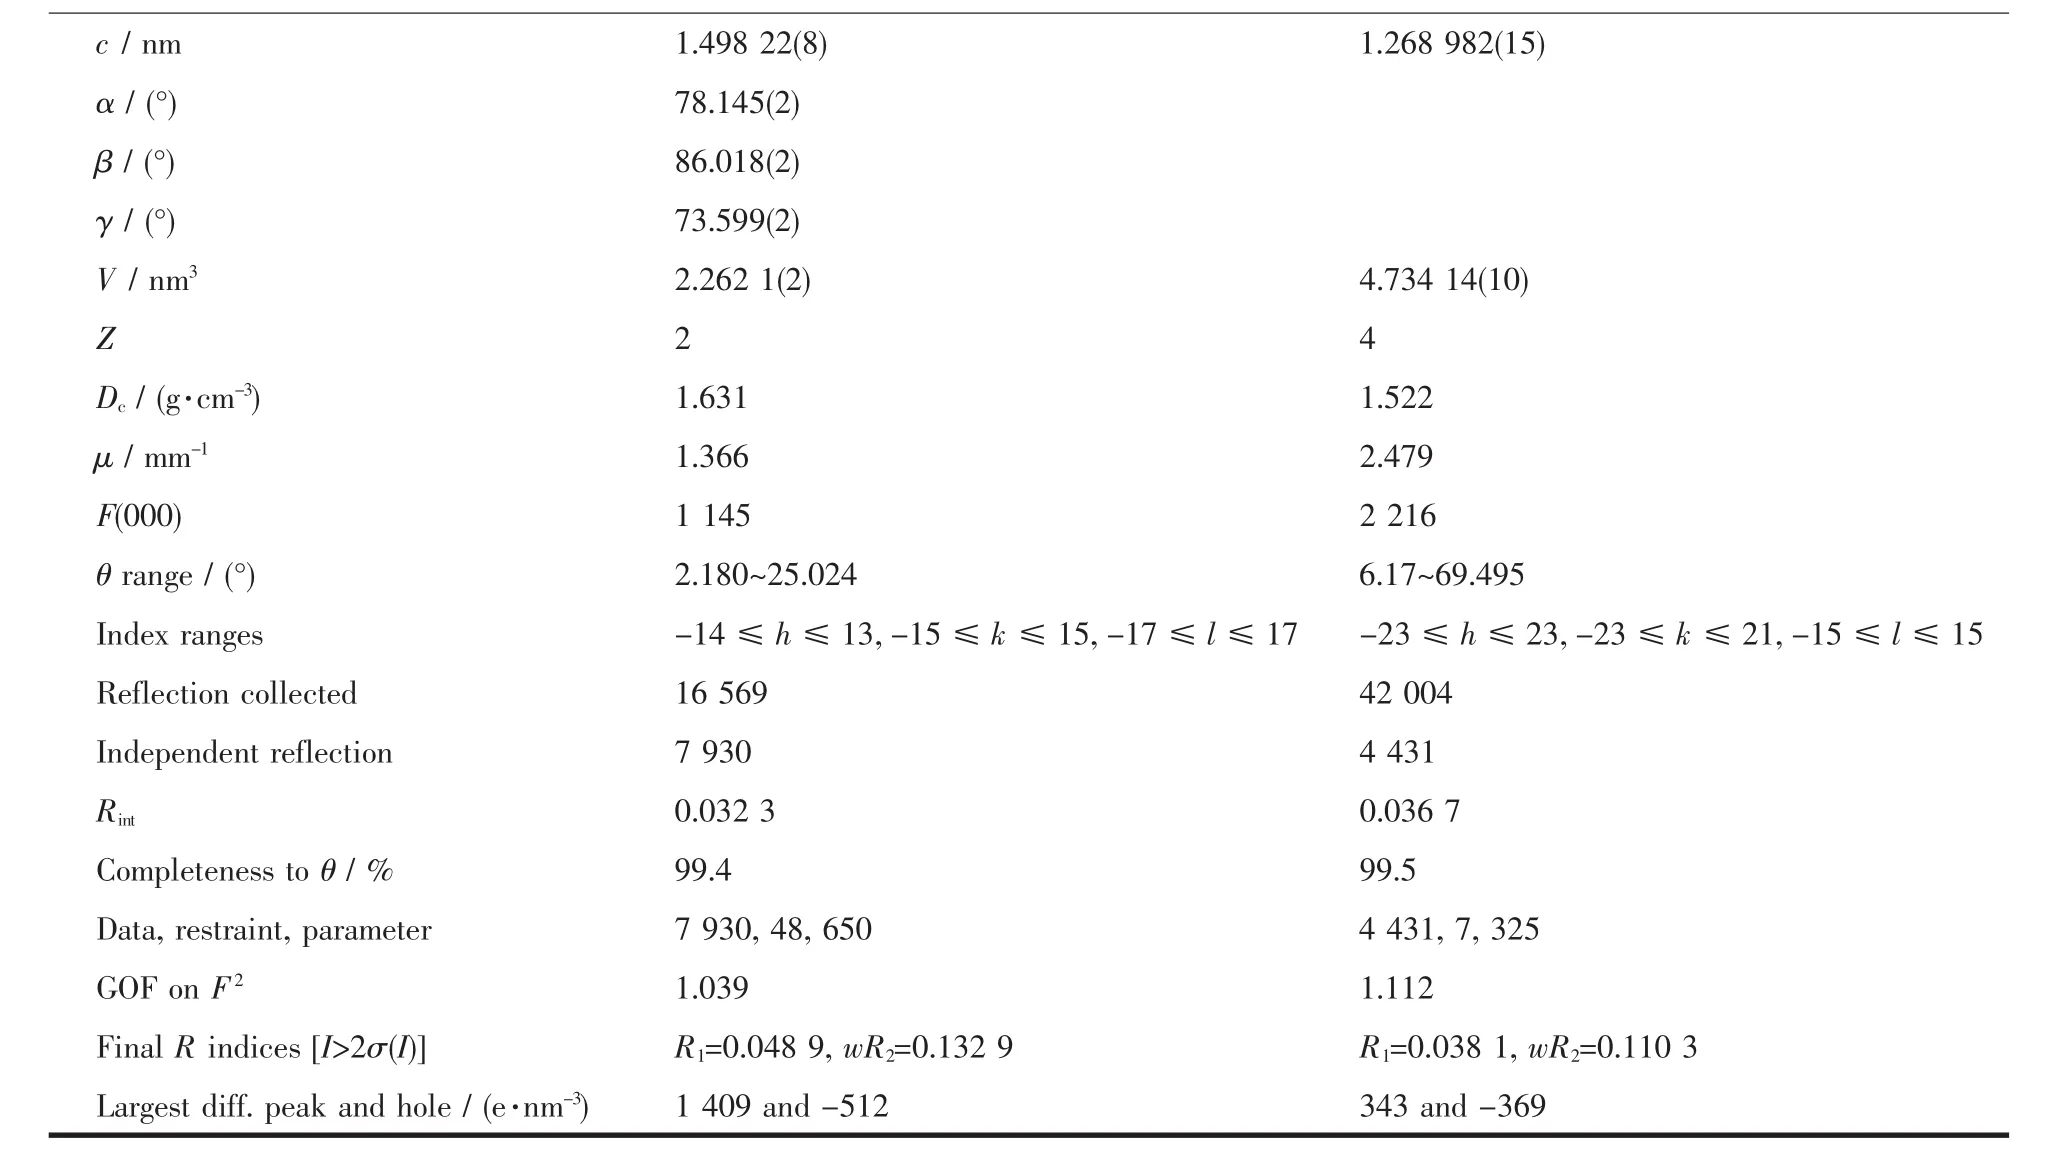
Continued Table 1
2 Results and discussion
2.1 Crystal structure of complex 1
Single-crystal X-ray diffraction analysis reveals that complex 1 is an asymmetric homo-trinuclear compound,which crystallizes in a triclinic system,space group P1 with Z=2.The crystal structure of complex 1 and the coordination environment of Ni(Ⅱ)ions are shown in Fig.1.Selected bond lengths and angles of complex 1 are listed in Table 2.
Detailed structural analysis reveals that complex 1 is self-assembled by the coordination of three Ni(Ⅱ)ions,a fully deprotonated ligand L4-unit,two μ-acetato ions,three coordinated methanol molecules, one lattice methanol and a quarter of chloroform molecules.In the crystal structure of complex 1,two μ-acetato ions bridge three Ni(Ⅱ) ions in a μ-fashion,which probably contributes to the cooperative formation of complex 1.The terminal Ni1 ion is hexacoordinated,which occupies the N2O2cavity from the L4-unit and oneμ-acetato oxygen atom(O16)and one oxygen atom (O18)of the methanol molecule,forming a distorted octahedral geometry.The Ni3 ion has above similar coordination environment and coordination geometry.Meanwhile,the central Ni2 ion is held by an O6cavity provided by three oxygen coordination sites of the L4-unit in assistance of two μ-acetato oxygen atoms(O14 and O15)and one oxygen atom(O17)from the methanol molecule to form a distorted octahedral geometry.
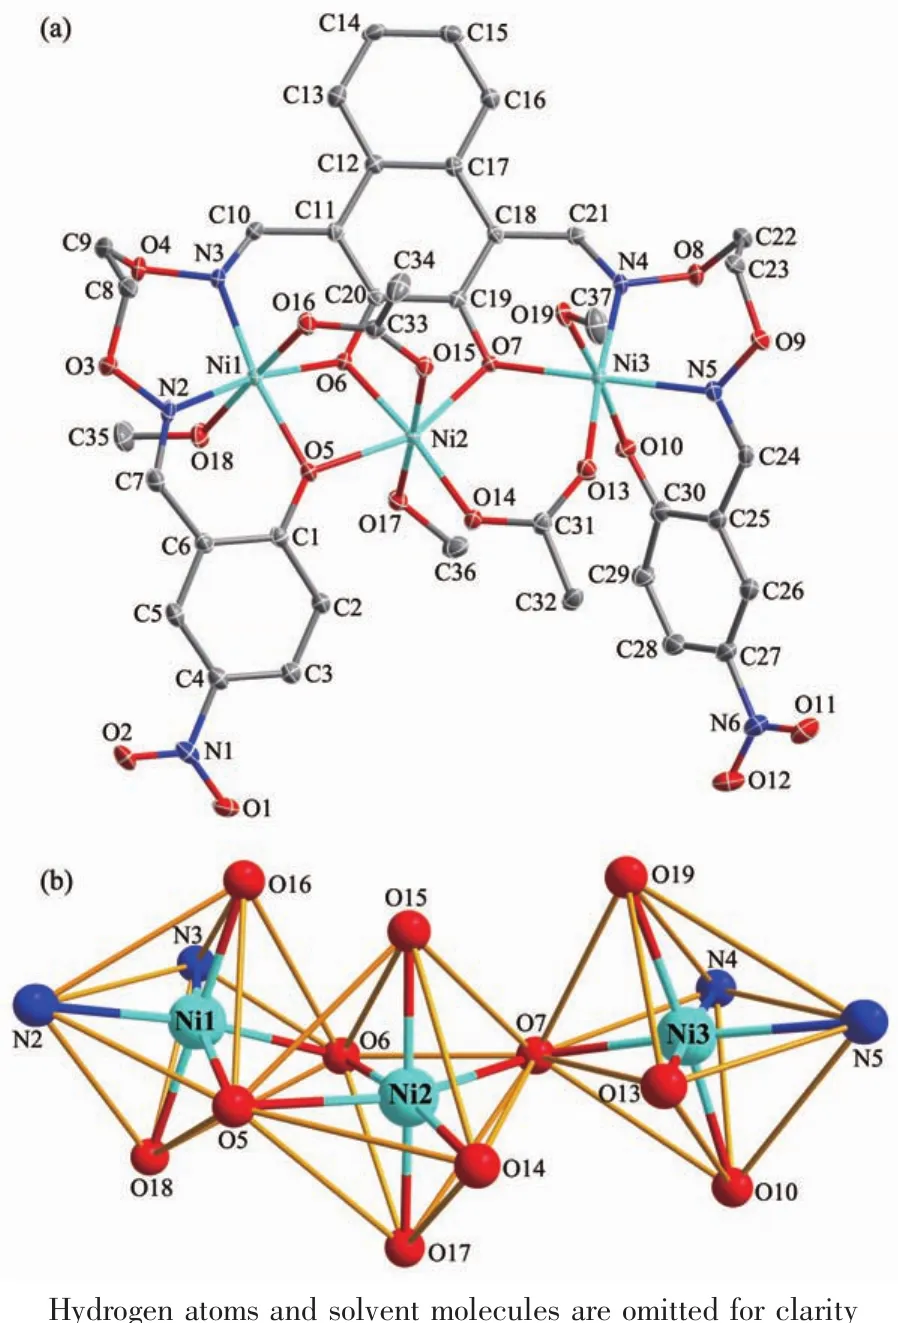
Fig.1 (a)Molecular structure of complex 1 with 30%probability displacement ellipsoids;(b)Coordination polyhedrons for the Ni(Ⅱ)ions
Ni1 and Ni2 ions are bridged by O15 and O16 atoms with a Ni1…Ni2 distance of 0.303 53(6)nm,and Ni2 and Ni3 ions are bridged by O13 and O14 atomswith a Ni2…Ni3 distance of 0.350 02(4)nm.The bond distances of Ni-O are in a range of 0.197 1(2)~0.214 9(2)nm,and the average distance of Ni-Obonds is 0.205 45 nm.A stable chelating Ni(Ⅱ)complex is formed between H4L and the Ni(Ⅱ) ions,while the methanol molecules bind to the Ni(Ⅱ) ions,which result in the enhancement of the inflexibility and the formation of two perpendicularly crossing planes.

Table 2 Selected bond distances(nm)and angles(°)for complexes 1 and 2
Intermolecular interactions,especially classical and non-classical hydrogen bondings,are playing a crucial role in the formation of crystalline solids and their physiochemical properties.The hydrogen bonding interactions are listed in Table 3 and the packing arrangement of molecules is represented in Fig.3.As illustrated in Fig.2,seven pairs of intramolecular hydrogen bondings are formed.Furthermore,a 3D supramolecular network structure of complex 1 is composed of two parts[55-59].The first part is linked by five pairs of intermolecular hydrogen bondings.It is worth noting that another part is linked by C-H…π(C32-H32C…Cg1(Cg1:C25-C26-C27-C28-C29-C30)interactions[25].

Fig.2 View of intramolecular hydrogen bonding interactions of complex 1

Table 3 Hydrogen bonding and C-H…πinteractions of complexes 1 and 2
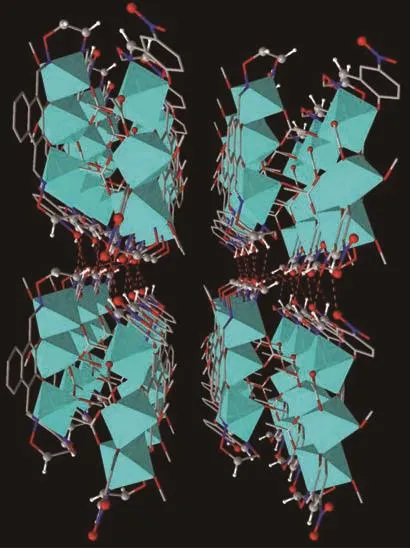
Fig.3 Three dimensional supramolecular architecture of complex 1 by hydrogen bonding and C-H…π interactions
2.2 Crystal structure of complex 2
The crystal structure and atom numberings of complex 2 was determined by X-ray crystallography and is shown in Fig.4.Selected bond lengths and angles of complex 2 are listed in Table 2.
Single crystal X-ray diffraction analysis indicates that complex 2 crystallizes in a tetragonal crystal system,space group I41,and consists of three Zn(Ⅱ)ions,one L4-unit,two μ-acetato ions,one coordinated methanol and water molecules and two lattice methanol molecules.

Fig.4 (a)Molecular structure of complex 2 with 30%probability displacement ellipsoids;(b)Coordination polyhedrons for the Zn(Ⅱ)ions
In the crystal structure of complex 2,we can see that the coordination ratio of the ligand L4-unit to Zn(Ⅱ) ion is 1∶3[47].Meanwhile,two terminal Zn(Ⅱ) ions(Zn1 and Zn1#1)are located in the N2O2cavities and the axial positions are occupied by O7 and O7#1 from twoμ-acetato ions.They are both in penta-coordinated environments and adopt distorted trigonal bipyramidal geometries,which was inferred by calculating the value ofτZn1=0.81[40].The central O6site(O6 and O6#1 from L4-;O8 and O8#1 from μ-acetato ions;O9 and O9#1 from methanol and water molecules,respectively)is occupied by one Zn2 ion,which is hexa-coordinated with a distorted octahedral geometry influenced by Jahn-Teller effect.Two terminal Zn(Ⅱ)ions (Zn1 and Zn1#1)connect central Zn2 ion via a familiar Zn-OZn-O-Zn fashion with O6 and O6#1 from L4-unit as a“bridge”.The coordination between the ligand L4-unit and three Zn(Ⅱ)ions gives rise to a stable chelating complex.
Supramolecular architecture of complex 2 is connected by extensive hydrogen bonding and C-H…π interactions,which plays a major role in the crystal packing modes.In the crystal structure of complex 2,two pair of intramolecular(C18-H18B…O6 and O9-H9A…O4)hydrogen bonding interactions,two significant intermolecular and one significant C-H…π(C9-H9B…Cg2 (Cg2:C13-C14-C15-C15a-C14a-C13a))interactions help to form a 3D supramolecular structure(Fig.5)[60-63].

Fig.5 Three dimensional supramolecular architecture of complex 2 by hydrogen bonding and C-H…π interactions
2.3 FT-IR spectra
The FT-IR spectra of H4L and its corresponding complexes 1 and 2 exhibited various bands in the 4 000~500 cm-1region(Fig.6 and Table 4).

Fig.6 FT-IR spectra of H4L and its complexes 1 and 2
The free ligand H4L exhibited characteristic Ar-O and C=N stretching bands at ca.1 244 and 1 610 cm-1,respectively[48].Upon complexation,those of complexes 1 and 2 shifted to the lower frequencies,which give therefore a proof of the coordination of oxime nitrogen and phenolic oxygen to the Ni(Ⅱ) and Zn(Ⅱ) ions.It can be seen from the Fig.6 that the phenolic O-H stretching vibration band of free ligand H4L exhibited the expected absorption band at ca.3 430 cm-1,whereas this band disappeared in complexes 1 and 2,indicating that the hydroxyl groups of phenolic and naphthalenediol of salamo moieties are completely deprotonated and coordinated with the Ni(Ⅱ) and Zn(Ⅱ)ions.Meanwhile,new O-H vibration bands were observed at 3 445 and 3 435 cm-1in complexes 1 and 2,which belongs to the coordinated methanol molecules.In addition,the bands at 532,527 cm-1and 467,473 cm-1in complexes 1 and 2 are attributed to νM-N)and νM-O,respectively[64-67].These bands are not existed in the spectrum of the free ligand H4L.The facts mentioned above are in accordance with the results of single crystal X-ray diffractions.

Table 4 Main FT-IR spectra data of H4L and its complexes 1 and 2 cm-1
2.4 UV-Vis absorption spectra
We examined the UV-Vis spectra of H4L in 50 μmol·L-1DMF solution at room temperature,and the corresponding Ni(Ⅱ) and Zn(Ⅱ) complexes were analyzed by UV-Vis spectra during addition of aliquots of the transition metal(Ⅱ)ion solutions.
The σ-donor/π-acceptor salamo ligand H4L showed three characteristic high intensity bandslocated atλ=341,358 and 377 nm,which can be assigned to the intra-ligand π-π*transitions[52].The band at 428 nm is associated with the metal-to-ligand charge transfer(MLCT)transition.These bands are related to the non-resolved d-d transitions from the four lowlying d-orbitals(dxz,dyz,dz2,dx2-y2)to the empty(Ni),or filled (Zn)dxyorbital.For the UV-Vis titrations,the measurements were performed in a mixture of DMF aqueous solution due to solubility reasons.Upon the gradual addition of Ni2+/Zn2+to H4L,the absorbance at 377 nm was steadily enhanced until the amount of Ni2+/Zn2+reached 3 equivalents(Fig.7).
2.5 Fluorescence properties
All the fluorescent determinations were put into effect with an entrance slit and exit slit of 10 and 20 nm,respectively,and excitation wavelength was 410 nm.The fluorescence properties of H4L and its corresponding complexes 1 and 2 were investigated at room temperature in wavelength range of 400~650 nm,as shown in Fig.8.

Fig.7 (a)UV-Vis spectral changes of complex 1 of H4L in DMF by the addition of Ni(OAc)2 in distilled water;(b)UV-Vis spectral changes of complex 2 of H4L in DMF by the addition of Zn(OAc)2 in distilled water
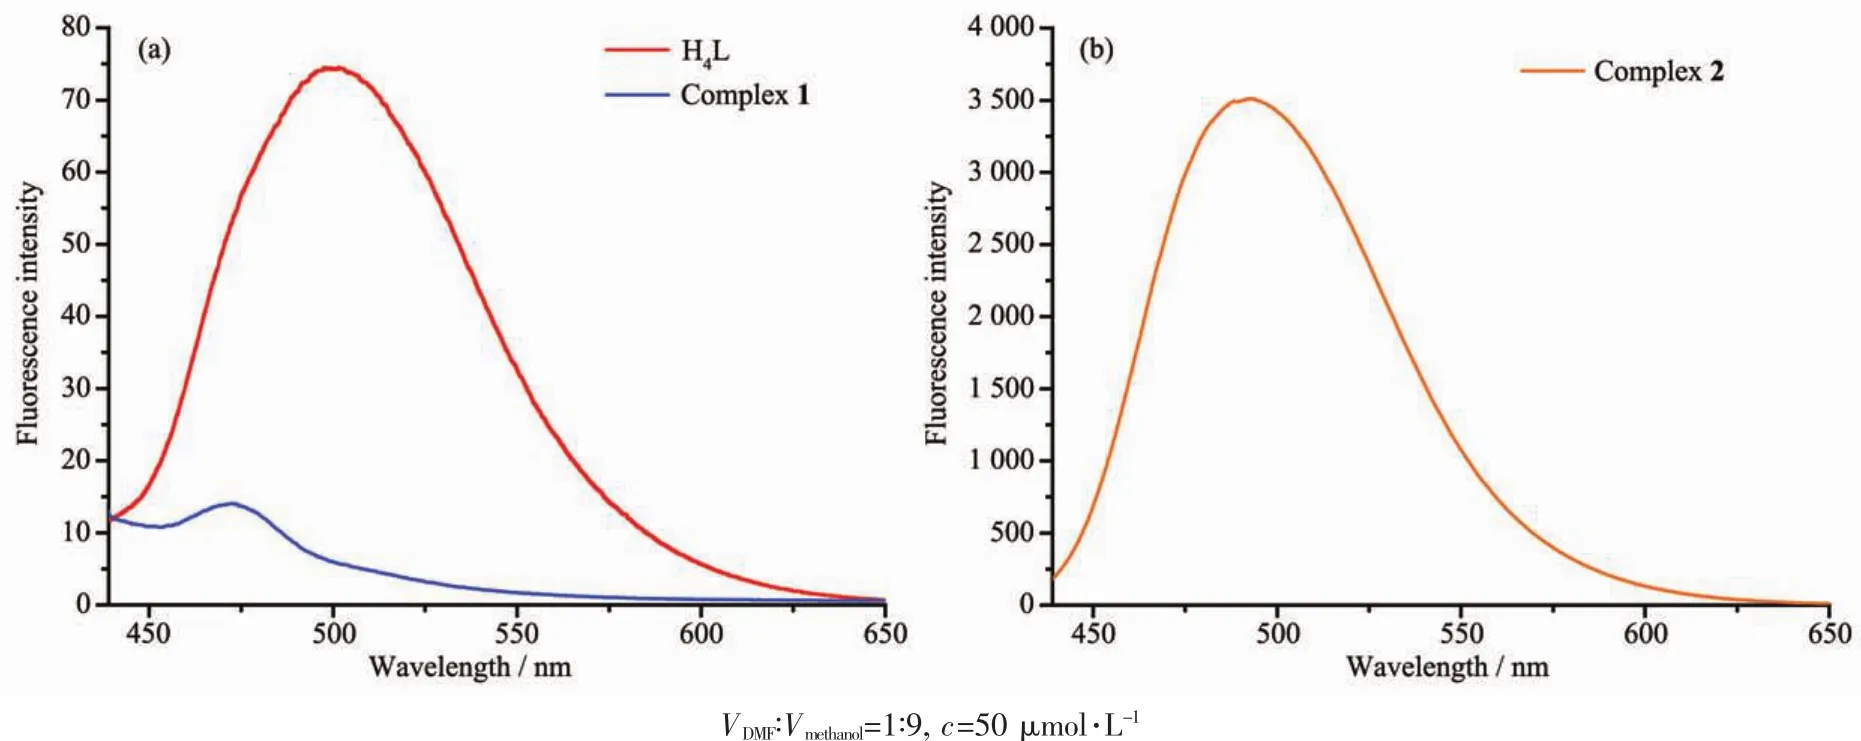
Fig.8 Emission spectra of H4L and its complexes 1 and 2 in DMF+methanol
The spectrum of H4L exhibited a weak emission peak at ca.490 nm upon excitation at 410 nm,and it should be assigned to the intraligand π-π*transition[40,47].Complex 1 showed lower photoluminescence with maximum emission at ca.475 nm.Compared with the ligand H4L,emission intensity of complex 1 reduces obviously,which indicates that the Ni(Ⅱ) ions have a quality of fluorescent quenching,and makes the conjugated system larger.It is worth noting that complex 2 displayed an intense emission peak at ca.490 nm when excited at 410 nm.Meanwhile,compared with the ligand H4L,the emission intensity of complex 2 increased by more than 40 times.
2.6 Hirshfeld surfaces analyses
The Hirshfeld surfaces of H4L and its complexes 1 and 2 were analyzed using CrystalExplorer program.As shown in Fig.9,the Hirshfeld surfaces analyses[68]of complexes 1 and 2 are illustrated,showing surfaces that have been projected over dnorm(standard high resolution),deand shape index.

Fig.9 Hirshfeld surfaces of complexes 1 and 2 mapped with d norm,d e and shape index
When mapped with the function of dnorm,the surfaces of complexes 1 and 2,the bright red regions of the depression in the Hirshfeld surface indicate the existence of the O-H interactions,and the light red spots are due to C-H …O interactions,and other bulging blue regions in the Hirshfeld surface represent C…H/H…C,H···H and O…H/H…O contacts in complexes 1 and 2.
The 2D plots generated[69]correspond to the O…H,C…H,C…C and H…H interactions from the Hirshfeld surfaces of complexes 1 and 2 are shown in Fig.10.For simplicity and clarity,the outline of the entire fingerprint is shown in gray,and the blue region shows different short-range interactions.For each point on the Hirshfeld isosurface,two distances,de(the distance from the point to the nearest nucleus external to the surface)and di(the distance to the nearest nucleus internal to the surface),are defined.The proportions of C…H/H…C,O…H/H…O and H…H interactions in complexes 1 and 2 cover 16.3%and 12.2%,27.6%and 32.6%,37.8%and 38.9%of the Hirshfield surfaces,respectively.It is because of the existence of these short-range interactions that the complexes can be more stable.

Fig.10 Two dimensional fingerprint plots of complexes 1 and 2 with the major decomposition plots
2.7 Thermal analyses
Thermal stabilitieswere investigated for complexes 1 and 2.The TG curve of complex 1 was divided into three stages.The first stage occurred in the 47~91 ℃range with the weight loss of 5.8%,which is similar to the value (5.6%)estimated for the loss of lattice chloroform and methanol molecules of complex 1.This result is consistent with the previous element analysis results.The second stage was from 146 to 229℃with a weight loss of 24.3%,which corresponds to the loss of the three coordinated methanol molecules and two μ-acetate ions(Calcd.24.6%).Finally,the third weight loss starts at around 300℃,leading to further decomposition of complex 1.At about 680℃,the TG curve showed an approximately 50.2%total weight loss,indicating the complete removal of the L4-unit.The main residual product was NiO,with a value of 19.7% (Calcd.20.1%).Similar to complex 1,the first stage of TG curve for complex 2 occurred in the 56~135℃ range with the weight loss of 5.6%,which is similar to the value(5.9%)estimated for the loss of the lattice methanol molecules of complex 2.And the main residual products of complex 2 was ZnO,with a value of 22.7%(Calcd.22.5%).
3 Conclusions
Two new homo-trinuclear Ni(Ⅱ) and Zn(Ⅱ) complexes,[Ni3(L)(μ-OAc)2(CH3OH)3]·CH3OH·0.25CHCl3(1)and[Zn3(L)(μ-OAc)2(CH3OH)(H2O)]·2CH3OH(2)with a flexible bis(salamo)-like ligand H4L have been prepared and structurally characterized.Complexes 1 and 2 were fully characterized by elemental analyses,FT-IR,UV-visible spectra,single crystal X-ray crystallography,Hirshfeld surfaces analyses,and their luminescence properties were also discussed.Infinite 3D supramolecular architectures of complexes 1 and 2 were formed by hydrogen bonding and C-H…π interactions.Most importantly,the fluorescent property of complex 1 is totally different from that of complex 2.Compared with the ligand H4L,the emission intensity of complex 2 increased by more than 40 times while complex 1 have a quality of fluorescent quenching.
Acknowledgements:This work was supported by the National Natural Science Foundation of China (Grant No.21761018)and the Program for Excellent Team of Scientific Research in Lanzhou Jiaotong University (Grant No.201706),which are gratefully acknowledged.
