Expression of genes that control core fucosylation in hepatocellular carcinoma: Systematic review
2019-07-10PamelaNortonAnandMehta
Pamela A Norton, Anand S Mehta
Abstract BACKGROUND Changes in N-linked glycosylation have been observed in the circulation of individuals with hepatocellular carcinoma. In particular, an elevation in the level of core fucosylation has been observed. However, the mechanisms through which core fucose is increased are not well understood. We hypothesized that a review of the literature and related bioinformatic review regarding six genes known to be involved in the attachment of core fucosylation, the synthesis of the fucosylation substrate guanosine diphosphate (GDP)-fucose, or the transport of the substrate into the Golgi might offer mechanistic insight into the regulation of core fucose levels.AIM To survey the literature to capture the involvement of genes regulating core Nlinked fucosylation in hepatocellular carcinoma METHODS The PubMed biomedical literature database was searched for the association of hepatocellular carcinoma and each of the core fucose-related genes and their protein products. We also queried The Cancer Genome Atlas Liver hepatocellular carcinoma (LIHC) dataset for genetic, epigenetic and gene expression changes for the set of six genes using the tools at cBioportal.RESULTS A total of 27 citations involving one or more of the core fucosylation-related genes (FPGT, FUK, FUT8, GMDS, SLC35C1, TSTA3) and hepatocellular carcinoma were identified. The same set of gene symbols was used to query the 371 patients with liver cancer in the LIHC dataset to identify the frequency of mRNA over or under expression, as well as non-synonymous mutations, copy number variation and methylation level. Although all six genes trended to more Published online: June 21, 2019 P-Reviewer: Jin C, Li W, Wang L,Zhang WC S-Editor: Yan JP L-Editor: A E-Editor: Ma YJ samples displaying over expression relative to under-expression, it was noted that a number of tumor samples had undergone amplification of the genes of the de novo synthesis pathway, GMDS (27 samples) and TSTA3 (78 samples). In contrast, the other four genes had undergone amplification in 2 or fewer samples.CONCLUSION Amplification of genes involved in the de novo pathway for generation of GDPfucose, GMDS and TSTA3, likely contributes to the elevated core fucose observed in hepatocellular carcinoma.
Key words: Liver cancer; N-linked glycosylation; Fucose; Guanosine diphosphate fucose;Hepatocellular carcinoma
INTRODUCTION
Changes in N-linked glycosylation of liver-derived serum proteins have been associated with the development of hepatocellular carcinoma (HCC)[1-7]. Of particular note, an increase in alpha1,6-linked core fucose modified serum proteins, both in total as well as on individual proteins has been reported in some patients with HCC by us and others[6,8-12]. However, there is considerable variation, with not all individuals showing the same magnitude of glycosylation change. An understanding of the sources of variability in core fucosylation might allow the use of such changes as potential biomarkers for early, non-invasive detection of HCC.
In humans and other mammals, there is only a single alpha-(1,6)-fucosyltransferase(also called alpha1-6 FucT); that enzyme attaches fucose via 1,6 linkage to the innermost core N-acetylglucosamine[5,13,14]. This enzyme is the product of the FUT8 gene. Increases in FUT8 gene expression have been associated with HCC and liver steatosis[15-17]. Loss of the FUT8 gene in mice is associated with reduced tumor formation along with impaired liver regeneration[18]. However, core fucose levels can also be affected by the level of the guanosine diphosphate (GDP)-fucose substrate and/or its transport into the Golgi[5,13,19,20].
GDP-fucose is generated from L-fucose by two distinct pathways (Figure 1), de novo synthesis and salvage[5,13]. In de novo synthesis, GDP-mannose is converted to GDP-4-keto-6-deoxymannose by the enzyme GDP-mannose 4,6 dehydratase (GMDS). This intermediate is converted to GDP-fucose by the bifunctional GDP-L-fucose synthetase 1 (FX)[21], encoded by the TSTA3 gene, which performs both final synthetic steps.Alternatively, in the salvage pathway, L-fucose kinase (encoded by the gene FUK)phosphorylates L-fucose, which is then acted upon by fucose-1-phosphate guanylyltransferase (encoded by the gene FPGT) to produce GDP-fucose[5,13,14]. These reactions all occur in the cytoplasm. GDP-fucose enters the Golgi complex, where the FUT8 enzyme resides, via the membrane anchored GDP-fucose transporter 1 (encoded by gene SLC35C1; also called FUCT1). Thus, in principle, alteration of expression of the genes encoding any of these enzymes could affect the level of core fucosylated proteins secreted from HCC cells into the circulation.
In this review, we describe the results of a search of the literature for reports linking any of the above mentioned proteins or genes with HCC. We also investigate possible genetic mechanisms that could produce heterogeneity in the levels of alpha 1,6-linked core fucose in liver-derived serum glycoproteins. The genes associated with core fucosylation were evaluated for changes in copy number, methylation, mutation status and mRNA expression level in the data set generated by the Cancer Genome Atlas project, which included 373 HCC samples. This analysis has revealed several potential mechanisms that could account for increased core fucose in the context of HCC.
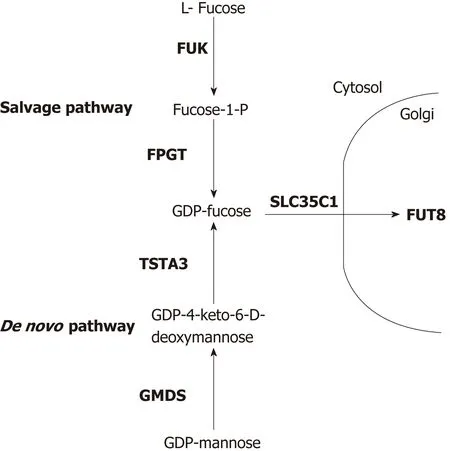
Figure 1 Diagram of the proteins and precursor/product sugars involved with guanosine diphosphate-fucose synthesis, Golgi transport and attachment of core fucose to N-linked glycoproteins. Proteins are designated by the symbols of the genes that encode them (bold). The more dominant de novo synthesis pathway is shown at thebottom, the salvage pathway is at the top. Diagram is based on previous studies[5,13]. GDP: Guanosine diphosphate.
MATERIALS AND METHODS
This systematic review was conducted according to PRISMA guidelines(http://www.prisma-statement.org/). We searched PubMed in January of 2019 for the combination of “hepatocellular carcinoma” along with each individual HUGO gene symbols or protein name (Table 1). We also recorded the number of citations provided for each gene in the Uniprot database on the same date (https://www.uniprot.org/).
The molecular analyses described here use data generated by the TCGA Research Network: http://cancergenome.nih.gov/. The Cancer Genome Atlas Project has produced a large amount of data to detect somatic DNA mutations, DNA copy number variations, DNA methylation alterations and changes in mRNA levels in 20 cancer types[22]. The precise amount of data, in terms of the numbers of patient samples measured as well as the type of data available, including access to other clinical parameters, varies with the specific set of tumor tissues. However, the amount of data provides a rich resource for evaluating genetic changes. The HCC dataset(Liver hepatocellular carcinoma, LIHC) used for the analyses in this report were captured in May, 2016, prior to official publication[23]. At that time, the database included 373 samples with mRNA data (RSEM normalized HiSeqRNASeq V2). These represent samples collected from 371 individual patients. Copy number variation data was based on 370 cases analyzed by Affymetrix SNP6. Methylation data was analyzed using Illumina HumanMethylation450 bead chip. Since this data set was unpublished at the time and designated as Provisional by TCGA, mutation data might not be complete.
Resources used and analyses performed
Identification of genetic and epigenetic changes as well as changes in gene expression was carried out on the LIHC dataset using the tools at the cBioportal website(http://www.cbioportal.org/)[24,25]. The ID symbols for the six genes of interest for core fucose production are FPGT, FUT8, FUK, GMDS, SLC35C1 and TSTA3. These were searched individually and as a set for the presence and types of mutations, or for changes in copy number. The cBioportal Oncoprint tool was used to provide a graphic summary of major genetic alterations and changes in gene expression. Increases or decreases in mRNA level were based on a Z-score threshold of 2.0 or more standard deviations from the mean of the reference population. The reference population was the samples that are scored diploid for each gene.

Table 1 Literature citations to core fucosylation related genes and hepatocellular carcinoma
Correlations between overall mRNA levels in the sample set were analyzed by comparison with gene copy number, either the relative linear copy number (from Affymetrix SNP6) or the GISTIC2.0 (Genomic Identification of Significant Targets in Cancer) algorithm calls[26]. DNA methylation levels were measured with the Illumina Infinium HM450 assay, expressed as beta values (ratio of methylated and unmethylated alleles) and compared with gene expression level. In the event of multiple methylation probes per gene, the most negatively correlated with expression is shown. The cBioportal Co-Expression tool was used to view the genes across the samples with an expression pattern that correlated most positively or negatively with the query gene and to extract the cytogenetic location (cytoband) of all genes.
RESULTS
Literature search strategy and results
Searching the PubMed database for “hepatocellular carcinoma” along with “core fucose” yielded 31 references, and “hepatocellular carcinoma” along with “fucose”produced 153. Searching PubMed revealed only a limited number of citations that included both “hepatocellular carcinoma” and either the gene symbol or protein name for each of the six genes encoding enzymes involved in attaching core fucose (FUT8),generating GDP-fucose (GMDS and TSTA3 via the de novo pathway, FUK and FPGT via the salvage pathway), or the anti-porter involved in transferring that substrate into the Golgi (SLC35C1). For comparison, the UniProt IDs (https://www.uniprot.org/)for each gene product and the number of references listed there also are shown in Table 1. The enzyme commission number is provided, where pertinent.
The combination of “hepatocellular carcinoma” and “FUT8” had the most citations with 16[15,18,27-40], with 17 references found using “fucosyltransferase 8” instead. The two sets were mostly overlapping, but some of the latter referred only to other fucosyltransferases, and thus were omitted, leaving only three additional relevant citations[41-43]. Substituting the TSTA3 gene produced four hits[21,44-46], whereas searching for the gene’s protein product, FX, returned 13 citations. However, the titles or abstracts of the latter revealed that several used “FX” to refer to fucoxanthin, clotting factor X or the radiologic term “Gy/fx”. Eliminating these left only four references to the TSTA3 gene product[19-21,44], two of which were also produced by searching for the gene symbol. Substituting GMDS produced only two citations[19,35,47,48], only one of which was not covered in a previous search. Searching for “hepatocellular carcinoma”and “mannose dehydratase” produced four citations. Searching for SLC35C1 produced a single citation[19]. The gene symbols FPGT and FUK produced no citations when paired with “hepatocellular carcinoma”, nor did the names of the protein products. Thus, removing duplicates that appeared in more than one search, we arrived at a curated set of 27 citations involving one or more of the core fucosylationrelated genes and HCC.
Bioinformatic search and results
As a complement to the literature searches, we were interested in whether genetic changes to these core fucose-related genes occur in liver cancer. Using the cBioPortal interface, the LIHC data set was queried for each of the six genes encoding enzymes involved in attaching core fucose (FUT8), generating GDP-fucose (GMDS, TSTA3,FUK, and FPGT), or the anti-porter involved in transferring that substrate into the Golgi (SLC35C1). None have been causally implicated in cancer, according to the Cancer Census (http://cancer.sanger.ac.uk/census). Using the cBioPortal's Oncoprint tool, genome-based changes in these six genes and their expression levels were compared for 370 patients with liver cancer (Figure 2 and summarized in Table 2).This display provides both the number and nature of the alterations, as well as whether these are co-occurring in the same individual patients, illustrated by examining the vertically aligned segments. None of the total changes, when examine for either single genes or for the panel of six, showed a significant correlation with overall or disease-free survival (not shown). Of particular note, the trend for all genes is toward mRNA increase versus decrease (Figure 2 and Table 2). The behavior of each gene will be considered in the context of the role of its gene product in producing core fucose.
De novo pathway genes
The trend toward increased gene expression in HCC is most striking for GMDS (27 samples) and TSTA3 (78 samples), with both gene products involved in the de novo pathway for fucose synthesis. Neither gene underwent non-synonymous or truncating mutations that would change the encoded protein. However, both genes were scored as amplified in multiple samples: 23 for GMDS and 58 for TSTA3. Only three samples had both amplifications. Closer examination of the GISTIC2 calls indicated a strong bias for both genes to experience copy number gain versus loss(Figure 3). TSTA3 showed low HM450 beta values (all < 0.01), indicating a low level of methylation, which correlated negatively with mRNA levels (Spearman, r = -0.425)In contrast, GMDS showed more variable methylation levels (0.3-1.0), which were negatively correlated with mRNA level (Spearman, r = -0.363).
We queried the LIHC dataset using the cBioportal Co-expression tool to identify genes whose expression pattern across the patient set correlated with that of either GMDS or TSTA3, with the goal of better understanding the basis for the amplifications. The top 10 ranked genes with similar expression patterns are listed in Tables 3 and 4. We see a tendency for the top co-expressed genes to be located near to the GMDS and TSTA3 genomic loci, which lie at chromosomal intervals 6p25 and 8q24.3, respectively. Chromosomal rearrangements resulting in copy number gain are likely occurring in those vicinities.
Salvage pathway genes
FUK and FPGT form the salvage pathway for fucose synthesis, which in general contributes less GDP-fucose than the de novo pathway. The FUK gene was altered in 5% of patients, with two amplifications, mRNA upregulation in 13 and downregulation in 3 (Figure 2, Table 2). No mutations that would affect the encoded protein were detected. There was a trend toward shallow deletion (single copy loss)versus gain (Figure 4). In general, the gene appears to be highly methylated, with almost all beta-values falling between 0.9-1.0. The FPGT gene was altered in 7% of samples, with 15 upregulated and 6 downregulated (Figure 2, Table 2). There were two distinct non-synonymous point mutations, one amplification and one deep deletion. As with FUK, there was a trend toward shallow deletions versus gains(Figure 4). HM450 beta-values were almost all < 0.10, indicating little methylation.
The ten genes whose expression correlated most highly with FUK and FPGT are shown in Tables 5 and 6, respectively. The FUK gene is located at chromosome 16q22.1, and all ten genes also map to 16q, with the majority mapping to 16q22.1. The FUK gene shows 152 samples with shallow deletion/hemizygosity (Figure 4), and only 25 samples exhibiting an increase in copy number, with the majority of 187 being called as diploid. Table 6 shows the ten genes that correlate most highly with FPGT;FPGT maps to chromosome 1p31.1, and the majority of the ten genes map to 1p31.Thus, for both salvage pathway genes, there is a trend toward copy number loss,despite little evidence of mRNA down-regulation.
GDP-fucose transport and transferase genes
The final two genes encode the GDP-fucose transporter SLC35C1 and the fucosyltransferase FUT8. SLC35C1 is altered in 22 cases (6%), with two amplifications,two non-synonymous mutations and 18 samples with mRNA upregulation (Figure 2 and Table 2). Methylation was strongly negatively correlated with mRNA level over a broad range of beta values ranging from 0.1 to 0.9 (Spearman, r = -0.687). This data suggests that differential DNA methylation might play a major role in determining the expression level of the SLC35C1 GDP-fucose transporter protein.
The SLC35C1 gene is located at chr. 11p11. Of the ten genes with expression pattern most similar to SLC35C1 only one, DKFZP779M0652, maps to the same chromosomal interval (Table 7); the rest lie on different chromosomes. This predicted gene is immediately adjacent to SLC35C1 and may encode a lncRNA (ENSG00000205106).Apart from this exception, it seems unlikely that CNV plays a major role in influencing SLC35C1 expression levels. There are approximately an equal number of shallow deletions and presumably single copy gains (Figure 5).

Table 2 Summary of mutational and expression data for core fucose related genes
FUT8, which encodes the enzyme directly responsible for attachment of core fucose, was found to have a low level of genetic alteration, with only 6% of samples exhibiting changes, mostly upregulation of mRNA levels, with a single exome mutation resulting in protein truncation (Figure 2 and Table 2). There were also three instances of apparent amplification and two of deep deletion. There is a trend toward shallow deletion versus low level copy number gain (Figure 5). Almost all samples exhibited low beta-values, with only 12 samples > 0.2 and the rest clustered at about 0.1, suggesting a low level of DNA methylation of FUT8 (Spearman, r = 0.232). FUT8 is at located chromosomal interval 14q23.3; none of the ten genes whose expression pattern correlated most highly with FUT8 localize to chromosome 14 (Table 8).
DISCUSSION
Search of the literature revealed little information about most of the genes involved in core fucosylation in the context of HCC (Table 1). The majority of citations recovered involved FUT8. As described in the Introduction, increased FUT8 gene expression has been observed to be increased in HCC, but not consistently, and it has been difficult to correlate mRNA expression with actual fucosylation changes occurring in tumors. The protein FX, the product of the TSTA3 gene, also has been reported as elevated in HCC, along with the proteins GMDS and FPGT, with less consistent elevation of FUT8[20]. It is thought that increased GDP-fucose substrate availability could also lead to increased core fucosylation. A previous study examined the mRNA expression levels of GMDS, FUK, FPGT, TSTA3 (FX) and SLC35C1 (GDP-Fuc Tr) in a small number of HCC samples[19]. They found a trend toward elevation of SLC35C1 and TSTA3 mRNAs in HCC versus other liver diseases, with considerable sample-tosample variation. However, it was not possible to deduce the molecular basis for the observed expression changes.
Numerous genes have been reported to be altered in genomic analyses of liver cancers[49-51]. We sought to assess whether genome level changes to core fucoseassociated genes might account for the increase of that post-translational modification that has been observed in some HCCs. Amplification of TSTA3 occurred in 58 tumors out of the 370 analyzed (16%). The tendency for amplification and thus overexpression of genes in the 8q24 chromosomal region could be driven by one or more other genes present within or near this interval, which lies at the distal terminus of chromosome 8q. Notably, MYC is present about 15 MB away at 8q24.2. MYC has been repeatedly implicated as amplified in a subset of HCCs[23,50,52,53]. Indeed, the publication describing the comprehensive analysis of the dataset used here noted that 8q exhibited frequent copy number gains[23]. Use of the Oncoprint and Plots tools at cBioPortal revealed high concordance of the GISTIC calls at TSTA3 and MYC, with 95% of the samples with TSTA3 amplification also displaying MYC amplification; 89%of MYC amplified sampled showed TSTA3 amplification. Thus, it seems reasonable to hypothesize that TSTA3 is a passenger gene, affected by known driver oncogene MYC. However, there are many other genes within this fairly large chromosomal interval.
Changes at 6p25 in the vicinity of GMDS have previously been reported in a subset of HCC cases[53,54]. Using the UCSC Genome Browser reveals that the gene FOXC1 is in very close proximity to GMDS. FOXC1 has been linked to multiple cancers, including HCC[55]. Elevated expression of the nearby genes SERPINB1 and SERPINB6 also has been linked with HCC[56]. Using the Oncoprint tool demonstrates that all three genes are elevated in 21 of the 23 samples with amplification of GMDS (data not shown). It is unknown whether GMDS is a simply a passenger in these amplifications, and what the specific driver(s) might be.

Figure 2 Oncoprint display of genetic events and gene expression changes in liver hepatocellular carcinoma samples for the six genes involved in generating core fucose. Alterations for each gene are indicated in each horizontal row, with the order of the genes in the display chosen randomly. Data for each individual patient sample is aligned vertically. Only the 185 affected samples are displayed; the other 188 showed no changes above thresholds. The types of alterations detected are indicated by the key at the bottom. Data was generated as described in the materials and methods.
As to FPGT, there are no reports in the literature associating specific deletions or amplifications at 1p31.1 with HCC (based on searching PubMed for "hcc 1p31.1"), so the significance of the deletions detected at this chromosomal interval remains unclear. Abnormal methylation preceding allele loss at 16q22.1 has been associated with chronic liver disease[57]. A similar phenomenon might explain the high methylation rate at FUK, with subsequent copy number loss in a subset of the HCC samples.
Finally, neither FUT8 or SLC35C1 appear to be associated with copy number variation occurring with any frequency, with fewer than 1% of samples showing alterations, despite the elevation in expression of each gene in a subset of tumors.Changes in gene expression may relate more to transcriptional regulation, perhaps due to changing levels of transcription factors, or to mutations occurring in nonprotein coding regions.
In conclusion, this was not intended as a comprehensive review of the HCC literature, but was narrowly focused on core fucose related genes in HCC. The increase in core fucosylated proteins observed in patient serum samples may be driven most often by amplification of the genes of the de novo GDP-fucose synthesis pathway, especially TSTA3. The data do not allow us to distinguish between a driver versus a passenger gene role, although the latter seems more likely. Alterations to the expression or copy number of the other core-fucose related genes likely account for a smaller subset of patients that exhibit enhanced core fucosylation. It will remain to be seen if these same trends are reflected in the relative levels of these individual proteins; it has been reported that GMDS protein levels are not well correlated with mRNA levels[19]. It is also not clear if there are actually elevated levels of GDP-fucose as a consequence of TSTA3 amplification, although it has been reported previously that elevated levels of the FX protein correlate with an increase in GDP-fucose[20]. In summary, we have identified multiple mechanisms that are likely to influence the extent of core fucosylation of the N-linked glycoproteins found in the blood of individuals with HCC.

Table 3 Genes with expression patterns that correlate positively with the GMDS gene

Table 4 Genes with expression patterns that correlate positively with the TSTA3 gene

Table 5 Genes with expression patterns that correlate positively with the FUK gene

Table 6 Genes with expression patterns that correlate positively with the FPGT gene

Table 7 Genes with expression patterns that correlate positively with the SLC35C1 gene

Table 8 Genes with expression patterns that correlate positively with the FUT8 gene
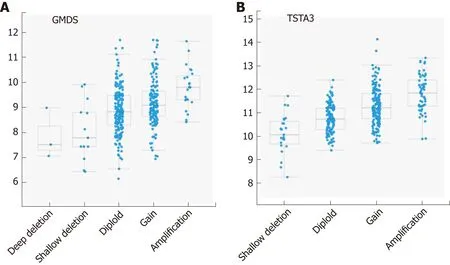
Figure 3 Correlation plots illustrating the relationship between mRNA expression levels for GMDS and TSTA3 on the Y axes (log base 2) and putative copy number changes (GlSTlC2 calls, see materials and methods[26]) on the X axes. Possible GISTIC2 scores are -2 = Deep (homozygous) deletion; -1 = Shallow(hemizygous) deletion; 0 = neutral/diploid; 1 = gain (low copy); 2 = high level amplification.
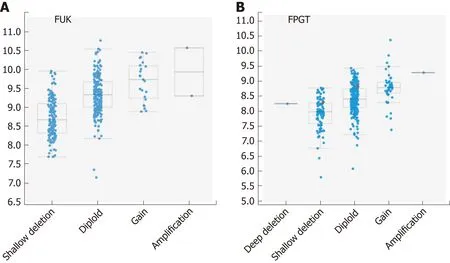
Figure 4 Correlation plots illustrating the relationship between mRNA expression levels for FUK and FPGT. Axes and scoring scale are as for Figure 3.
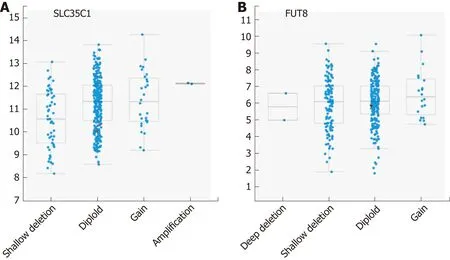
Figure 5 Correlation plots illustrating the relationship between mRNA expression levels for FUT8 and SLC35C1. Axes and scoring scale are as for Figure 3.
ARTICLE HIGHLIGHTS
Research background
One type of protein N-linked glycosylation is the addition of fucose to the innermost core Nacetylglucosamine.Increased frequency of this modification has been associated with a number of cancers, including hepatocellular carcinoma (HCC). Systematically surveying the literature as well as performing a bioinformatics survey provided insight into what has been known about the regulation of the six genes that potentially can influence levels of core fucose.
Research motivation
Knowledge of the mechanisms whereby core fucose addition is regulated may provide information to improve the utility of this protein modification as a biomarker for detection of cancer.
Research objectives
The main objective was to survey the literature for studies that include any of the six core fucose related genes in the context of HCC. The second objective was to identify genomic alterations and gene expression changes for the same six genes in HCC.
Research methods
We searched the PubMed literature database. We performed molecular analyses on the Cancer Genome Atlas Project LIHC HCC dataset, using the tools provided by the cBioportal website(http://www.cbioportal.org/).
Research results
A set of 27 non-redundant citations was generated by searching for “hepatocellular carcinoma”and each of the gene symbols TSTA3, GMDS, SLC35C1 and FUT8 or their gene products. These gene products are involved in synthesis of guanosine diphosphate (GDP)-fucose, its transport into the Golgi or its attachment to N-linked glycans. No citations mentioned genes FPGT or FUK,or their gene products, along with HCC. Analyses of the 373 sample LIHC dataset revealed limited numbers of mutations affecting protein coding regions in all six genes. However, the genes TSTA3 and GMDS that encode the enzymes of the GDP-fucose de novo synthesis pathway appeared to have undergone copy number increase in 16% and 6%, respectively, of the tumor samples. Copy number increase was observed for other genes in the vicinity of those two, which lie at 8q24 and 6p25. The other four genes tended to have increased mRNA levels in a subset of samples, which did not appear to be a consequence of copy number increase.
Research conclusions
The genes that underlie core fucose generation are not well studied in the context of HCC.Multiple molecular mechanisms appear to account for the increase in core fucosylated glycoproteins observed in some patients with HCC, with chromosomal amplification being most common.
Research perspectives
Future studies will be needed to assess whether the results observed with the LIHC dataset will be generalizable to other patient populations.
杂志排行
World Journal of Gastroenterology的其它文章
- Modified FOLFlRlNOX for resected pancreatic cancer: Opportunities and challenges
- Role of cytochrome P450 polymorphisms and functions in development of ulcerative colitis
- Role of epigenetics in transformation of inflammation into colorectal cancer
- Postoperative complications in gastrointestinal surgery: A “hidden”basic quality indicator
- The role of endoscopy in the management of hereditary diffuse gastric cancer syndrome
- Predicting systemic spread in early colorectal cancer: Can we do better?
