Strength Assessment of Damaged Tubular Bracing Members after Impact in Offshore Structure
2019-07-08LIUQingyangZHULingKONGJielingWANGBinCHENMingsheng
LIU Qing-yang,ZHU Ling,2,KONG Jie-ling,WANG Bin,CHEN Ming-sheng
(1.Departments of Naval Architecture,Ocean and Structural Engineering,School of Transportation,Wuhan University of Technology,Wuhan 430063,China;2.Collaborative Innovation Centre for Advanced Ship and Deep-Sea Exploration,Wuhan 430063,China;3.College of Engineering,Design and Physical Sciences,Brunel University,London,UK)
Abstract:Tubes are widely used as brace members in offshore structures.It is of great importance to assess the strength of these brace members after they are damaged by impact loading in case of ship collisions.This paper studies the variation of the ultimate strength for tubular members with different degree of impact damages.Experiments are conducted to explore the impact responses of tubes,and the damages are kept for axial compression tests for further investigation of the ultimate strength after impact.Finite element analysis is performed and the results are compared with the experimental ones.With experimental study and finite element analysis,the relationship of the ultimate strength with lateral deformation caused by impact is given.The comparison with the intact tubes shows that the load carrying capacity of tubes declines significantly when global deformation becomes obvious.
Key words:damaged tubular members;impact response;strength analysis
0 Introduction
Bracing members of offshore platforms are normally constituted with tubes.Collisions with ships often occur during the service of platforms.If the collision results in large damage to the tubular bracing members,it will cause serious environmental problems and huge economical loss.So it is essential to make safety assessment of these tubes.
Some research was conducted by Amdahl[1]to the problem of collision between steel platforms and ships.The energy absorbed by tubes as brace members was studied by De Oliveira[2]in 1982,who took the area of the tube near the impact position into consideration.A classical experimental study was carried out by Jones et al[3]in 1992,in which 130 tubes were impacted by a wedged-shape indenter.Following the work,Jones and Shen[4]tried to use shell theory to calculate the deformation of tubes after impact.In 2010,Jones and Birch[5]summarized the experimental studies in this field and raised a section model to calculate the local and global deformation.In 2018,Zhu et al[6]continued to carry out the experimental study on tubes under lateral impact,a new and convenient way to distinguish the local and global deformation was raised by considering the upper and lower surface of tubes.Based on the impact test results,Zhu et al[7]continued to conduct axial compression tests of the damaged tubes to study the ultimate strength of these tubes.
Some researchers explored the ultimate strength of damaged tubes with dent by assuming a certain dent shape or making damage in a quasi-static way.Smith et al[8]conducted experimental investigations on residential strength of full/small-scale damaged braces in the form of bending or denting.Ellinas[9]considered the effect of denting damage and provided a lower bound prediction of load-carrying capacity of damaged tubes.Taby et al[10]proposed an analytical-numerical model to estimate the ultimate strength of simply supported dented pipes without global bending deformations.Later,an idealised structural unit model was presented to analyse the ultimate strength of damaged tubes in the form of denting and bending[11].Cho et al[12]provided an empirical equation based on beam-column model to predict the ultimate bending capacities of simply supported damaged pipes by considering shell effects.Cerik[13]focused on the ultimate strength of locally damaged steel stiffened cylindrical shells under axial compression by comparing the numerical simulation with the experimental results.
In this paper,both impact and compression experiments are conducted,and the numerical simulation was done to find out how the damage would affect the ultimate strength of tubes.According to the conclusion in this paper,it seems that when local and global deformation takes up a certain ratio of final deformation,the ultimate strength experiences a sharp decrease.
1 Dynamic lateral impact experiments
1.1 The impact experiments
The dynamic lateral impact experiments are first conducted using the drop hammer rig and self-designed clamping system,which is shown in Fig.1.The wedge-shaped indenter in the test is chosen and the range of the impact velocity is from 2-6 m/s.During the dynamic experiments,the impact velocity and acceleration are measured by the photo-electric switch and transient recorder FEN7t from company HBM.The detail of the devices is illustrated in the paper by Zhu et al[14]The dimensions of tubes in the dynamic lateral impact experiments are various.Based on different diameters,the tubes are divided into five groups.Considering the ratio of the real bracing members of the platforms,the results of tubes in group C are chosen to be continued used in the compression tests afterwards.Tubes in group C are 600 mm long whose diameter is 60 mm and thickness is 2 mm.In this test,the deformation of tubes is measured after impact.Both upper and lower surface deformation is focused which can be used to describe the local and global deformation in a quantitative way.The measured results would be displayed in the following section.
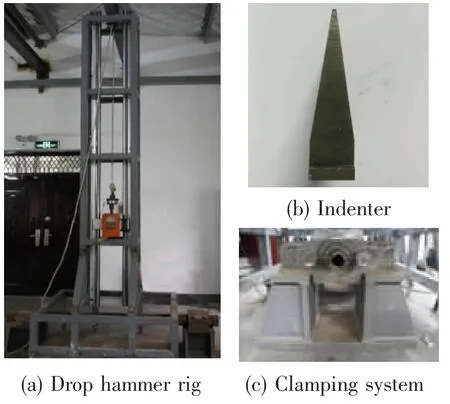
Fig.1 Devices used in the dynamic lateral impact experiments
1.2 Results of the impact experiments
Subjected to lateral impact loads,both local and global deformation would occur to tubes as shown in Fig.2,in which the tubes in group C are impacted by indenter with various impact velocities.In this paper,the damage of tubes are described by using the extent of deformation.Both upper and lower surface deformation at impact position is measured for better illustration of the damage,which is of great importance assessing the strength of tubular brace members.
There are 12 tubes with valid measured results from C1M to C14M,some repeated tests applying the same impact energy are replaced so the number of the tube is not consecutive.The upper and lower surface deformation is shown in Fig.3.Both upper and lower surface deformation is increased with rise of the impact energy.However,the trends are different to the two deformation which is actually affected by the ratio of upper and lower deformation to the final deformation.It means that local and global deformation can be distinguished by using upper and lower surface deformation.
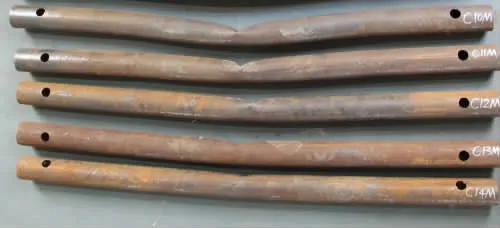
Fig.2 Tubes in group C subjected to lateral impact
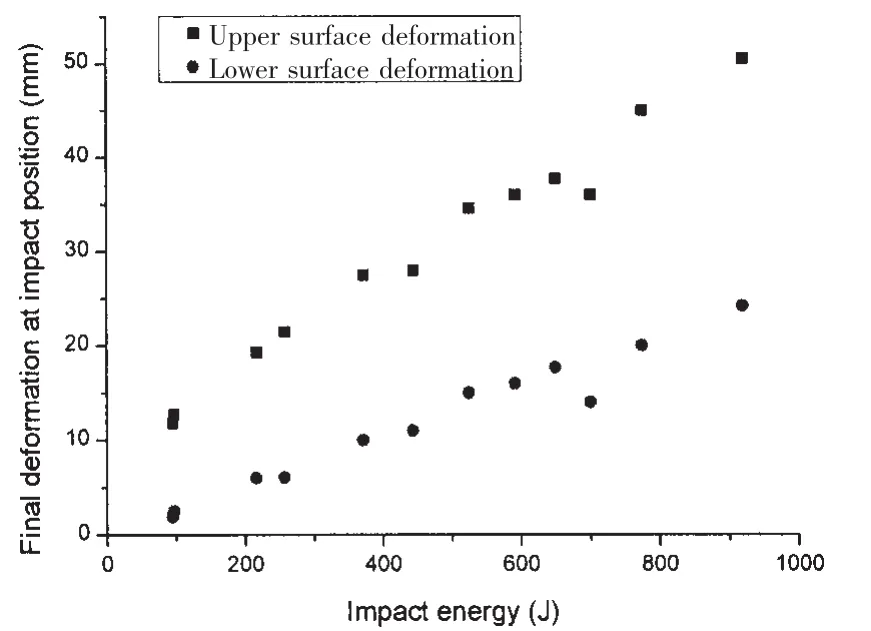
Fig.3 Final local and global deformation of tubes in group C

The global deformation to both upper and lower surface is the same,so the equation can be written as:

And it can be transferred as:

If Wlf/Wuf=1,which means that Wlf=Wuf,the final deformation of the upper surface will be the same with that of the lower surface.The tubes can be seen as a rigid beam in section.The equation could be expressed as Wul=Wll=0.In this case,the local deformation of both upper and lower surface would not be zero,so there is no local deformation to the tube.The rigid beam only rotates around the boundary,as shown in Fig.4(b).However,what should be mentioned is that this case is ideal which may not really occur to the thinwalled tubes.

Fig.4 Assumption of the different deformation modes of tubes
If Wlf/Wuf=0,meaning Wlf=0,there will be no deformation on lower surface.The equation can be expressed as Wul/Wuf=1.In this situation,only local deformation on upper surface occurs while there is no global deformation,as shown in Fig.4(a).
By the above analysis,the value of Wlf/Wufcan reflect the magnitude of local and global deformation.By Wlf/Wuf,the ratio of local and global deformation can be described in a quantity way.The value of Wlf/Wufis closer to 1,global deformation is much larger.The value of Wlf/Wufis more closed to 0,local deformation is much larger.This conclusion will be used in the analysis of the strength of tubes with various deformation to distinguish the effect of local and global deformation to the ultimate strength of tubes.
2 Axial compression experiments
2.1 The compression experiments
Axial compression tests are conducted on 250 kN MTS Model 322 Test Unit machine.The coupling of the tubes with the machine is self-designed to imitate the boundary condition of the tubular bracing members after impact.The connection of the lower end of the coupling with the machine is rivet while the upper end is clamped by the crosshead with machine.The devices used in the compression test are shown in Fig.5.
The Emperor consented, and all happened exactly as it had done at the court of the Emperor with the golden bird; the prisoner s life was to be spared only on condition that within three days he should obtain possession of the golden mermaid24, whom hitherto no mortal had ever approached

Fig.5 Devices used in the compression experiments
The machine is displacement controlled and the moving rate is 0.08 mm·s-1.Load-displacement curves are recorded automatically from which the peak of the load could be found.Meanwhile,strain gage is used to measure the change of strain during the compression.The strain record starts almost the same time when the load-displacement curve starts,which would be convenient to show the relationship between the ultimate strength and the strain.In this experiment,strain gage is affixed on the opposite location of dent surface considered to be most sensible during the compression.
2.2 Results of the compression experiments
Tubes subjected to impact are placed on the MTS machine for compression test.Normally,they would deform larger based on the original deformation mode caused by impact,some are selected to be shown in Fig.6.
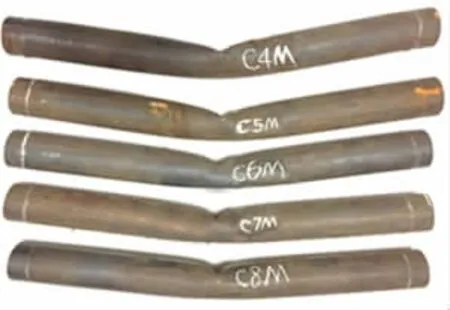
Fig.6 Tubes in group C after compression
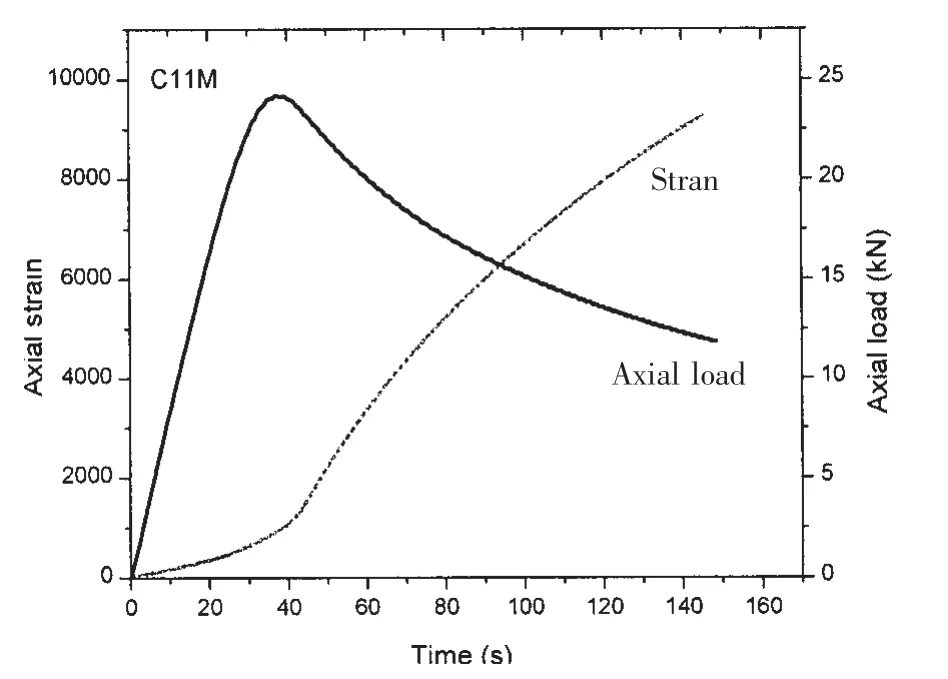
Fig.7 Experimental strain-time and axial load-time curve of C11M
Typical axial strain-time curve and axial loadtime curve are presented in Fig.7,which shows that the flex point of strain curve corresponds to the maximum value of the axial load representing the ultimate strength of the impacted tube.Therefore,the flex point of the strain curve indicates the moment when load-carrying capacity of tubular member is lost.
Five load-displacement curves of tubes selected from C4M to C14M are shown in Fig.8.C8M which has the highest ultimate strength among the five,is the one with the smallest final upper surface deformation.With the increase of the deformation,the ultimate strength falls.And the curve is gradually smoother which may because of the increasing of final upper surface deformation,the deformation mode becomes obvious leading the onwards deformation caused by compression.

Fig.8 Experimental axial load-displacement curve of tubes in group C
3 Numerical study of the strength of tubular bracing
3.1 Description of the finite element model
The impact phase and the compression phase are simulated by using finite element soft-ware ABAQUS 6.14.An explicit solver is suitable for analysing the impact phase in which the initial deformation occurs.The element type of the pipe is S4R shell and the indenter is modelled by using analytical rigid body.The contact is chosen as surface to surface contact while the friction coefficient between the indenter and the pipe is set as 0.15.The material properties are defined according to the result of tensile tests,which are described in detail by Zhu et al[6].
After the impact phase,a standardanalysis code is adapted to simulate the quasi-static compression process.The model of damaged pipe is directly imported as a part in a new finite element file,so that the material and the mesh are kept the same as those in the impact phase.Both ends of models are coupled with reference nodes,one of which is fixed and the other one is applied an axial compressive displacement about 0.02 m referred to the test results.The arc length method is deployed to analyse the ultimate strength of damaged tubes.By using the arc length method,the load would rise step by step until the maximum value is reached.The deformation modes including impact and corresponding compression one are presented in Fig.9.

Fig.9 Finite element mode of tubes after impact and compression
3.2 Comparison between numerical and experimental results
As the illustration in the chapter 2,the experimental axial load-displacement curve could be obtained from the MTS machine.While,with the finite element software,the curve could also be output from the computer.The axial load-displacement curves of C4M gotten from simulation and experiment are shown in Fig.10.
From the Fig.10,the ultimate strength calculated from FEM simulation is closed to that obtained from experiment.The overall tendency has a good agreement.While the stiffness of FEA models is systemically higher than that of experiment,which may be caused by material defects and the imperfect boundary conditions.
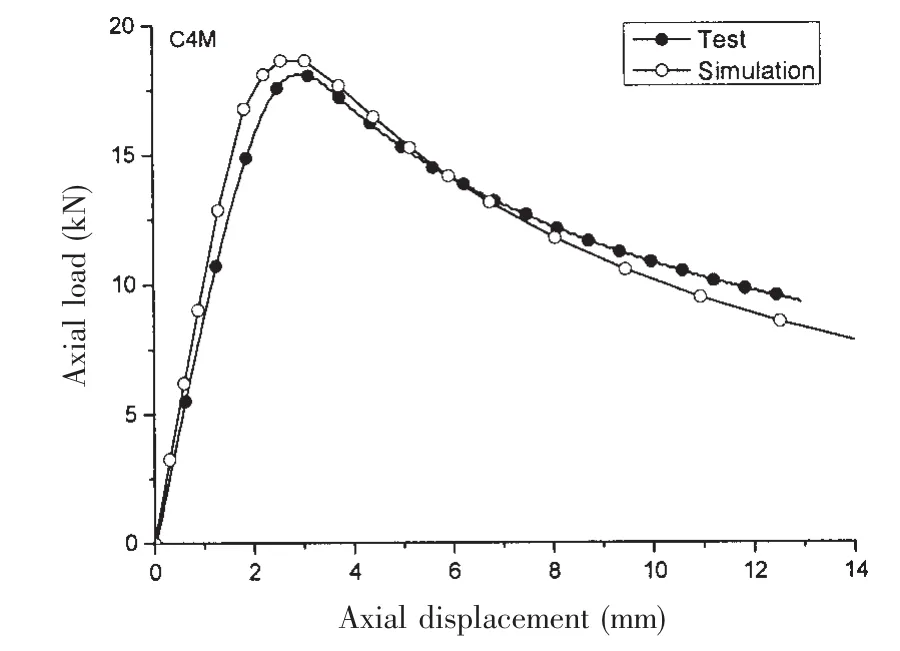
Fig.10 Comparison of experimental and FEM axial load-displacement curves of C4M
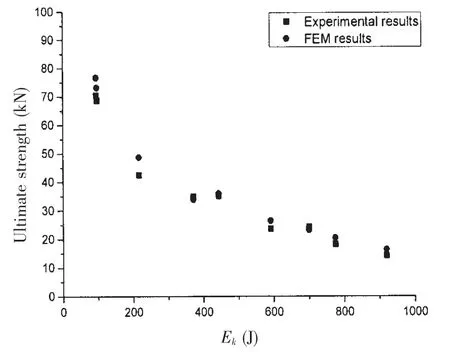
Fig.11 Comparison between experimental and FEM results of ultimate strength of tubes in group C
The focus of this paper is on ultimate strength,so comparison was made to find out whether the ultimate strength of the finite model is proper.The comparison is shown in Fig.11 in which a good agreement between experiments and simulations is achieved.Considering the good agreement of the tendency and the ultimate strength,it is reasonable to use this finite element method to further explore the problem.
3.3 Analysis of the strength of the tubular bracing member
To further investigate the effect of local and global deformation on the load-carrying capacity of damaged tubular bracing members,the numerical simulations of fullscale tubular members are conducted.The finite element mode is shown in Fig.12.
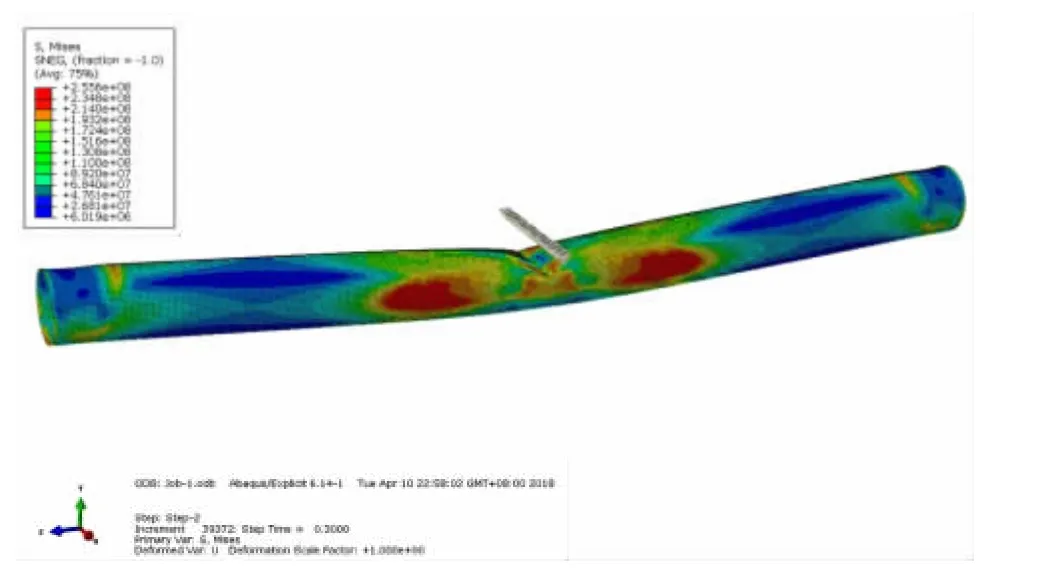
Fig.12 Full scaled finite element mode
Normally,in ocean engineering,the brace length is 20 m,the outside diameter is 1.5 m and the wall thicknesses varies from 30 mm to 50 mm[15].The material is assumed to be elastic,perfectly plastic and the yield strength is 285 MPa which is widely used in bracing members of platform structures.The tubes are perpendicularly impacted by 60 degree wedge-shaped indenter with 10 mm radius head.Different impact velocities from 0.1 m/s to 2 m/s and various impact masses from 1 000 t to 2 000 t are deployed to the indenter,which are common values for supply vessels that may have collision with the platforms,summarized from different rules and regulations from various classification societies[16].The FEM analysis is the same as before consisted with the impact process and compression process.
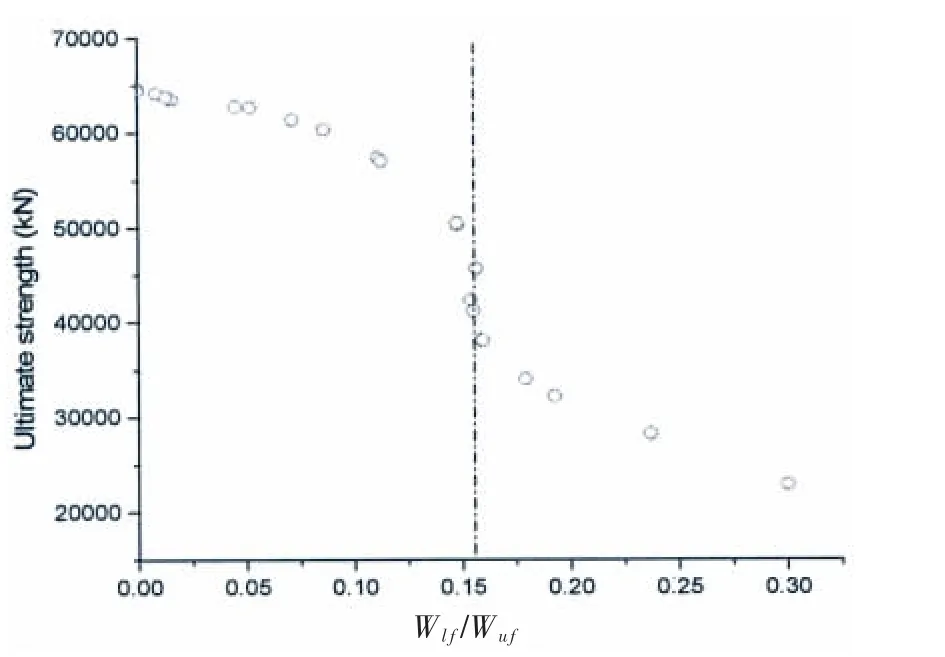
Fig.13 The relationship between ultimate strength and the ratio of upper and lower surface deformation
To investigate the effect of deformation modes to the ultimate strength of the damaged tubes,the upper and lower deformation at the centre of each model is exported.From the previous analysis,the ratio Wlf/Wufcould reflect the magnitude of local and global deformation.The ultimate strength-Wlf/Wufscatter is shown in Fig.13.
From Fig.13 the real scaled tubular brace shows a slight but steady decrease when the deformation grows.When the ratio Wlf/Wufbecomes larger,the ultimate strength of the brace experiences a sharp decline.The value of the ratio is about 0.15 which represents that the local effect dominates the deformation mode while the global deformation starts to become obvious.So the ultimate strength of the full scaled tubular brace would not be influenced much when the only small local deformation occurs.However,it would drop significantly when global deformation generates and starts to become obvious although it is much smaller than local deformation.
4 Conclusions
Based on the research in this paper,there are three main conclusions obtained from experimental and numerical studies.
(1)The ratio of final upper and lower surface deformation Wlf/Wufrepresents the extent of global and local deformation occupying the final deformation quantitatively.
(2)The ultimate strength is reached when the strain curve at the impact position reaches the flex point.And using FEM method,the ultimate strength can be estimated validly by applying the impact and compression analysis steps.
(3)The ultimate strength to various damaged tubes is different because of different extent of the deformation.It shows that the ultimate strength of the full scaled tubular brace experiences a shock drop when Wlf/Wufis about 0.15,which means that the ultimate strength would decrease sharply when global deformation generates although it is still much smaller than the local deformation.
杂志排行
船舶力学的其它文章
- Numerical and Experimental Studies of the Acoustic Scattering from an Externally Ring-Stiffened Cylindrical Shell
- Experimental Investigation on Dynamic Behavior of Porous Material Sandwich Plates for Lightweight Ship
- Research on the Design and Parameter Influence Law of A High-Static-Low-Dynamic Stiffness Vibration Isolator Using for Marine Equipment
- A New Scheme for Vortex Sheet Diffusion in Fast Vortex Methods
- LQR Control of a Three Dimensional Underwater Glider
- Research on the Mechanism and Characteristic of Added Resistance of Moonpool with Recess
