Online condition diagnosis for a two-stage gearbox machinery of an aerospace utilization system using an ensemble multi-fault features indexing approach
2019-06-03MinZHOUKeWANGYngWANGKijiLUOHongyongFULingSI
Min ZHOU ,Ke WANG ,Yng WANG ,Kiji LUO ,Hongyong FU ,Ling SI ,*
a CAS Key Lab of Space Utilization,Technology and Engineering Center for Space Utilization,Chinese Academy of Sciences(CAS),Beijing 100094,China
b University of Chinese Academy of Sciences,Beijing 100049,China
KEYWORDS Aerospace utilization system;Condition diagnosis;Fault feature index;Gearbox machinery;Health monitoring;Vibration
Abstract China manned space station is designed to operate for over ten years.Long-term and sustainable research on space science and technology will be conducted during its operation.The application payloads must meet the‘‘long life and high reliability”mission requirement.Gearbox machinery is one of the essential devices in an aerospace utilization system,failure of which may lead to downtime loss even during some disastrous catastrophes.A fault diagnosis of gearbox has attracted attentions for its significance in preventing catastrophic accidents and guaranteeing sufficient maintenance.A novel fault diagnosis method based on the Ensemble Multi-Fault Features Indexing(EMFFI)approach is proposed for the condition monitoring of gearboxes.Different from traditional methods of signal analysis in the one-dimensional space,this study employs a supervised learning method to determine the faults of a gearbox in a two-dimensional space using the classification model established by training the features extracted automatically from diagnostic vibration signals captured.The proposed method mainly includes the following steps.First,the vibration signals are transformed into a bi-spectrum contour map utilizing bi-spectrum technology,which provides a basis for the following image-based feature extraction.Then,Speeded-Up Robustness Feature(SURF)is applied to automatically extract the image feature points of the bi-spectrum contour map using a multi-fault features indexing theory,and the feature dimension is reduced by Linear Discriminant Analysis(LDA).Finally,Random Forest(RF)is introduced to identify the fault types of the gearbox.The test results verify that the proposed method based on the multifault features indexing approach achieves the target of high diagnostic accuracy and can serve as a highly effective technique to discover faults in a gearbox machinery such as a two-stage one.
1.Introduction
In aerospace engineering applications,some researchers proposed advanced inspection techniques applied in aerospace structures,such as the novel impact monitoring and identification techniques1,2applied in composite structures and the structural health state based on innovative damage identification methods.3-6However,as for an aerospace utilization system,the health condition of machineries is much crucial for the aerospace utilization system to operate stably and reliably in its lifetime.China manned space station will operate for over ten years.Long-term and sustained space science and application researches will be conducted during its operation.The application payloads must meet the‘‘long life and low cost”mission requirement.Therefore,it is of utmost significance to study the reliability of space application systems.7Gearboxes are much critical machineries in an aerospace utilization system to operate in long lifetime.An unexpected failure of a gearbox may cause the sudden breakdown of the whole machinery equipment;moreover,it may bring enormous financial losses or even personnel casualties.8,9Therefore, the condition monitoring and fault diagnosis for gearbox machineries are much significant for the safety in large-scale industrial applications,10,11especially the reliability in key aerospace utilization systems.
The condition of gearboxes can be reflected by measurements of vibratory11-13,acoustic,13,14thermal,15electrical,16and oilbased signals.17Vibration signals are extremely sensitive to the existence of a gearbox,and a fault diagnosis based on vibration signals is one of the most widely used methods.Generally,gearboxes are operated in harsh environments with severe noises and interferences.18-21The signal analysis and fault characteristic parameters are rather complicated in the fault diagnosis of the gearbox.Generally,the field staffs do not have enough professional knowledge to recognize the spectrum of the vibration signal and do not understand the principle of time-frequency domain analysis.It is difficult to diagnose the fault of the gearbox effectively.Currently,fault diagnosis methods based on multiple disciplines have become the leading direction of development in the field of fault diagnosis.For instance,a defined genetic algorithm combined with Support Vector Machine(SVM)is proposed by Fei and Zhang19to implement the fault diagnosis.An ant colony algorithm(bionics)is employed by Zhang et al.20to realize fault diagnosis for rotating machinery.However,few studies have been reported to realize fault diagnosis for rotating machinery employing calculation methods in the field of image processing.Essentially,fault diagnosis for rotating machinery is a process of fault mode recognition,which is extremely similar to the process of image recognition.Both fault classification and image recognition belong to the category of pattern recognition.Therefore,it is of high feasibility to introduce the calculation methods in the field of image processing to fault diagnosis for rotating machinery.
In this paper,a novel image processing based multi-fault diagnosis approach - the Ensemble Multi-Fault Features Indexing(EMFFI)approach is proposed to realize the online condition monitoring and diagnosis for a two-stage gearbox machinery with high accuracy and strong robustness.To introduce the computing method of image processing to the field of fault diagnosis,first it is necessary to convert the vibration signal to an image.The higher-order spectrum method is a typical signal processing method22-25;it has been developed rapidly over the past few years and offers outstanding performance in processing non-Gaussian,non-linear,non-minimum phase,and non-stationary signals,colored Gaussian noise,and blind signals.26High-Order Statistics(HOS)have been proved to provide abundant diagnostic information.27-29Bi-spectrum is a subset of higher-order spectrum and is defined in terms of the third-order cumulant. It retains phase information of the signal with a high resistance to noise. Therefore,the bi-spectrum contour map is employed to realize the transformation from vibration signals to images.Owing to the development of the image automatic feature extraction technique in recent decades, the Scale Invariant Feature Transform(SIFT)method18,30,31is recognized as the most appealing descriptor for practical uses and for matching features with good robustness and high accuracy.However,some obvious shortcomings associate with SIFT,such as high resource consumption,high time complexity,and large computational time requirements. To address these disadvantages, researchers have implemented various improvements to SIFT.In 2008,Bay et al.32,33proposed the modified SIFT method,Speeded Up Robust Features(SURF),which provides faster and better performance in the feature point detection and description scheme.SURF is combined with integral images and Haar wavelets with the characteristics of rotation and scale invariance.As a feature extraction algorithm,SURF not only brings an obvious advantage in the area of computational speed,but also performs excellently in repeatability,distinctiveness and robustness equal or close to previous methods.A rotating machinery is susceptible to the interference of working conditions and noises,however the invariance of SURF can extract the fault features of a machinery more stably.Therefore,SURF is employed to extract fault features from the transformed bi-spectrum contour map.The feature information extracted by SURF is described in terms of the 64-dimensional descriptor.To avoid the waste of resources for subsequent calculations, the Linear Discriminant Analysis(LDA)is employed to reduce the dimension of feature points.Naturally, after extracting fault feature vectors using bispectrum and SURF,the classifier is needed to automatically conduct the fault diagnosis.The RF provides excellent performance in pattern recognition.Hence,this paper attempts to utilize the RF classier to construct a diagnosis model for fault recognition.
This paper will verify that the proposed EMFFI approach is a highly integrated,accurate and robust faults diagnosis technique for some key machineries of an aerospace utilization system.The proposed approach includes four functional modules:Signal Data Preprocessing(SDP),bi-spectrum,SURF and Random Forest(RF)module.The diagnostic signals of a gearbox are acquired in the first module.In the second module, the original signals are decomposed by Local Characteristic-scale Decomposition(LCD)and the first three Intrinsic Scale Components(ISCs)with the highest energies are selected,and then the bi-spectrum approach transforms the ISCs into a 2D bi-spectrum image.In the third module,the feature vectors are extracted by SURF from the bispectrum image. In the last module, RF classification is applied for fault recognition with classification model established by training the feature vectors from the third module.In case study,the experimental tests were conducted to validate the performance of the proposed EMFFI approach in fault diagnosis under the working condition of a gearbox from an aerospace utilization system.
2.Method of approach
The proposed EMFFI approach diagnoses the machinery condition based on the fault features index.To monitor and diagnose the machinery condition,four modules in this approach are performed:(A)the original vibration signals from the gearbox machinery are decomposed by LCD and the first three highest-energy ISCs are selected;(B)the bi-spectrum is applied to transform the ISCs to an image;(C)the SURF module extracts the fault feature vectors from bi-spectrum images and the linear combinations of features are found by LDA to reduce the feature number and increase the classification performance;(D)the new feature vectors formed by LDA are finally trained by RF to establish a classification model for fault diagnosis.The framework of EMFFI approach is presented in Fig.1.
2.1.SDP module
To obtain the highly-accurate and highly-robust fault diagnosis for a key machinery of an aerospace utilization system,an SDP module was encompassed in EMFFI approach.In this module,a channel of acquired vibration signal can be decomposed into a sum of ISCs,plus a residual by LCD.ISCs are mutually independent and meet the following two conditions:
(1)In the entire data set,the signal is monotonic between any two adjacent extreme points.

Fig.1 Framework of the proposed EMFFI approach.
(2)Among the whole data set,it was supposed that the number of extrema of the signal x(t)is M,and determine all the extrema(tk,xk).Then any two adjacent maxima or minima,(tk,xk)and(tk+1,xk+1),are connected by a straight line as follows:

In order to assure the smoothness and symmetry of the ISC,the ratio of mirror magnitude Akto xkis constant as

Generally,a is set as 0.5,and thus Ak/xk=-1.At that time,xkand Akare symmetrical for the x-axis,which ensure the symmetry and smoothness of the ISC component waveform.
Based on the definition of the ISC component,a complex signal x(t)(t >0)can be decomposed into a sum of ISCs using the LCD method as follows:
(1)Suppose that the number of extrema of the signal x(t)is M,and the corresponding time of any extremum is tk,which determine all the extrema(tk,xk)(k=1,2,...,M)of the signal x(t).
(2)Compute Ak(k=2,3,...,M-1)according to Eq.(1).Based on the following equation,the corresponding Lk(k=2,3,...,M-1)can be calculated.

Since k is from 2 to M-1,the values of L1and LMshould be calculated by extending the boundary of the data,which can be fulfilled by different methods.
(t0,x0)and(tM+1,xM+1)can be obtained by the extension of two end extrema,and thus the values of L1and LMcan be acquired.
(3)All the Lk(k=1,2,...,M)are connected by the cubic as spline line SL1(t),which is defined as the base line of the LCD.
(4)The difference between the data and the base line SL1(t)is the first component h1(t):

(5)Separate the first ISC1from the initial data x(t):

The residual r1is taken as the original signal to be processed.The above process is repeated until the residual is constant or monotonic function or a function with no more than twenty extrema.
ISC1,ISC2,...,ISCnand the residual are obtained as

where ci(t)is the ith ISC and rn(t)is the residual.
2.2.Bi-spectrum module
Vibration signals of a rotational machinery are a type of complex signals containing non-linear,non-stationary signals with vibration noises,and bi-spectrum transformation has been proven to be an effective tool to process such signals.Therefore,it is applied here to transform the vibration signal to a bi-spectrum contour map(a 2D image).
A higher-order spectrum is defined by a higher-order cumulant.However,for a bi-spectrum,it can be defined by a thirdorder cumulant.For a random signal x(t),the third-order cumulant can be expressed as

By assuming that the third-order cumulant C3x( τ1, τ2)is convergent,the third-order cumulant spectrum is defined as the two-dimensional Fourier transform of the third-order cumulant:

The bi-spectrum of a signal should be estimated under a certain‘‘optimum”standard.In practice,the bi-spectrum can be estimated only according to limited observation data.The estimated method of the bi-spectrum method is the same as the power spectrum estimation method,including the parametric model and non-parametric model.Compared with the indirect method, less computation is required by the direct method.16,17Therefore, the direct estimation method is adopted in this paper.The flow of the algorithm is described as follows:
(1)By assuming that the observation data are of finite length, the sampling frequency is fs. In the bispectrum domain,the number of the points are ω1and ω2, and thus the frequency sampling interval is Δ0=fs/N0.Divide x(t)into K segments,with each segment containing M points(i.e.,N=KM),and then subtract the mean of each sample.
(2)The Discrete Fourier Transform(DFT)is applied for the jth data segment,that is,

(3)According to the coefficient of DFT,calculate the bispectrum estimation of each segment:

(4)According to the result of the bi-spectrum estimationof each segment, calculate the mean ofand then obtain the bi-spectrum estimate of the observation data x (i):

2.3.SURF module
2.3.1.Interest point detection
A Hessian matrix is used to detect interest points by SURF,and the use of an integral image can greatly reduce the amount of calculation.
(1)Integral image
The integral image can greatly increase the efficiency of box-type convolution filters.For a point X,X=(x,y)in the integral image.The value of the point can be described as follows:The sum of all pixel values in a region is formed by the origin point and point X.

Once an image is converted to an integral image,the sum of the gray levels in a rectangular region can be calculated by 3 plus-minus calculations.We can see in the following discussion that the convolution templates used by SURF are all box templates,which can greatly improve the computational efficiency.
(2)Approximate Hessian matrix:Happrox
The interest point detection of SURF is based on the Hessian matrix,which relies on the local maximum of the Hessian matrix determinant.When the Hessian matrix determinant appears to have a local maximum,the detection result is a blob-like structure,that is,a region brighter or darker than the surrounding area.Here,the register refers to the point and its small neighborhood.For a point X= (x,y ),the Hessian matrix is defined as

where Lxx(x,σ ),Lxy(x,σ )and Lyy(x,σ )are second-order partial derivatives and the two-dimensional convolution of point(x,y )of the image I,respectively.
Instead of using a second-order Gaussian filter,a block filter is employed to approximate the two-order partial derivative of the Gaussian function to construct a fast-Hessian matrix.The approximate convolution template is utilized to process the integral image,with obvious benefits.The template is composed of simple rectangles,with computation independent of the size of the template.A 9×9 box filter is shown in Fig.2.In the original image,an image pyramid of a different size is formed by expanding the size of the box filter,and an integral image is applied to speed up the image convolution.Therefore,the approximate Hessian matrix can be obtained as
where Dxx,Dyyand Dxyare the computational results of the box filter and the integral image.The extreme points are determined by the determinant and the eigenvalue of the matrix.If the determinant of the Happromatrix is positive and the two eigenvalues are different,the point is denoted as an extreme point.
According to the fast-Hessian matrix,the extremum of(x ,y,σ) in the scale image can be obtained. First, nonmaximum suppression is carried out in the 3×3×3 stereo neighborhood.Only the biggest of all points smaller than the adjacent 26 points can be selected as the interest point.To locate(sub-pixel location)the candidate feature points,interpolation can be applied in a scale space and image space,and stable feature points and the scale value can be obtained.
2.3.2.Interest point localization
To keep the characteristics of the rotation invariance of the interest point descriptor,the direction of the interest point should be determined first.Next,a Harr wavelet response is constructed in the direction of the x-axis and y-axis,which is centered on an interest point,covering a 6σ radius.And this response is given a different Gaussian weight coefficient;the closer to the feature point it is,the greater the weight coefficient is.The sum of the Harr wavelet response is in the direction of the x-axis and y-axis within 60°to form a local direction vector.Traverse the entire circular area,and the direction of the longest vector is selected as the principal direction of the interest point as shown in Fig.3.
A window region is constructed with the center as a feature point and a side length of 20σ.Then,the window region is divided into 4×4 sub-regions.The 5×5 sampling point is obtained from the sub-region.The wavelet response is sought in the direction of the x-axis and the y-axis of each sampling point,designated as dx and dy,respectively.The Gaussian filter is performed as dx and dy in each sub-region.The filter center is seen as the feature point, and a four-dimensional eigenvectoris formed by summing dx, dy, |dx|, |dy| in each sub-region. The fourdimensional eigenvector makes the four dimensions of the descriptor.Each descriptor consists of 4 dimensions.Thus,the 4×4×4=64 dimensions are obtained,which is the SURF descriptor.
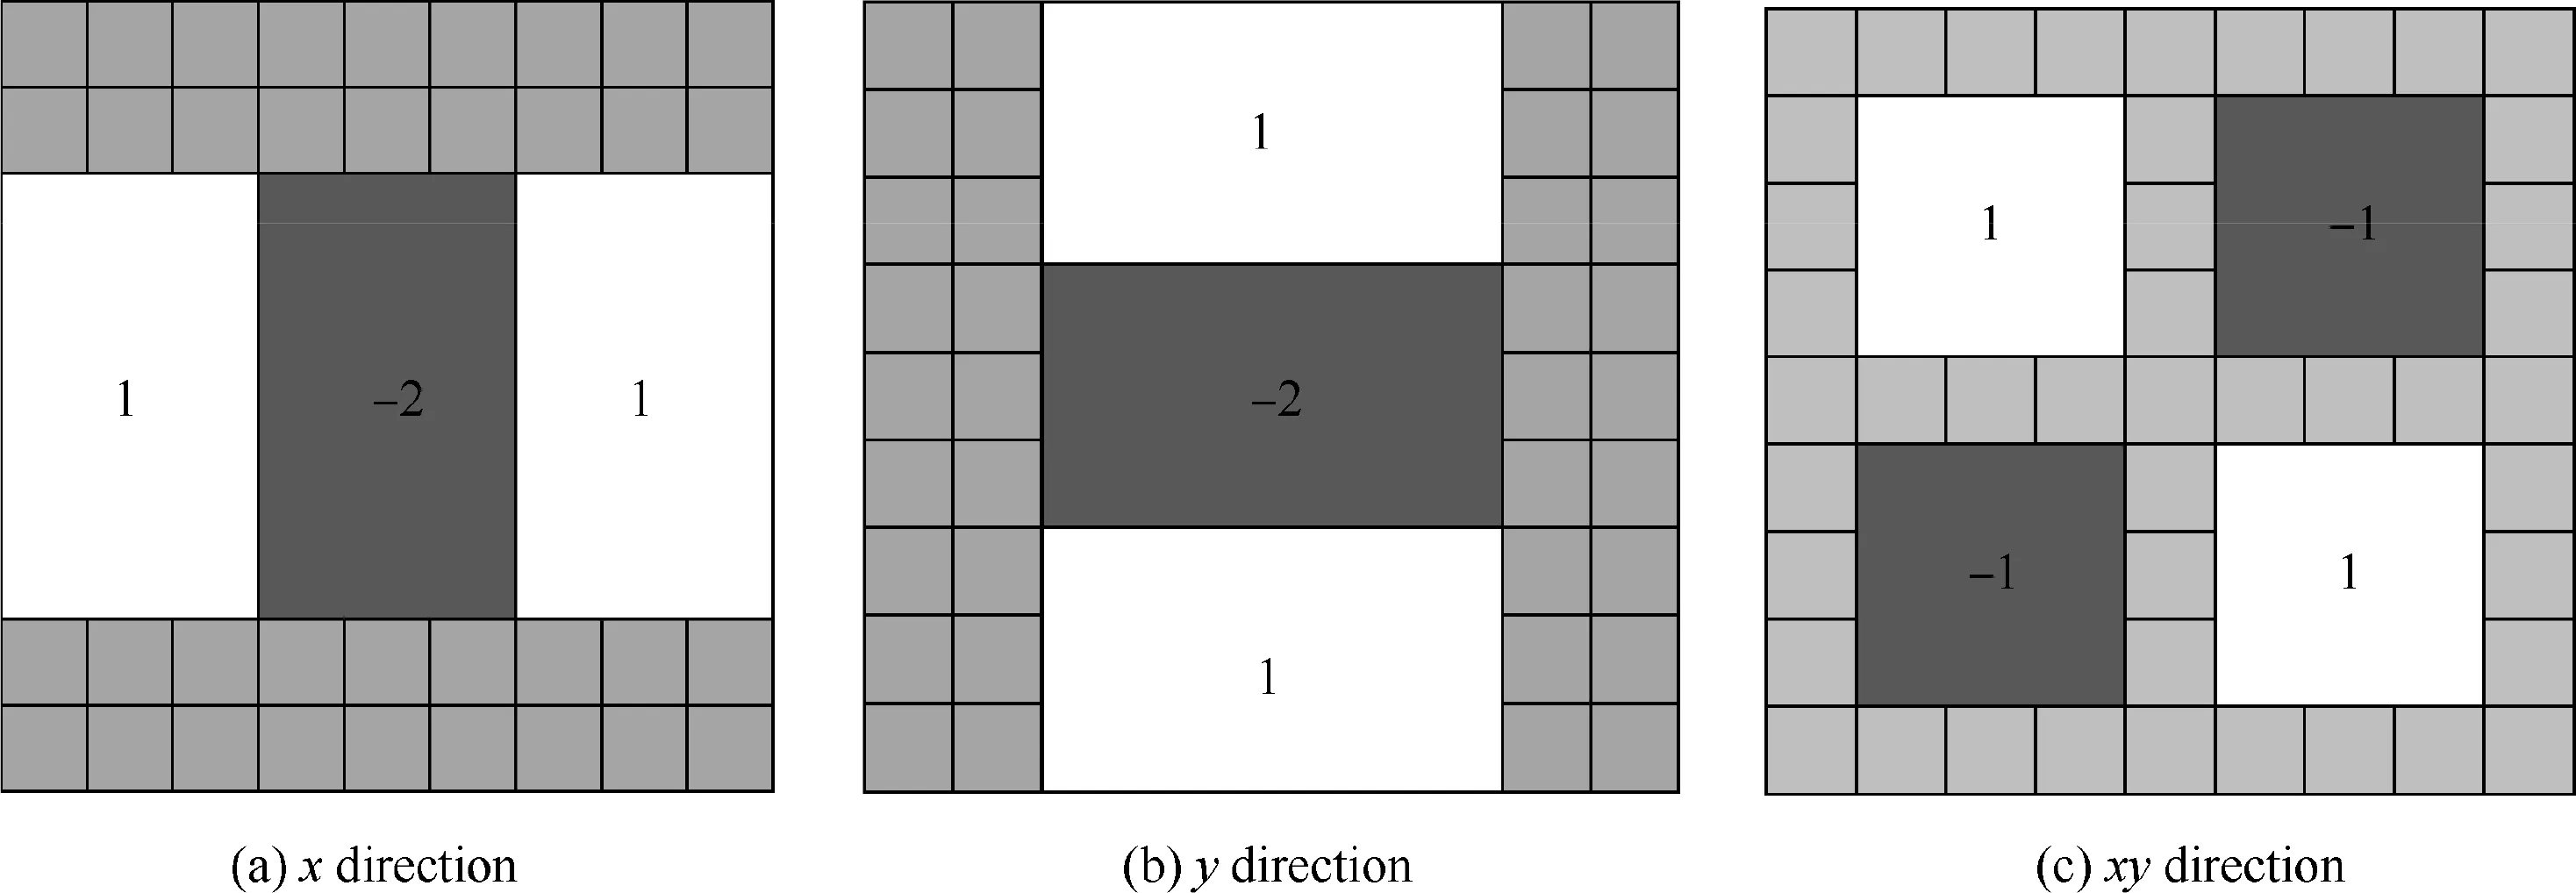
Fig.2 Filter box of x,y,and xy directions.

Fig.3 Determination of the main direction of feature points.
2.4.RF module
An RF is an ensemble classifier consisting of a collection of tree structured classifier{C(Z,θk),k=1,2,...},where θkis defined as the independent identically distributed random vectors and each decision tree casts a unit vote for the most popular class at input Z
A general RF framework is shown as Fig.4 and described as follows:
(1)By employing bootstrap sampling, k samples are selected from training set and the sample size of each selected sample is the same as the training sets.
(2)k decision tree models are built for k samples and k classification results are obtained by these decision tree models.
(3)According to k classification results,the final classification result is decided by voting on each record.RF increases the differences among classification models by building different training sets;therefore,extrapolation forecasting ability of ensemble classification model is enhanced. After k times training, a classification model series{h1(Z),h2(Z),...,hk(Z)}is obtained,which is utilized to structure a multi-classification model system.The final classification result of the system is simple majority voting and the final classification decision is as

where H(Z)is the ensemble classification model,hiis a single decision tree classification model,Y is the objective output,and I is an indicative function.The majority voting process,which is implemented in Eq. (15), decides the final classification.
3.Experimental tests
The experimental data of a two-stage standard cylinder spur gear reducer of an aerospace machinery system were collected by a data acquisition system with the sensor installed on the outer wall of the reducer.The reducer contains an input shaft,idler shaft and an output shaft.The first stage reduction gear ratio is 1.5,and the second stage reduction gear ratio is 1.667.There are 32 and 80 teeth in the input and output shaft,respectively.The two gears on the idler shaft both have 48 teeth.Fig.5 gives a schematic diagram of the gearbox used to collect the data and Fig.6 is a photograph of the twostage reducer.
The data were acquired for 4 s at input shaft speeds of 35 Hz,45 Hz and 50 Hz.The sampling frequency is 66.7 Hz.The gearbox was set in healthy and five fault modes,respectively,as shown in Table 1.Meanwhile,the faults information were collected using a data acquisition system.

Fig.4 Framework to implement RF classification.
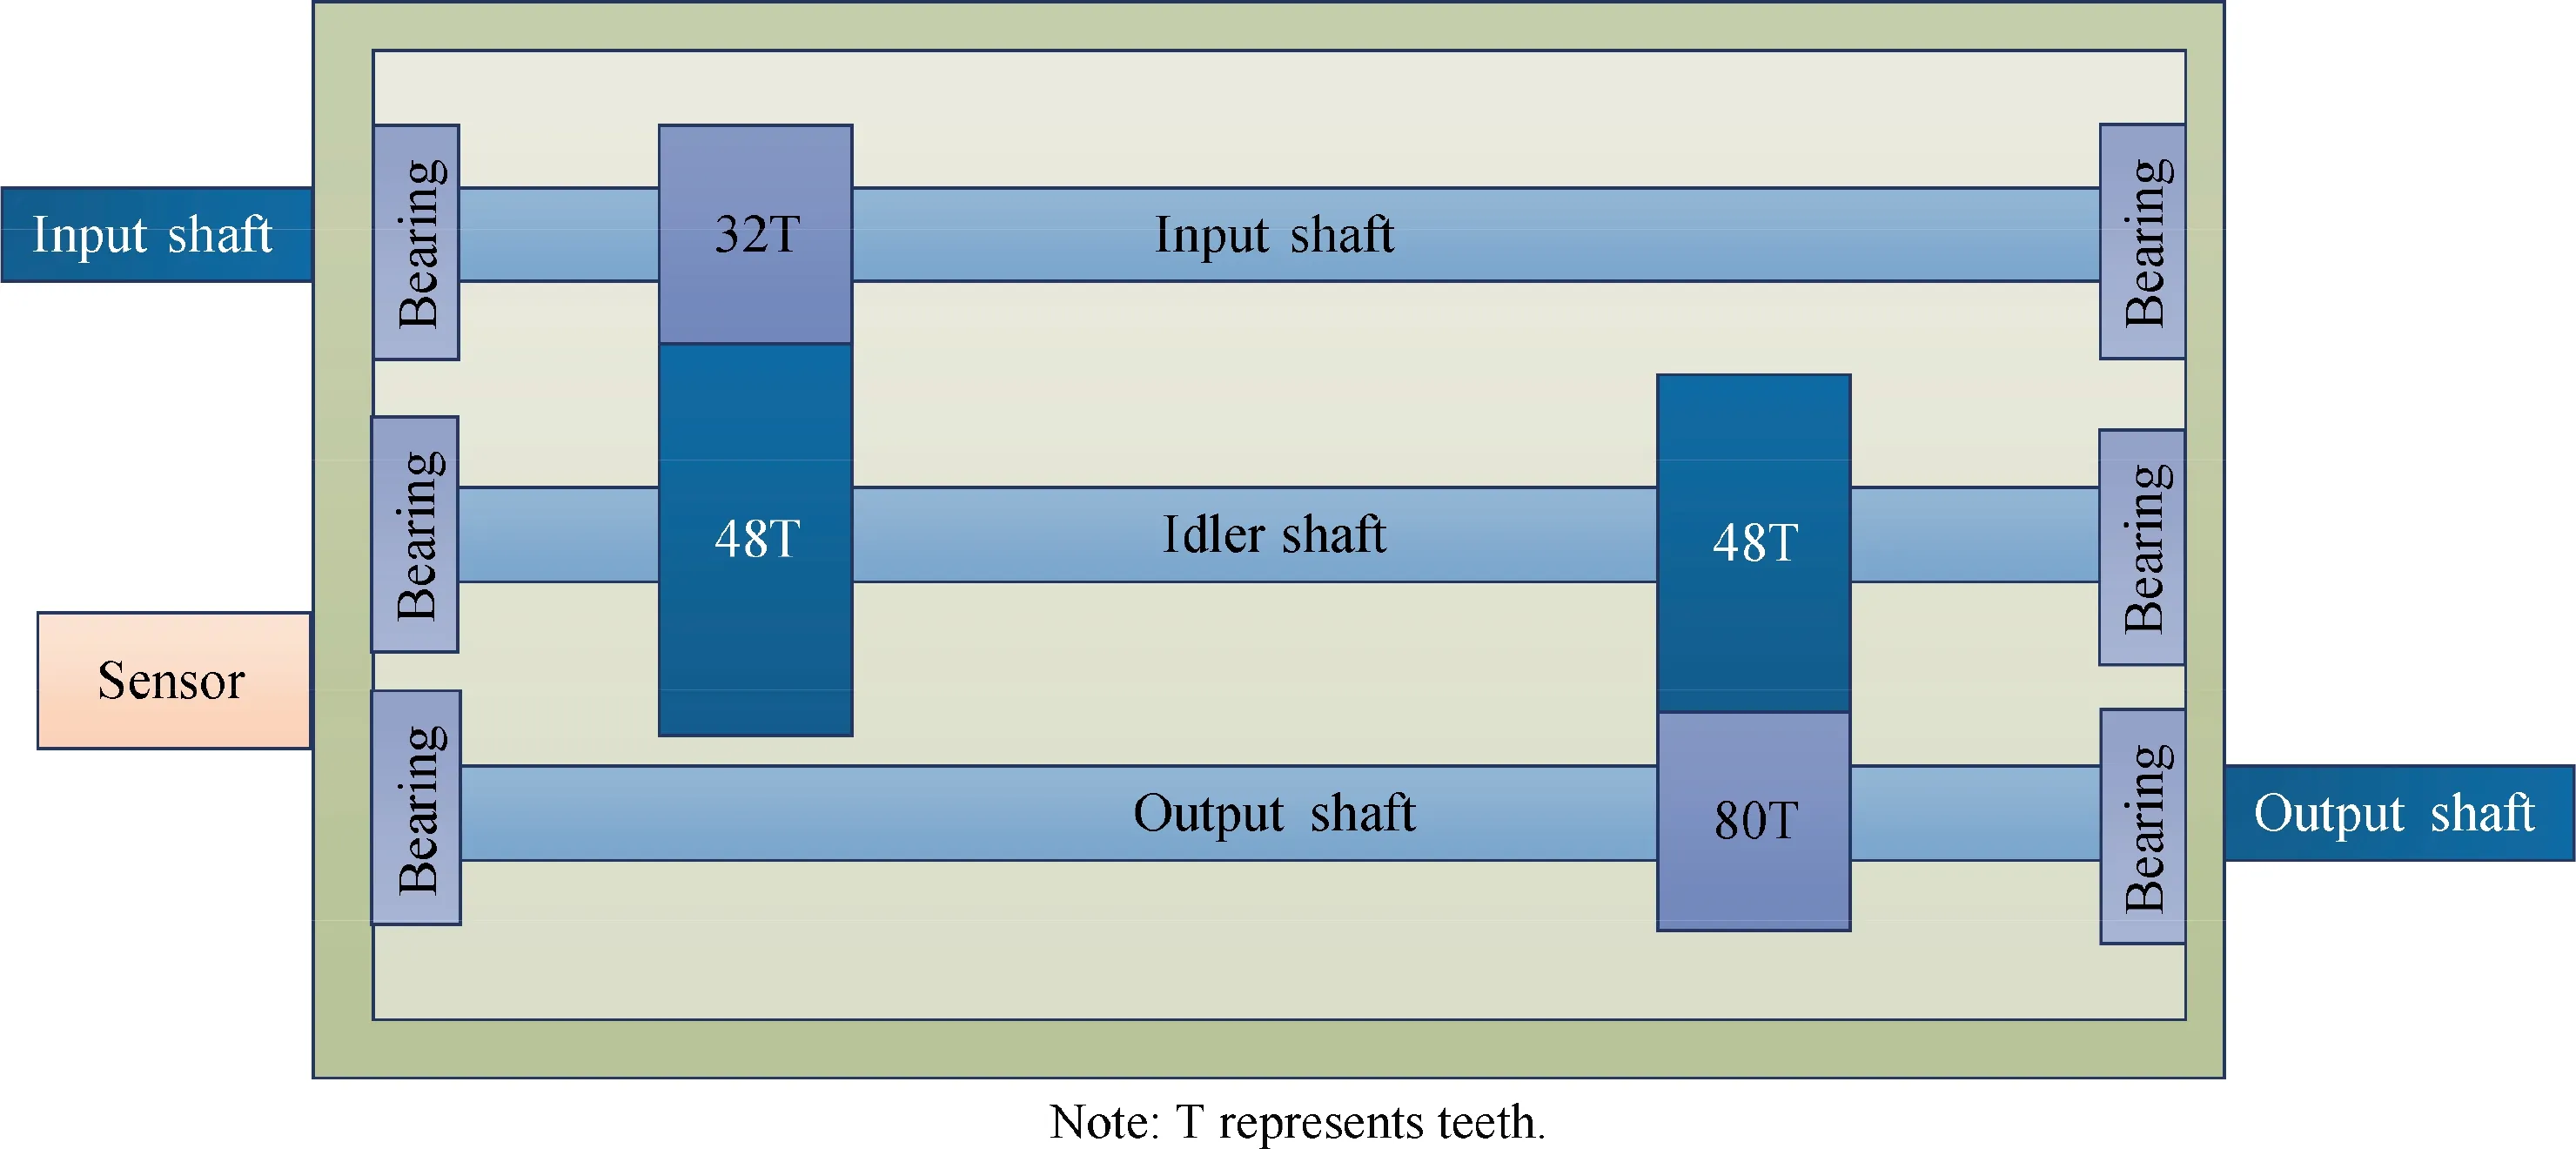
Fig.5 Schematic sectional view of monitored apparatus structure.
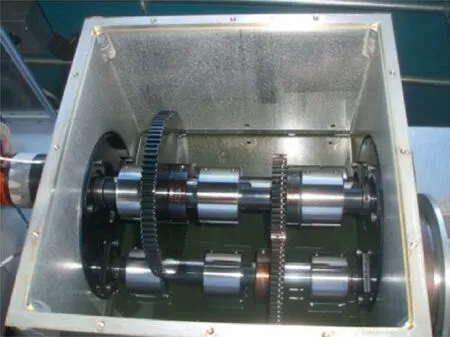
Fig.6 Structural view of monitored two-stage reducer.
Then,bi-spectrum and SURF were used to extract feature vectors of the two-stage gear reducer signal.Considering the influence of environmental noises, wavelet de-noising was performed on the gearbox signal,and then the signal was demodulated by a Hilbert transform to obtain the analytic signal.Then,bi-spectrum of the analytic signal was estimated via the direct(FFT-based)method.
4.Results and discussion
The waveforms of original vibration signals of healthy condition and fault patterns A-E are shown in Fig.7(a),where the data length(i.e.the number of sampling points)is 12000 and different patterns are represented by different colors.Then the original vibration signals generated from the gearbox were decomposed by LCD method.In this case,each channel of signal was decomposed into the seven ISCs.The analysis found that the energy values of the first three components were higher.Therefore,to perform the later bi-spectrum analysis,the first three ISCs were selected and combined into an effective analytical signal.The waveforms of effective analytical signals of healthy condition and different fault patterns are shown in Fig.7(b).
Then,bi-spectrum transformation and SURF were subsequently used to extract feature vectors from the analytical signals preprocessed with LCD.Bi-spectrum contour maps of different fault modes obtained by bi-spectrum transformation are shown in Fig.8.In Fig.8,different fault modes display significantly different frequency distributions.The SURF operator was proven to be effective in extracting stable and invariant feature points in bi-spectrum contour map.The fact that bispectrum contour maps of the same faults present similar patterns while bi-spectrum contour maps of different faults have significantly different patterns not only verifies the effectiveness of the feature extraction method but supports the classification in the next module.
In this study,160 sets of feature vectors were collected.80 sets were selected randomly for training the RF classifier(i.e.classification model).The other 80 sets were test data for RF classifier.As to the specifications of RF classification,thenumber of trees in the forest and the number of variables randomly sampled as candidates at each split are set to be 100 and 4,respectively.The accuracy rate is defined as the odds ratio of the correct results and the total results.The fault diagnostic results are given in Table 2.SURF extracted 64×64 feature points,which were then reduced to 20×20 feature points by LDA to accelerate the computation.

Table 1 Fault pattern of gearbox.
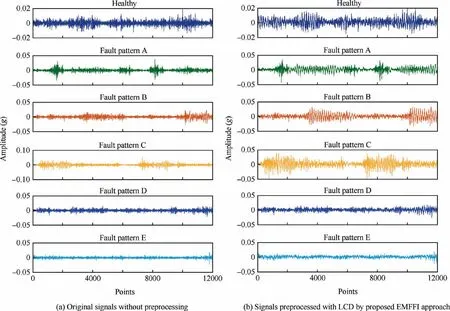
Fig.7 Comparison of vibration signals from gearbox.
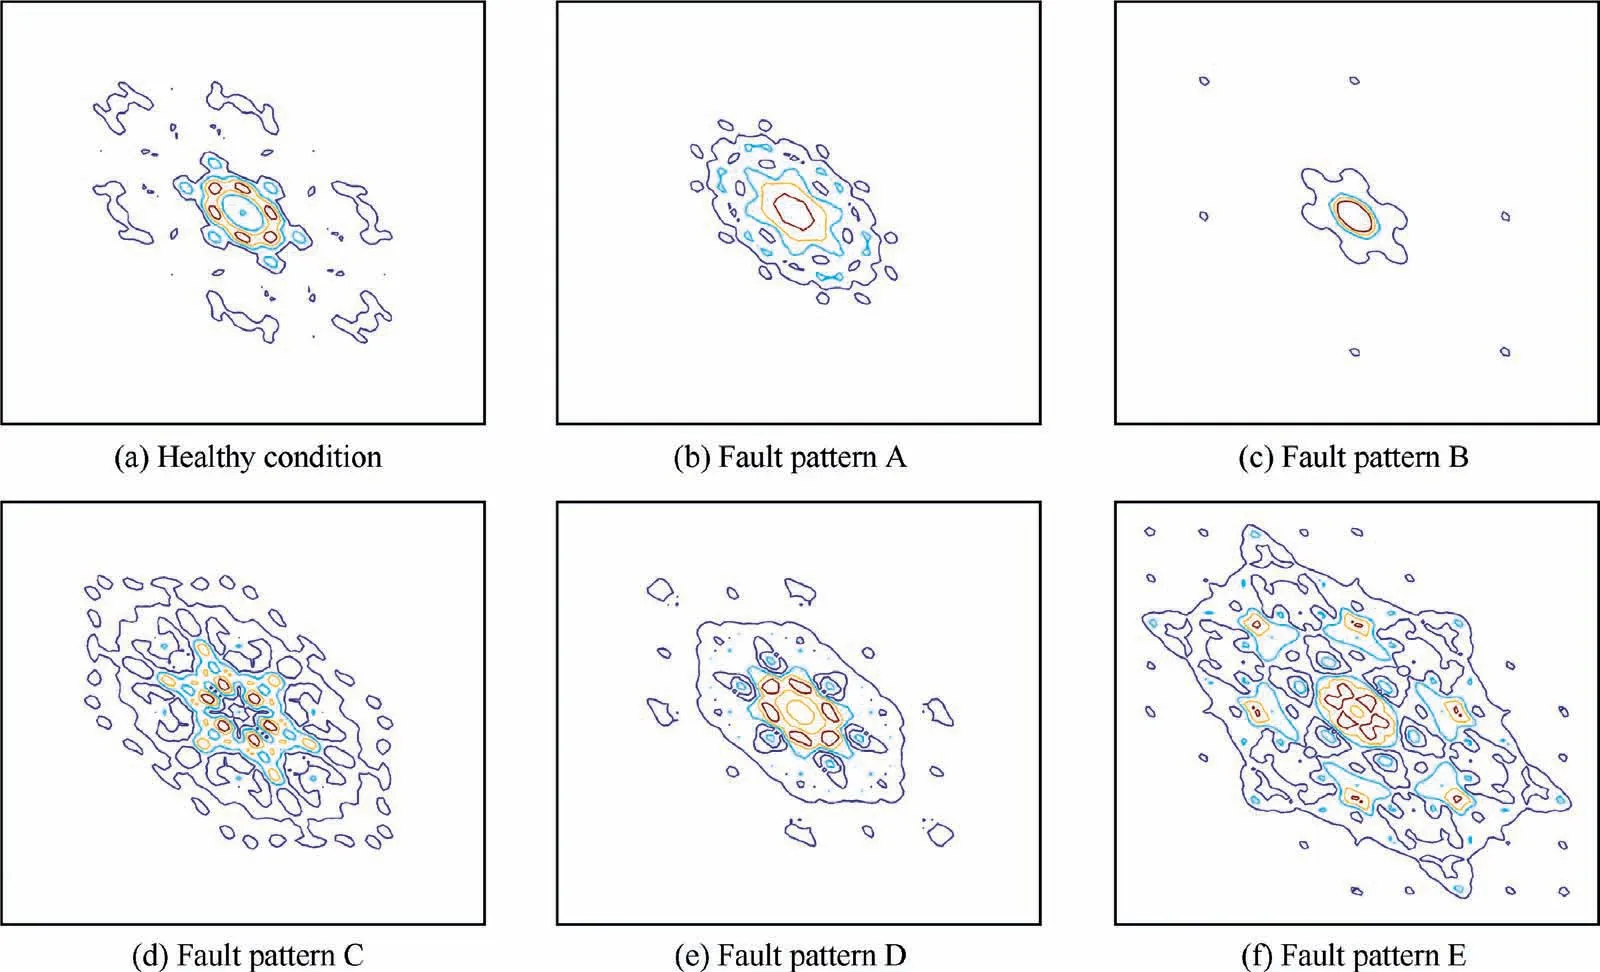
Fig.8 Bi-spectrum contour maps by SDP processing of proposed EMFFI approach.
From Table 2,we can see that the classification accuracy of healthy condition and fault patterns A-E are 97.5%,98.75%,95%,100%,97.5%,and 96.25%,respectively.Fault patternC has the highest accuracy(100%)over five fault modes.It can be completely recognized using the propose method.The total accuracy is 97.5%,demonstrating that the proposed method is effective for the gearbox fault pattern identification.
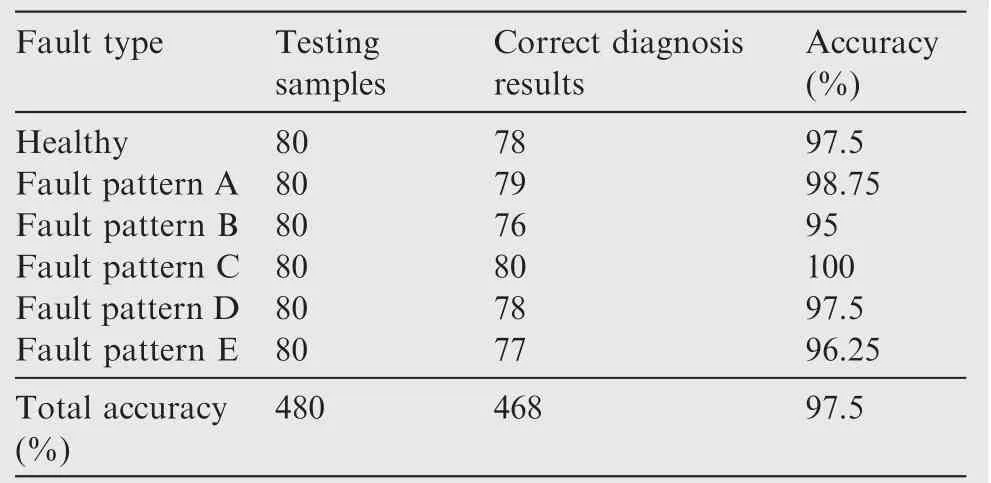
Table 2 Fault diagnosis result.
As a comparison,the original signals were transformed by bi-spectrum without LCD.The bi-spectrum contour maps of different fault modes are shown in Fig.9.
SURF descriptor was applied to extract feature points of different faults and LDA was used for the dimension reduction.The results of fault diagnosis using classification with and without LCD applied to purify original signals are shown in Table 3.From the comparison,the overall accuracy descends from 97.50%(with LCD)to 95.42%if LCD is not applied.
Then,the proposed method was compared with traditional diagnostic methods,where the feature vectors were extracted by a combination of Empirical Mode Decomposition and Singular Value Decomposition(EMD-SVD)and a combination of Empirical Mode Decomposition and Approximate Entropy(EMD-ApEn).The diagnostic results of EMD-SVD method for different fault patterns are given in column 3 of Table 4,and the accuracy of healthy condition and fault patterns A-Eare 87.50%,86.25%,90.00%,88.75%,87.50%and 90.00%,respectively,and the total accuracy is 88.33%.The diagnostic results of EMD-ApEn are shown in column 4 of Table 4,and the accuracy of fault patterns A-E are 92.50%, 91.25%,91.25%,90.00%,88.75%and 87.50%,respectively,and the total accuracy is 90.21%.It is found from the comparison that different feature extraction methods yield different diagnostic results for the same fault mode.The presented method provides the highest diagnostic accuracy,and EMD-ApEn performs slightly better than EMD-SVD method.The overall comparison among the presented methods with and without LCD and other methods:EMD-SVD and EMD-ApEn is presented in Fig.10.The presented methods are the most effective in identifying the fault patterns of gearbox.To obtain the significant analysis signal data,the original vibration signals need to be preprocessed or called de-noised.Thereby,the LCD method is employed to decompose the signals,and then the decomposed signal components are selected with the highest energies as the effective analysis signals.Subsequently,based on the purified and denoised signal data,the bi-spectrum contour map can be formed with more informative and highlighted,so that the training and test data are well prepared and finally the classification accuracy is enhanced.Even without the step of LCD,the classification using the model established by training the feature vectors extracted using a combination of bi-spectrum transform and SURF brings higher fault recognition accuracy than traditional methods.This still attributes to the unique bi-spectrum maps and enlarged differences of feature vectors of different faults.Therefore,the concurrent use of LCD,bi-spectrum transform and SURF can increase the classification performance significantly and discover fault patterns accurately.
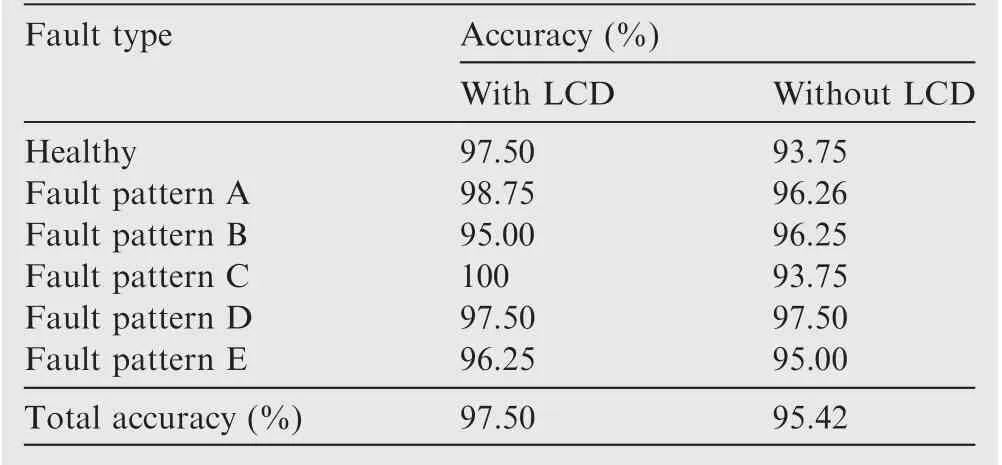
Table 3 Gearbox fault diagnosis accuracy with and without LCD applied.

Table 4 Gearbox fault diagnosis accuracy of different diagnostic methods.
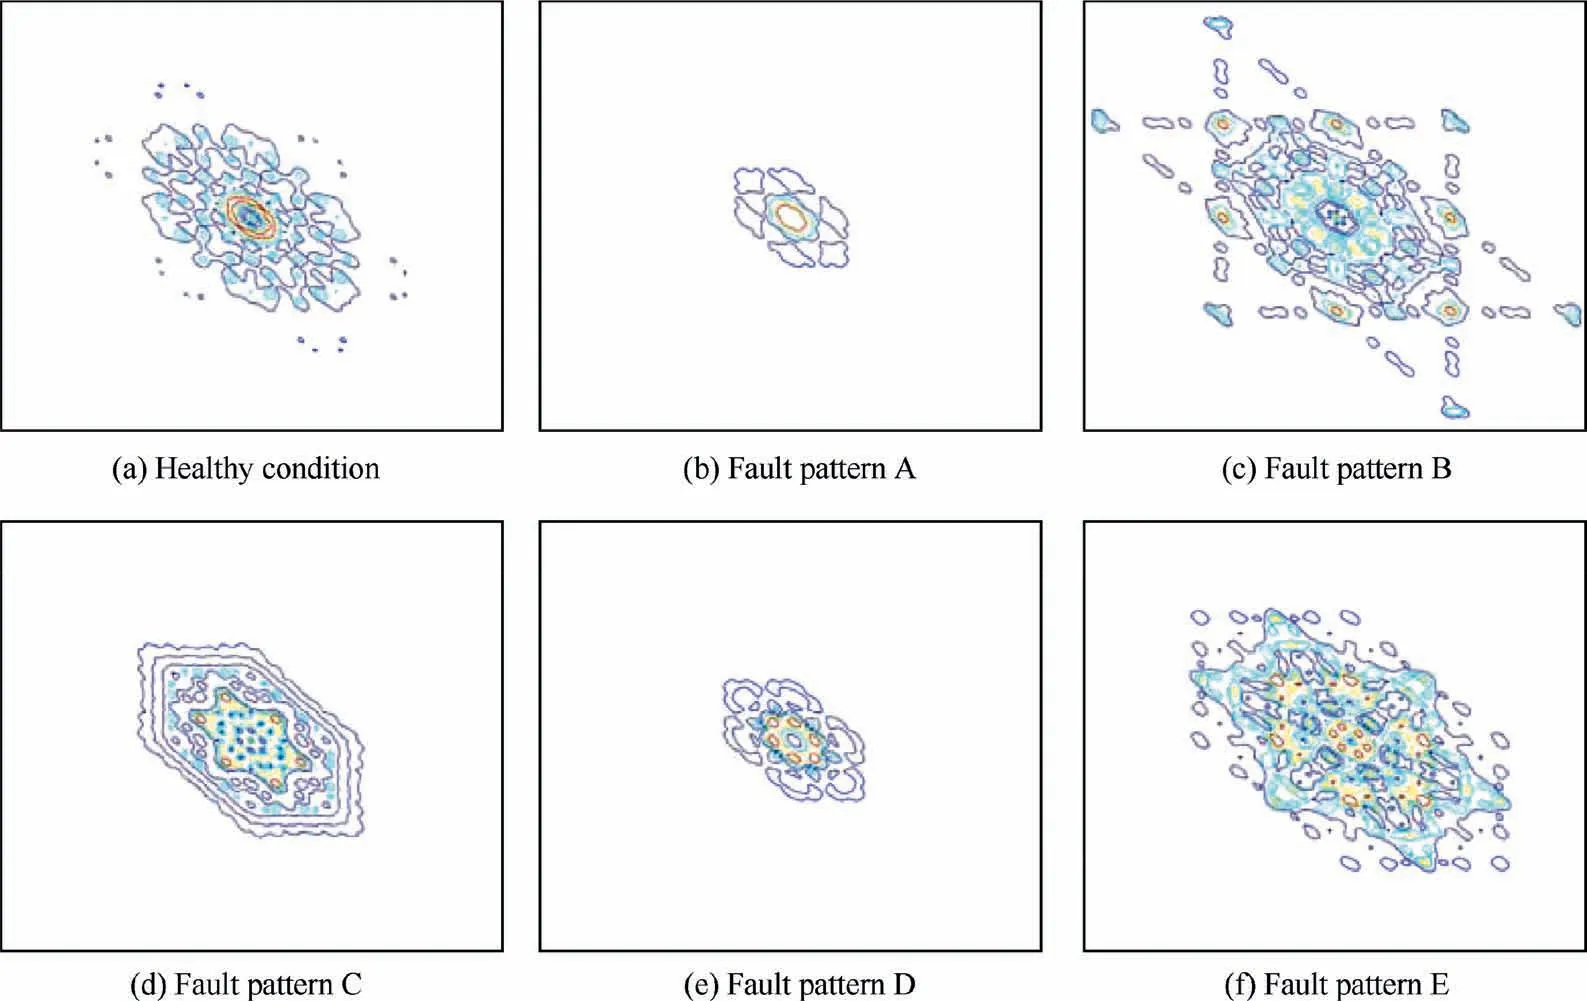
Fig.9 Bi-spectrum contour maps using collected original vibration signals.
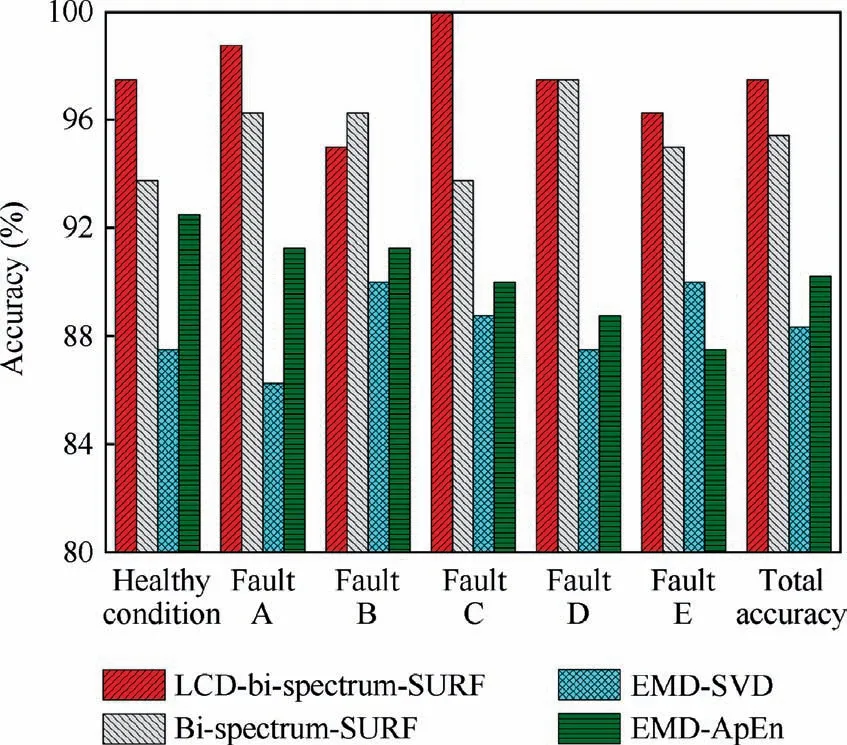
Fig. 10 Results of multi-fault diagnosis for gearbox of an aerospace utilization system.
5.Conclusions
In this paper,a novel online fault diagnosis method,the multifault features indexing approach,is proposed for monitoring the operation status of the gearbox machinery of an aerospace utilization system.The method follows three main steps:(A)generate bi-spectrum map of fault signals: a bi-spectrum analysis is applied to transform the vibration signals of an online-working-state gearbox;(B)extract features out of the bi-spectrum map:SURF is introduced to extract the feature points of the bi-spectrum contour map automatically;(C)recognize fault patterns using classification:based on the features extracted by SURF,RF classification method is then used to identify the fault types of the gearbox.Differing from the traditional fault diagnosis methods which analyze vibration signals in a one-dimensional space, the proposed method applies the above ensemble computational method to process a field of image in a two-dimensional space,achieves the self-extraction capability, and what's more, significantly improves the accuracy of fault diagnosis of a gearbox machinery.In addition,almost no manual intervention is needed during the whole diagnosis process,which breaks the bottleneck of other methods that require a large amount of expert knowledge.
Acknowledgements
This study was supported by Chinese Academy of Sciences(CAS)Pioneer Hundred Talents Program(No.2017-112).
杂志排行
CHINESE JOURNAL OF AERONAUTICS的其它文章
- Special Column:NDT and SHM in Aerospace
- Hypervelocity impact induced shock acoustic emission waves for quantitative damage evaluation using in situ miniaturized piezoelectric sensor network
- Multiphysics simulation method of Lamb wave propagation with piezoelectric transducers under load condition
- A Lamb wave signal reconstruction method for high-resolution damage imaging
- Effect of surface blowing on aerodynamic characteristics of tubercled straight wing
- Effects of blade aspect ratio and taper ratio on hovering performance of cycloidal rotor with large blade pitching amplitude
