Hypervelocity impact induced shock acoustic emission waves for quantitative damage evaluation using in situ miniaturized piezoelectric sensor network
2019-06-03MenglongLIUQingWANGQingmingZHANGRenrongLONGFngsenCUIZhongqingSU
Menglong LIU ,Qing WANG ,Qingming ZHANG ,Renrong LONG ,Fngsen CUI ,Zhongqing SU
a Institute of High Performance Computing,A*STAR(Agency for Science,Technology and Research),Singapore 138632,Singapore
b School of Automation,Nanjing University of Posts and Telecommunications,Nanjing 210023,China
c State Key Laboratory of Explosion Science and Technology,Beijing Institute of Technology,Beijing 100081,China
d Department of Mechanical Engineering,The Hong Kong Polytechnic University,Kowloon,Hong Kong Special Administrative Region
KEYWORDS Acoustic Emission(AE);Damage detection;Hypervelocity impact;Piezoelectric sensor;Whipple shielding assembly
Abstract Manmade debris and natural meteoroids,travelling in the Low Earth Orbit at a speed of several kilometers per second,pose a severe safety concern to the spacecraft in service through the HyperVelocity Impact(HVI).To address this issue,an investigation of shock Acoustic Emission(AE)waves induced by HVI to a downscaled two-layer Whipple shielding structure is performed,to realize a quantitative damage evaluation.Firstly a hybrid numerical model integrating smoothparticle hydrodynamics and finite element is built to obtain the wave response.The projectiles,with various impact velocities and directions,are modelled to impact the shielding structure with different thicknesses.Then experimental validation is carried out with built-in miniaturized piezoelectric sensors to in situ sense the HVI-induced AE waves.A quantitative agreement is obtained between numerical and experimental results,demonstrating the correctness of the hybrid model and facilitating the explanation of obtained AE signals in experiment.Based on the understanding of HVI-induced wave components,assessment of the damage severity,i.e.,whether the outer shielding layer is perforated or not,is performed using the energy ratio between the regions of‘‘high frequency”and‘‘low frequency”in the acquired AE signals.Lastly,the direct-arrival fundamental symmetric wave mode is isolated from each sensing signal to be input into an enhanced delay-andsum algorithm,which visualizes HVI spots accurately and instantaneously with different sensor network configuration.All these works demonstrate the potential of quantitative,in situ,and real time HVI monitoring using miniaturized piezoelectric sensor network.
1.Introduction
Low Earth Orbit is where most spacecraft Orbit,together with numerous Meteoroids and Orbital Debris(MOD)particles.The potential HyperVelocity Impact(HVI)between spacecraft and MOD will exert a severe safety concern and may lead to mission failure due to the extremely high relative velocity up to 20 km/s.Even a small particle with the size of 1 cm,can penetrate almost any shielding structure of the spacecraft.1According to the report of National Aeronautics and Space Administration(NASA),more than 20000 pieces of orbital debris larger than 10 cm,over 500000 sized 1-10 cm,and tens of millions smaller than 1 cm,are known to exist in Low Earth and geosynchronous orbits.2
Addressing the above safety concern,NASA has already established a Space Surveillance Network that is capable of tracking any particle with size over 5 cm,and thus guides the movement of spacecraft,dodging the coming MOD particles3.However,any particle with size less than 5 cm still poses severe safety concern to the spacecraft. On one hand, several advanced shielding structures4,5have been designed and placed outside the spacecraft to increase the resistibility against MOD particles.It is reported currently that the maximum allowed particle to be blocked is less than 1 cm1.On the other hand,the deployment of HVI monitoring system to quantitatively characterize the HVI-induced damage and to guide the further action of repair/replacement is of great significance to ensure the mission success.
Prior to the proposal of any practical HVI monitoring methodology,the interrogation and understanding of HVI and its related phenomenon are essential.Compared with conventional low-and high-velocity impact of speed up to several hundred meters per second,HVI,with a much higher speed,features much severer material distortion and compression,6,7which entails an intensive analysis of the elastic-plasticity response mechanism.The solid-fluid transition attributed to the energy conversion from mechanical energy to internal energy is common in HVI.8Besides that,as the structure cannot respond promptly to the HVI,a localized shock wave is generated,8and then propagates along both the out-of-plane and in-plane directions.
HVI experiment on the ground offers a convenient way for investigation.However,as the experiment system is extremely complex,repeated experiments are usually required to obtain a convincing result,which makes the investigation usually high cost in both money and labor.Addressing this drawback of experimental investigation, numerical simulation offers an alternative to the experiments.To take all the above effects of HVI into consideration,the authors previously proposed a hybrid modeling method9comprising Smooth-Particle Hydrodynamics(SPH)10,11and Finite Element(FE).In this method,the central area where HVI impinges is discretized with SPH particles to allow large distortion and deformation,and the neighboring area is discretized with elements to improve calculation efficiency.These results obtained from the hybrid model will be compared with the experimental results in this research.
To estimate the residual integrity of the spacecraft upon HVI, a quantitative evaluation of HVI-induced damage,including the impact location and severity,must be performed accurately and instantaneously.The identification of impact location can help determine whether a key component is struck or not.The impact severity to the outer shielding layer,i.e.penetrated or not,facilitates the decision if replacement is required.Then,based on the evaluation,remedial actions of replacement/repair can be applied before the HVI induced damage reaches a critical level,in order to prevent an impacted space structure from degenerating and to lower the risk of a cascading failure of the entire in-service space system.
To address the above significant and imminent needs,several sensing and diagnostic techniques12-23have been deployed, and graded systematically by the Inter-Agency Space Debris Coordination Committee1,as typified by those using Acoustic Emissions(AEs),acceleration-based detection,thermography,calorimetry,fiber optic sensor-based detection,resistor-based detection,microwave emissions,and camerabased surface inspection.Balancing all the indicators including sensitivity,accuracy,and manipulability,the AE-based methods achieve the highest grade among all the above mentioned techniques.
Some representative AE-based works are briefed here.Prosser et al.21pioneered the work comparing AE signals generated by HVI(1.8-2.7 km/s)and Low Velocity Impact(LVI)(<0.21 km/s).It is concluded that the extensional wave dominates over flexural wave in HVI,while the opposite holds true for LVI.Besides,HVI induced AE signals show a much larger amplitude and wider frequency range compared to LVI induced signals.Forli12initiated the localization of HVI on the European Space Agency's Columbus module based on HVI-induced AE signals, with localization error approximately 0.4 m.Scha¨fer and Janovsky13continued this work on both an aluminum alloy panel and a sandwich panel of Columbus module. Six bulky ultrasonic transducers are deployed to sense HVI-induced AE waves.A conventional triangulation algorithm was adopted to pinpoint the HVI spot.All these works have validated the capability and effectiveness of AE-based detection for locating HVI spots.
Despite all the above AE-based researches,several imminent issues are yet to be addressed.One is that a fundamental understanding of HVI-induced AE waves is still lacking,which prevents a comprehensive characterization of HVI-induced damage.Another issue is that the current AE-based methods using bulky ultrasonic transducers lack the ability to realize a potential real-time monitoring of HVI to spacecraft in service.In addition,a quantitative assessment of HVI-induced damage,e.g.,impact location,or whether the shielding layer is penetrated,is worth an intensive investigation.
Aiming at an in situ and potential on line characterization ability of real-time awareness of HVI incidence and quantitative evaluation of HVI-induced damage in space structures,this study is dedicated to the development of a Structural Health Monitoring(SHM)system of HVI,with a fundamental theoretical and experimental investigation of HVI-induced AE waves.The main contribution of this study can be concluded as follows:(A)an in situ HVI monitoring system based on miniaturized Lead Zirconate Titanate(PZT)wafers is constructed;(B)the feature of HVI-induced shock AE wave is studied to correlate with severity level of HVI-induced damage;and(C)a delay-and-sum based HVI localization algorithm using shock AE waves is developed and validated with various sensor network configurations.
The main structure of this paper is as follows.HVI experiment and SHM system development are elaborated in Section 2,with generated shock AE waves acquired using an in situ miniaturized PZT sensor network.The principle of the hybrid numerical method SPH-FE for HVI modeling is briefed in Section 3.The experimental and numerical results are analyzed in Section 4,following a quantitative characterization of HVI in Section 5.Concluding remarks are drawn in Section 6.
2.HVI experiment and SHM system development
2.1.HVI experiment
The HVI tests are performed via the HVI facilities in the State Key Laboratory of Explosion Science and Technology,China.The core equipment of the facilities is a two-stage light gas gun,via which a projectile can be accelerated up to 10 km/s before impinging on a target structure.The two-layer Whipple shielding assembly,made of Aluminum 2024,is immobilized in the testing chamber located at the rear of the gas gun.The material parameters of both projectile and shielding layers,made of Aluminum 2024,are listed in Table 1.Four connection bolts connect the outer and inner layers.The assembly can rotate to a desired angle,which enables both normal and oblique impacts.Two normal HVI plus one oblique HVI are performed to impinge separately on the two-layer Whipple shielding assembly.The projectile speed is measured based on the transit time of the projectile through two magnetic coils.The detailed geometry sizes and experimental parameters of the two-layer shielding assembly undergoing HVI tests are displayed in Fig.1,and summarized in Table 2.The outer layer is struck by the projectile first.If penetrating the outer layer,the projectile,in a shattered form,together with the ejected outer target layer,forms a debris cloud that further impacts the inner layer.

Table 1 Material parameters of HVI projectile and shielding layers.
2.2.SHM system for HVI monitoring
The developed SHM system for HVI is as illustrated in Fig.2.Seven PZT sensors(Φ8 mm in diameter,0.48 mm in thickness),P0to P6,are bonded on the surface of the outer layer,using a dual-component adhesive(Pattex®).To validate the feasibility of different configuration of sensor network,in Case I,the sensors are deployed circumferentially equidistant(180 mm)to the plate center,and in Cases II and III,the sensors are deployed in the spiral form with distance to the plate center increasing from 60 mm to 180 mm at an increment of 20 mm.All the seven sensing channels are on the‘‘standby”status,waiting for capturing HVI-induced AE signals in synchronization.Channel P0is set as the trigger that when the incoming voltage amplitude exceeds 1 volt,the acquisition system instantly records the voltage signals on all the channels.Based on the result of numerical modeling(briefed in Section 3),that the vast shock AE energy may produce a voltage signal exceeding the measuring range(-10 to 10 V)of the acquisition system, a signal attenuation module is selfdeveloped to allow for an attenuation of 15 times.The attenuated signal is sampled with a high speed digitizer(NI®PXI-5412).A sampling frequency of 20 MHz is adopted throughout the entire test.Developed on a PXI(PCI eXtensions for Instrumentation)bus platform(NI®PXIe-1071),the SHM system further integrates the function of signal processing,HVI localization algorithm,and damage severity assessment(with results analyzed in Section 5).

Fig.1 Geometry illustration of two-layer Whipple shielding assembly under HVI.

Table 2 Key parameters and consequences of three HVI tests.
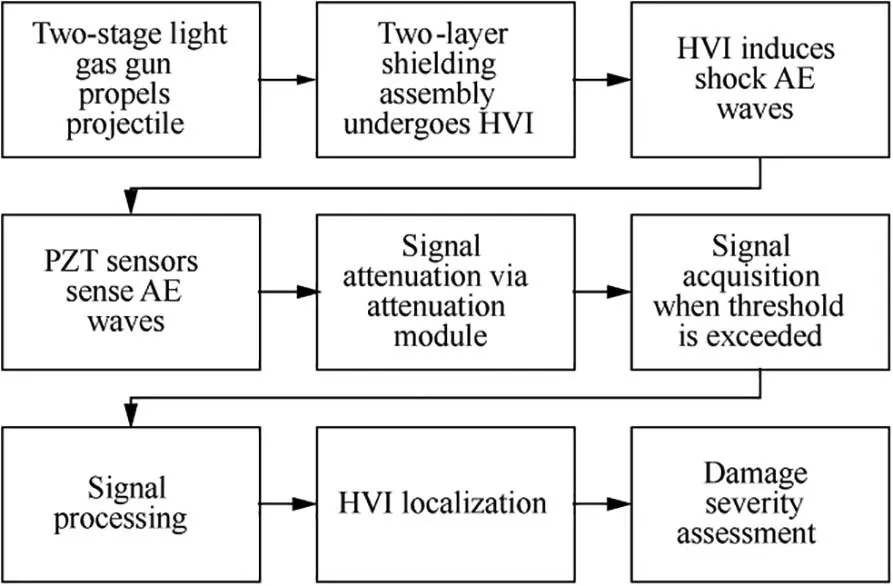
Fig.2 Illustration of monitoring system for HVI.
3.Modeling of HVI
Combining particle-based SPH and element-based FE is a balanced consideration to guarantee both calculation efficiency and accuracy.SPH can well characterize the large material distortion and compression induced by HVI.Nevertheless,if the entire model is discretized into SPH particles,the calculation effort spent on search and update of neighboring particles in a support domain Ω surrounding each particle in each time increment is enormous.Hence,SPH is only applied to the region with large material distortion and compression.And FE is introduced for discretization of the region with linear elastic response.
The detailed theoretical derivation of SPH is referred to the paper published previously by the authors9.The gist of SPH is briefed here to facilitate the readers'understanding.In SPH,the investigated structure is discretized into particles(j=1,2,···,N).Unlike the node in FE which belongs to one element or is shared by several elements in the entire computation duration,there is no fixed connection between any two particles in SPH.Upon discretization,the integral representation of a function f(x)|i(e.g.,displacement)at particle i is approximated,in terms of f( x)of its neighboring particles in a support domain Ω,as
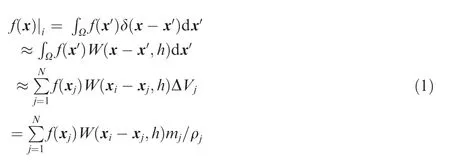
where ΔVj,mj,xjand ρjdenote the volume,mass,coordinate,and density of the jthneighboring particle of particle i,respectively.h is the smoothing length designating the influence area of the smoothing function W for approximation.δ is the Dirac delta function.Before each calculation step using Eq.(1),the particles adjunct to particle i are searched and updated.Featuring a meshless principle and hence free from any geometric constraints,SPH has been testified with the potential of effectively describing HVI-induced large material deformation.9
Another important concept to be mentioned is that,in hydrodynamics,stress σαβis composed of isotropic part pressure p and deviatoric part shear stress ταβas

where χαβsignifies the Kronecker delta.As stressed in the literature,8,9the pressure part p is correlated to the density and internal energy through equation of state,while deviatoric part shear stress ταβcorrelated to the shear strain through strength model.These two stress components play a significant role in HVI-induced AE waves,as explained in Section 4.
Following exactly the same setup as that in the experimental test, three numerical simulation models are built in ANSYS/Autodyn24using the hybrid approach of SPH-FE,as illustrated in Fig.3.Attributed to the symmetry of the HVI test,only half the sphere and half the outer layer are modelled,greatly saving the calculation effort.The half projectile sphere and the central area of the outer layer with in-plane dimension 50 mm×25 mm are discretized with SPH particles of size 0.2 mm,while the remaining area of the outer layer is meshed with FE elements of 0.5 mm.The FE nodes and SPH particles that share the same geometrical coordinates are connected via a tie constraint.A symmetric boundary condition is applied at the face in the x-z plane that HVI impinges on,and the other face in the x-z plane and two faces in the x-y plane are all fixed.
4.Analysis of HVI-induced shock AE signals
4.1.Comparison between experimental and simulated HVIinduced shock AE signals
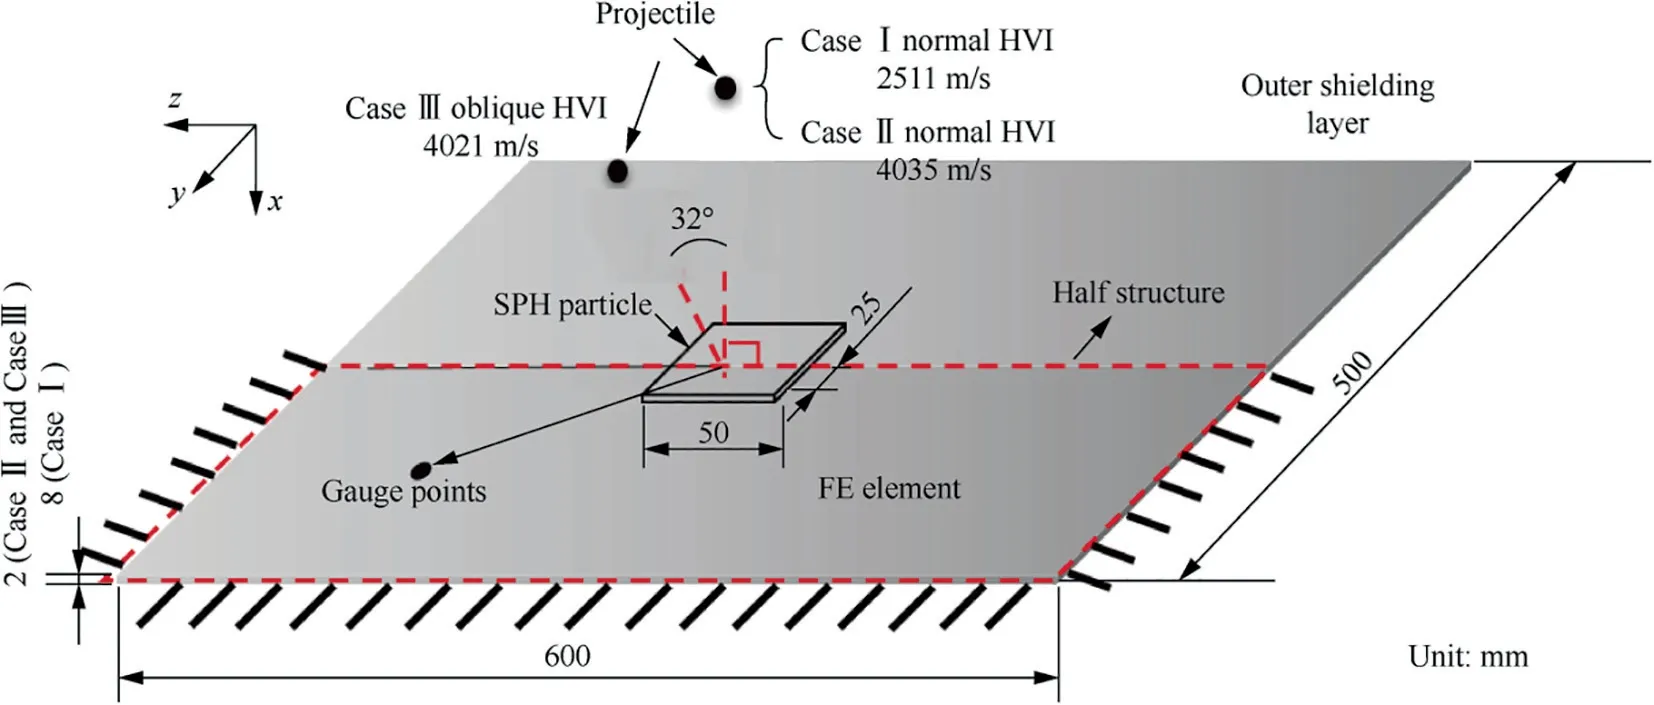
Fig.3 Illustration of hybrid SPH-FE model.

Fig.4 Two-layer Whipple shielding assembly in oblique HVI Case III and impacted outer layer in Cases I,II,and III,respectively.
The two-layer Whipple shielding assembly in the oblique HVI Case III is displayed in Fig.4(a),together with three impacted outer layers shown in Figs.4(b)-(d)corresponding to Cases I,II,and III,respectively.Note that the sensor P7,a kind of nanocomposite sensor,is irrelevant to the current study.In Case I,the outer layer is not penetrated,while in Cases II and III,the outer layers under both the normal and oblique HVIs are penetrated,forming a plume-like debris cloud that further impacts the inner shielding structure.
In the numerical model,the in-plane strain signal along the direction from the HVI spot to the gauge point is extracted,to compare with the experimentally acquired AE signals with miniaturized PZT sensors.As the outer shielding layer is considered thin compared with the concerned wavelength of HVIinduced AE waves,the theory of guided Lamb wave is applied here,to classify the wave component as Symmetric(S)and Anti-symmetric(A)waves.Take the AE signal of a gauge point at a distance of 80 mm from the HVI spot in Case II for example(see Fig.5).In the numerical model,through an addition and subtraction of AE signals at two gauges points with the same in-plane coordinates at the top and bottom surfaces of the shielding layer,the separation of symmetric and anti-symmetric strains is achieved.It is easily noticed via the separation that the first arrival wave is the fundamental symmetric S0wave,which is followed by the fundamental antisymmetric A0wave(see Fig.5).Higher modes other than S0and A0are possibly generated only when a thick outer layer is struck by an extremely high speed.9Besides,the amplitude of S0is larger than that of A0in Case II when the outer layer is perforated.Comparing the experimentally and numerically obtained shock AE signals(see Fig.6(a)),the experimental signal contains both the vibration induced low frequency noise and measurement system induced high frequency noise.Both the noise sources can be filtered out using a second-order Butterworth filter with a bandpass of 5-500 kHz.A good accordance is observed between the experimentally acquired filtered and numerically simulated AE signals(see Fig.6(b))in terms of wave form and amplitude ratio of S0and A0.Thus the effectiveness of the hybrid SPH-FE method for HVI modeling is validated.
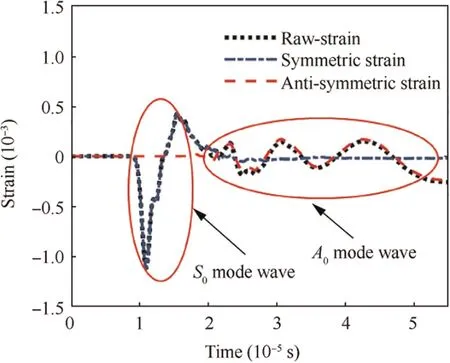
Fig.5 Numerically obtained in-plane strain along wave propagation direction at gauge point at a distance of 80 mm from HVI spot in Case II.
4.2.Time-frequency domain analysis of HVI-induced shock AE signals
The experimentally acquired AE signals at the sensor P6in all the three cases are displayed in Fig.7.The second-order Butterworth filter with bandpass of 5-500 kHz is applied to all the raw signals in order to screen all the noise sources.Take the filtered direct-arrival waves into analysis (see Fig. 7), the amplitude dominance of S0over A0in both penetrated Cases II and III is conspicuously noticed,while A0prevails over S0in Case I without penetration.This difference can be explained as follows.In Eq.(2),the isotropic component pressure p controls the initiation of shock wave,whose most energy will be converted to S0;the deviatoric component shear stress τ controls the initiation of shear wave,whose most energy will be converted to A0.As HVI induces a large material compression,the pressure p is much larger than the deviatoric stress τ,especially in the penetrated case when the impacted area behaves as fluid and is thus almost unable to hold the shear stress.Thus,the energy occupied by S0outweighs that by A0in Cases II and III(see Figs.7(b)-(c)).In contrast,in Case I,since the impact speed(2511 m/s)is not high enough to penetrate the impacted outer layer,the deviatoric stress τ is dominant.Thus the energy occupied by A0outweighs that by S0(see Fig.7(a)).These observations are in agreement with Prosser et al.'s conclusions.21In sum,the energy distribution between S0and A0can act as an indicator whether the outer layer is penetrated or not.This identification is of great significance in recognition that only when the outer layer is penetrated,HVI will induce a potential threat to the equipment and staff capsuled by the inner layer/structure.

Fig.6 Comparison of experiment and simulation AE signals at a gauge point 80 mm from HVI spot in Case II.

Fig.7 Experimentally acquired AE signals at sensor P6 in Cases I,II,and III.
A time-frequency domain analysis is performed based on the experimentally acquired AE signals in Case II at the sensors P3and P6,in comparison to the theoretical arrival time of guided Lamb wave in the frequency band 0-0.5 MHz(see Fig.8).The theoretical arrival time is obtained by the known wave propagation distance divided by the theoretical group velocity calculated via the Raleigh-Lamb equation25.Shannon complex Wavelet Transform26(WT) is adopted to extract the energy spectrum in the time-frequency domain.As the sensor P6is closer to the boundary compared to P3, only the obtained energy spectrum corresponding to the direct-arrival S0wave with P6can be well identified,while the direct-arrival A0wave is strongly mixed with boundary reflection of S0(see Fig.8(b)).In contrast,both the direct-arrival A0and S0waves acquired with P3are easily identified via the correspondence with the theoretical curve(see Fig.8(a)).Overall speaking,the propagation of AE waves induced by HVI follows the physics of guided wave in plate structures.Then a further quantitative evaluation of HVI based on AE waves,i.e.penetration of the outer shielding layer and localization of HVI spot,is performed in the next section.

Fig.8 Time-frequency domain energy spectrogram of experimentally acquired AE signals in Case II.
5.Quantitative characterization of HVI-induced damage
5.1.Severity assessment of HVI-induced damage to outer shielding layer:Penetrated or not
A penetrated outer layer indicates that HVI will induce a potential threat to the equipment and staff capsuled by the inner layer/structure.To separate the energy of HVI-induced shock AE waves into regions of‘‘low-frequency”and‘‘highfrequency”,a frequency-domain analysis is performed on the first 3000 points of the acquired AE signals,equivalent to 0.15 ms time duration since the arrival of the direct-arrival S0wave. To suppress the interference induced by lowfrequency vibration and high-frequency measurement noise(both explained in Fig. 7), starting frequency for ‘‘lowfrequency”and terminating frequency for‘‘high-frequency”are set as flow=10 kHz and fhigh=150 kHz,respectively.Then the cutting frequency fcseparating regions of‘‘low-frequency”and ‘‘high-frequency” undergoes a sweeping from 15 to 145 kHz at an increment of 5 kHz.The energy ratio ER is defined as

where Efdenotes the energy amplitude,which is the square of amplitude under frequency f obtained via Fast Fourier Transform.
An average value of the energy ratios combining all the seven sensing channels in each case displays the relationship between damage severity and average energy ratio (see Fig.9).In both penetrated cases(Cases II and III),the average energy ratio is higher than that in the no-penetrated Case I.This is because the energy ratio occupied by the generated symmetric mode with high frequency in the penetrated case is larger than that in the no-penetrated case.Besides,this difference is less noticeable as the frequency increase,as both the symmetric mode with high frequency and anti-symmetric mode with low frequency will gradually fall into the‘‘lowfrequency” region when the cutting frequency increases.Observing the three curves in Fig.9,fc=30 kHz is adopted for HVI-induced damage assessment whether the outer shielding layer is penetrated or not.

Fig.9 Energy ratio with cutting frequency from 15 kHz to 145 kHz of HVI-induced shock AE signals acquired by PZT sensors.
5.2.Localization of HVI spot
Besides the identification whether or not HVI penetrates the outer shielding layer,the spot that HVI impinges on is the other quantitative characteristic of great significance.Take Case III for example, the experimentally acquired HVIinduced raw AE signals are shown in Fig.10.The gradual increase of arrival time of the direct-arrival wave acquired from P0to P6shows a correspondence of the increase of wave propagation distance from HVI spot to the respective sensor.This observation indicates the potential of using time-offlight based methods for HVI localization.Among all the methods,the delay-and-sum imaging algorithm27,28is adopted.The principle is that using the acquired signal at P0for reference,each signal acquired from sensor P1to P6in the sensor network creates a two-dimensional synthetic image.In the image,a pixel corresponds to a spot in the outer layer,and a pixel value is correlated to the probability of HVI spot therein—a perception in response to the existence of HVI spot from the sensor that creates such an image.Adding the images via all sensing paths in the sensor network yields a superposed image(ultimate resulting image in what follows)—a joint identity of HVI from the entire sensor network.

Fig.10 HVI induced raw AE signals in Case III.
Note that in Fig.10 the mentioned noise sources from vibration and measurement system may mask the direct-arrival wave.Particularly,as the sensor P0has the shortest distance to the HVI spot compared with other sensors,the vibration induced noise almost masks the direct-arrival S0wave acquired with P0.Hence in order to extract only the S0wave with a narrow time duration,all the signals go through a processing(illustrated in Fig.11)including the following key steps:
(1)Perform Shannon complex WT with a central frequency of 100 kHz to extract mainly the S0mode wave packet.
(2)Find the time instant tpeakcorresponding to the maximum amplitude of S0mode wave packet.
(3)Construct a Hanning window centralized at tpeakwith period T=1/(100 kHz)=1×10⁻⁵s.
(4)Obtain the wave packet for HVI imaging by multiplying the WT wave packet with Hanning window.
Provided a central frequency of 100 kHz,group velocities of S0mode wave for shielding layers of 2 mm(Cases II and III)and 8 mm(Case I)thick are 5580 m/s and 5543 m/s,respectively,as the input of the imaging algorithm.All the obtained HVI imaging results,including three HVI cases with different sensor network configurations,are displayed from Figs.12 to 14.With two working sensors,one branch of a hyperbola is marked on the imaging(see Figs.12(b),13(a)and 14(a)),unable to pinpoint HVI spot.Note that P1in Case I is accidently disconnected from the measurement system and thus no signal is acquired.With the number of working sensors increased to three and four,the imaging results in three HVI cases intuitively imply the HVI spot,but only those in Case I(see Fig.12(c)and(d))clearly identify the HVI spot.The reason is that the sensors are placed more compactly in Cases II and III than in Case I,and that leads to the overlap of hyperbola from each pair of sensing path.A further increase of working sensors to five or more included in the sensor network gives the imaging results clearly pinpointing HVI spots in all the three cases.

Fig.11 Illustration of conversion from raw AE signal to wave packet for HVI imaging.
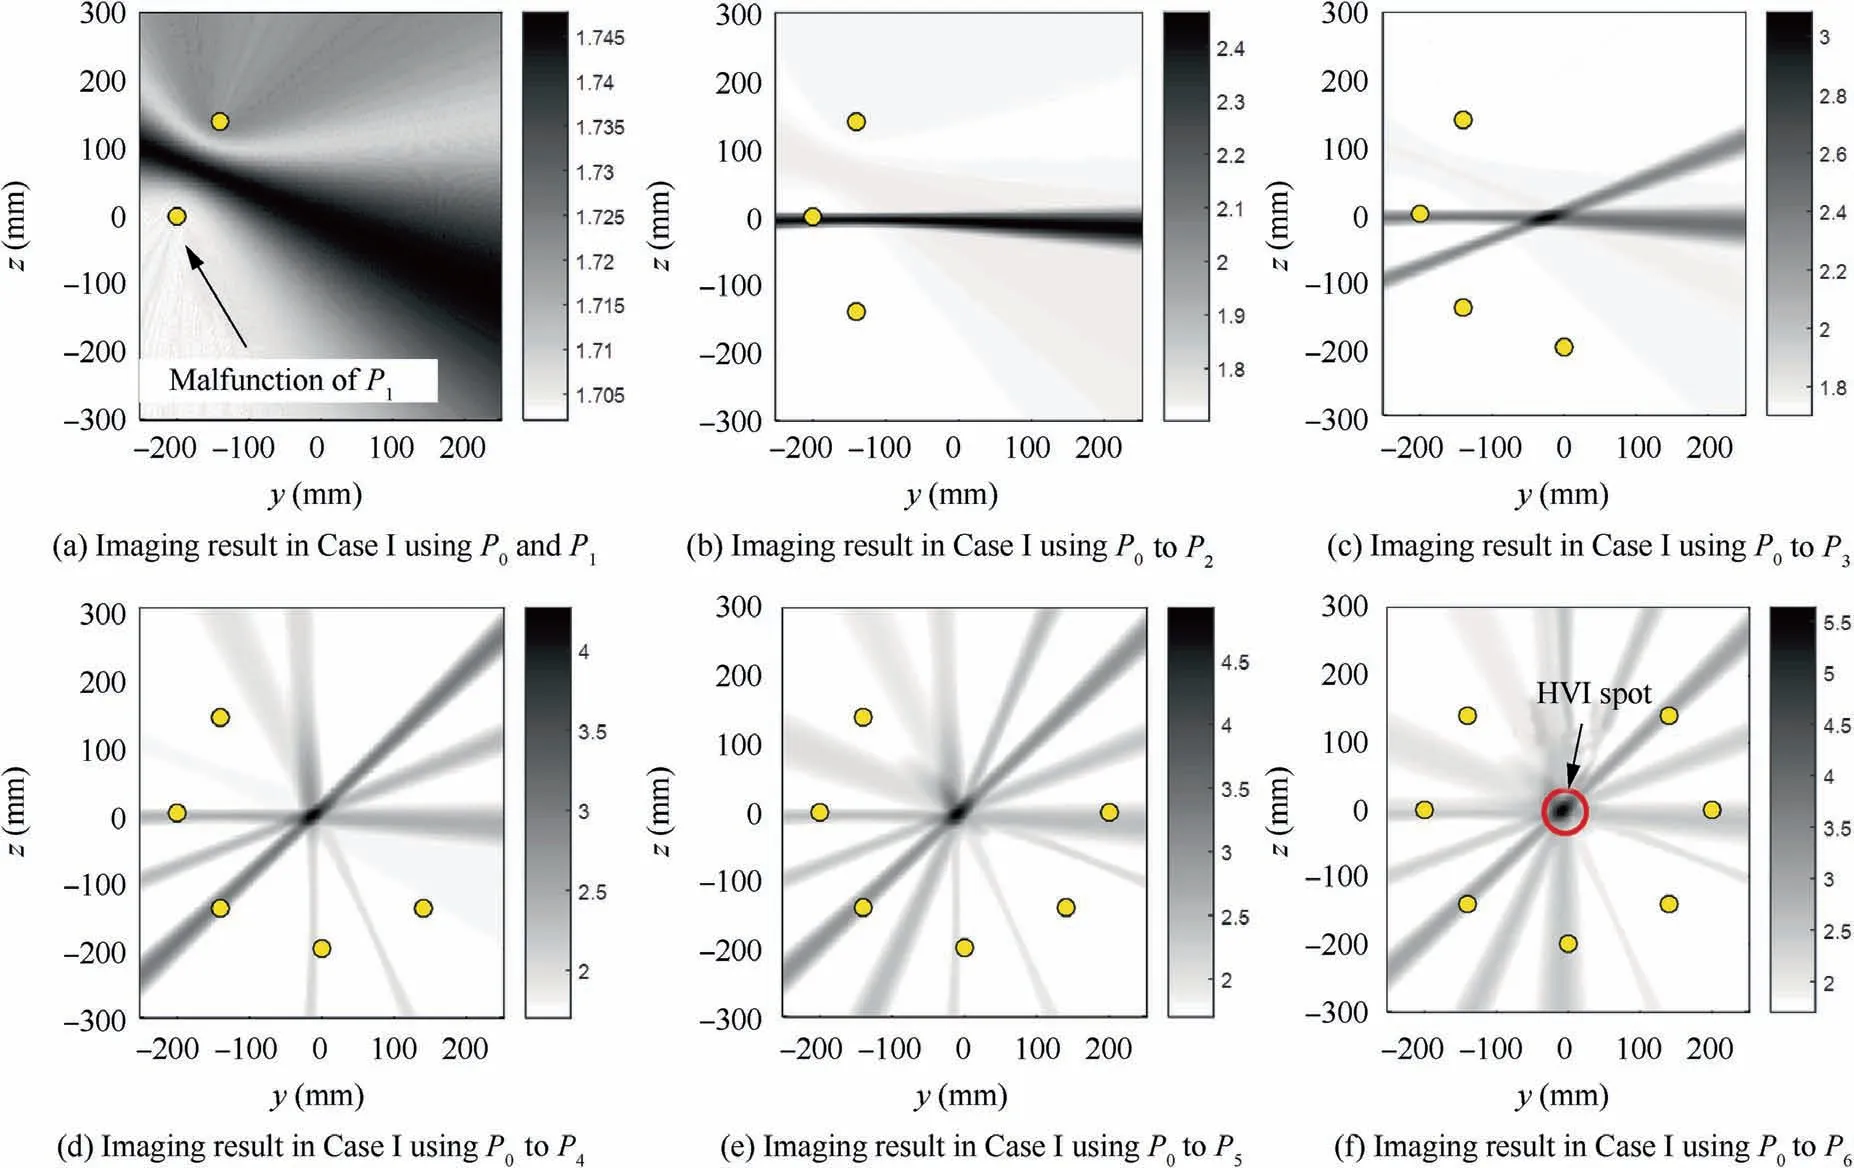
Fig.12 Imaging results of normal HVI in Case I.
Conclusively,the proposed signal processing and the delayand-sum algorithm have shown their capability in HVI spot localization.In addition,a sensor network composed of at least four sensors with some distances from each other is suggested to pinpoint HVI spot.The proposed signal processing method not only separates the direct-arrival S0mode from the perplexing response signals,but also compresses the wave packet in the time domain,both improving the time-domain resolution of direct-arrival S0mode in the acquired shock AE signals, and hence spatial-domain resolution in the imaging results.With this signal processing method,even though the sensor network does not form a circle surrounding the HVI spot(such as Figs.13(b),13(c),Figs.14(b)and 14(c)),HVI spot can still be pinpointed via the imaging algorithm.

Fig.13 Imaging results of normal HVI in Case II.

Fig.14 Imaging results of oblique HVI in Case III.
6.Conclusions
(1)The identification whether the outer shielding layer is penetrated or not is realized according to the energy ratio between the high frequency and low frequency components in HVI-induced shock AE signals.
(2)The localization of HVI spot is realized via an advanced signal processing and improved delay-and-sum method,based on the understanding of HVI induced AE waves.
(3)A proof-of-concept SHM system with in situ miniaturized PZT sensor network to sense HVI induced AE waves is built,validating the effectiveness of AE based method towards an in situ and potentially real time quantitative characterization of HVI.
Acknowledgements
M.Liu and F.Cui want to thank the Institute of High Performance Computing for the use of computational resources to carry out this research.Z.Su is grateful to the Hong Kong Research Grants Council via a General Research Fund(Nos.15201416 and 15212417)and also the National Natural Science Foundation of China(No.51635008).
杂志排行
CHINESE JOURNAL OF AERONAUTICS的其它文章
- Guide for Authors
- Effect of W addition on phase transformation and microstructure of powder metallurgic Ti-22Al-25Nb alloys during quenching and furnace cooling
- Thermoelastohydrodynamic analysis of misaligned bearings with texture on journal surface under high-speed and heavy-load conditions
- Role of the inter-pass cooling rate in recrystallization behaviors of Ni-based superalloy during interrupted hot compression
- Crystal orientation and morphology of α lamellae in wrought titanium alloys:On the role of microstructure evolution in β processing
- Three-dimensional finite-time cooperative guidance for multiple missiles without radial velocity measurements
