Waveband Selection with Equivalent Prediction Performance for FTIR/ATR Spectroscopic Analysis of COD in Sugar Refinery Waste Water
2019-05-10JunXieDapengSunJiaxiangCaiandFuhongCai
JunXie,DapengSun,JiaxiangCaiandFuhongCai,
Abstract:The level of chemical oxygen demand (COD) is an important index to evaluate whether sewage meets the discharge requirements,so corresponding tests should be carried out before discharge.Fourier transform infrared spectroscopy (FTIR) and attenuated total reflectance (ATR) can detect COD in sewage effectively,which has advantages over conventional chemical analysis methods.And the selection of characteristic bands was one of the key links in the application of FTIR/ATR spectroscopy.In this work,based on the moving window partial least-squares (MWPLS)regression to select a characteristic wavelength,a method of equivalent wavelength selection was proposed combining with paired t-test equivalent concept.The results showed that the prediction effect of the selected wavelength was very close to that of the MWPLS method,while the number of wavelength points was much smaller.SEPAve,RP,Ave,SEPStd,and RP,Std which characterized the modeling effect were 26.3 mg L-1,0.969,3.49 mg L-1,and 0.006,respectively.The validation effect V-SEP and V-RP were 28.64 mg L-1 and 0.960,respectively.The selected waveband was between 1809 cm-1 and 1568 cm-1.The method was of more reference value for the design of FTIR/ATR spectral instrument for COD detection.
Keywords:Sugar refinery wastewater,COD,FTIR/ATR spectroscopy,waveband selection.
1 Introduction
The discharge of waste water from sugar refinery leads to severe environment pollution.There are many sugar industries in China.In order to cope with the corresponding environmental problems,the sugar industries have established waste water disposal facilities successively.The COD is the code name of chemical oxygen demand,which represents the oxygen required for the oxidation of organic matters in a liter of sewage by potassium dichromate under strong acidic conditions.It assesses the quality of water and serves as a significant indicated parameter for the discharge of sugar factory liquid waste.[Bekiari and Avramidis (2014)].The higher the COD is,the more serious the water is polluted by organic matter.Toxic organic matter into the water not only does harm to the organisms in the water,but also hurts the human through the enrichment of the food chain,causing chronic poisoning.Sewage with COD lower than 100 mg L-1,which is the value of emission standard in China,is permitted to be discharged,otherwise,it will be recycled to a carrousel oxidation ditch system and discharged after treatment.Therefore,it is necessary to analyze samples of the treated wastewater at specific points to determine whether their COD meet discharge standards or not.
The conventional method of measuring COD in wastewater with chemical reagents further pollutes the environment.The FTIR is an infrared spectroscopy technique used to obtain the absorption and emission of photoconductivity or Raman scattering of solid,liquid and gas.Conventional detection methods use pressure sheets or coatings for measurement,but this test method is not applicable to some special samples (such as insoluble and fragile samples).And the ATR technology solves the above problems.Both technologies,which have been widely used in many fields,are effective methods for the determination of molecular structure and content of components.They are characterized by convenient operation,high sensitivity of measurement and high quality of infrared spectra.[Rios,Rojas and Delgado(2012); Saguer,Alvarez and Sedman (2013); Ofelia,Maria,Pablo et al.(2015); Engel,Postma and Peufflik (2015); Rafig,Mehmet and Feride (2016)].
Besides,the existing researches mainly focused on COD analysis in effluent by near-infrared spectroscopy,but this technology has not been mature in monitoring and analyzing COD.As a result,many researchers are working on the establishment of correlation spectral models.[Sarraguca,Paulo,Alves et al.(2009); Ren,Ricardo and Onno (2017); Andreo,Garcí a,Quesada et al.(2017)].The research and the application of FTIR-ATR in sugar refinery waste water are few.Considering that the pollution sources of sugar refinery waste water are different from that of domestic sewage,the analytic waveband would be diverse as well,whose selection for the measurement of COD in sugar refinery waste water needs further study.
Partial least squares (PLS) regression is a statistical method related to principal component regression.But instead of finding the hyperplane with the minimum variance between response and independent variables,it finds a linear regression model by projecting predictive variables and observational variables into a new space.This method can scan spectral data synthetically and fetch information variables comprehensively.[Tenenhaus,Esposito,Chatelinc et al.(2004); Jun,Han,Jian et al.(2018)].However,several experiments indicated that it is necessary to select waveband properly.The signal-to-noise ratio of the modeling waveband influences the prediction result,that is,the prediction effect is difficult to improve if it is not high enough.The COD refers to the oxidation dose consumed when water samples are treated with a certain strong oxidant under certain conditions.It reflects the degree to which water is polluted by reducing substances.This index is also one of the comprehensive indexes of relative organic matter content.In fact,it is difficult to determine the corresponding band of COD in the waste water spectrum directly,so the rationality of the selection of stoichiometric waveband is of great importance for modeling.
In multi-component spectral analysis,moving window partial least squares (MWPLS) is an optimization method of waveband selection based on PLS model,which can select the band with the highest signal-to-noise ratio.MWPLS model varies with window size and window position in full spectrum [Jian,James,Heinz et al.(2002)].The wavebands selected by MWPLS are expected to construct better PLS models than the whole spectral region.Comparing with the results obtained by using whole spectral region,MWPLS can find out some wavebands,which often significantly improves the prediction performance.The optimal waveband selected by MWPLS is not limit to the number of wavelengths.On the other hand,from the statistical point of view,the wavebands with minor fluctuations of prediction accuracy are equivalent,because of randomness and the limitations of modeling samples.Therefore,studying waveband equivalence in certain sense and finding the equivalent waveband with smaller number of wavelengths are great significance for reducing model complexity and solving the practical limitations in the instrument design.This is where the MWPLS method in particular needs advancement.The application of this method not only has theoretical basis,but also has practical significance.In statistics,pairedt-test is an effective method to measure the fluctuation allowed [Montgomery and Runger (2003)].
In this work,the pairedt-test was implemented for equivalent waveband selection based on MWPLS method.The waveband selection,which is valuable for the design of specialized spectral instruments,not only has equivalent prediction effect but also only uses smaller number of wavelengths.
A collection of experimental results indicated that differences in partitioning of calibration and prediction sets would make the prediction effects for spectral analysis fluctuate.As a result,the parameters of optimal band varied greatly.The stability of model parameters was seldom involved in previous studies,because such studies were based on a large number of experiments.In view of the above,this work proposed a new modeling method combining the parameters of the stability model based on varied partitioning of the calibration and prediction sets.In the meanwhile,based on certain similarities,the calibration set and the prediction set were divided to avoid the distortion of model evaluation.Besides,a part of the samples were randomly selected from the whole samples as the verification set,which were not involved in modeling optimization to ensure the objective rationality of the model itself.
2 Experimental and methods
2.1 Experimental materials,instruments,and measurement methods
One hundred and five samples of treated waste water with low COD were collected from a sugar refinery.The COD was measured by the potassium permanganate oxidation method.The COD ranged from 45 mg L-1to 470 mg L-1.The values of the mean and standard deviation were 294.7 and 100.2 mg L-1,respectively.
The optical measuring apparatus was VERTEX 70 FTIR spectrometer (BRUKER Company)equipped with a KBr beam splitter and a deuterium triglycine sulfate KBr detector.With a horizontal ATR sampling accessory with a diamond internal reflection element on a ZnSe crystal (SPECAC Company,45° angle of incidence,3 times reflective),the scanning band range was 4000 cm-1to 600 cm-1.Each sample was measured three times and the average of the three spectra served as the spectrum of the sample.The environmental condition of the laboratory was controlled at 25°C±1°C and 46%±1% RH.
2.2 Model evaluation indicators and division method for sample sets
A total of 105 samples were used in this experiment.One part of them served as the validation set consisting of 45 samples that were chosen randomly,and the others served as the modeling set.In addition,40 samples of the modeling set were used as the calibration set,and the remaining 20 samples made up the prediction set for coming to 30 times.The division method is described as follows.Firstly,it is necessary to note that M-SEPiand M-RP,irepresent modeling root mean square error of prediction and modeling correlation coefficient of model prediction respectively.M-SEPAve,M-RP,Ave,are the code name of values of the mean for all divisions,while M-SEPStdand M-RP,Stdrepresent the standard deviation for all divisions.The choice of model parameters was determined by the smallest M-SEPAve.Furthermore,V-SEP and V-RPrepresent the predicted verification square root error and the predicted verification correlation coefficient.Finally,the prediction error in the correction set reflects the final result of modeling.
2.3 The moving window partial least-squares (MWPLS) model
Multiple spectral data points of adjacent waveshapes were divided into a window,and the PLS model was established by using different PLS factor numbers for the spectral region in the window.According to the prediction effect,the optimal PLS factor number was selected to obtain the optimal model of the window.The location or size of the window was changed separately to establish the PLS model in the window and select the optimal analysis band.According to the different size of the window,the different position of the window in the full spectrum,and the different number of factors in the window,different models can be obtained.
The parameters of the MWPLS method include the starting wavelength number (B),the number of spectral data points in the window,that is,the number of wavelength points(N),and the number of PLS factors (F).

Bmin,Bmax,Nmin,Nmax,Fmin,Fmaxare the threshold ranges of values ofB,NandFrespectively,which can be set according to different research objects.
Different combination of model parameters (B,N,F) can obtain different prediction effects.For any fixedBandN,the resulting window is different,and the optimalFis usually changed accordingly.The bestFcan be filtered out,and all data points in this window can be used for modeling to achieve the best effect.
TheSEPmincorresponding to each window (waveband) can be obtained by projecting the minimumSEPwith different PLS factor numbers onto the two planes of window starting position and window size respectively.
A computer algorithm platform was established for the above MWPLS method with variable parameters (B,N,F) by using Python3.4 software.On this platform,all models of entire windows can be established to find the global optimal model and the local optimal model.
2.4 Equivalent waveband based on paired t-test.
The modelling root mean square error of prediction corresponding toi-th division inj-th waveband was denoted simple by SEPi,j.The prediction effect vector corresponding to all M divisions was denoted by Eq.(2)

For the optimal waveband for MWPLS method,the prediction effect vector was denoted by Eq.(3)

In order to measure the equivalence between wavebandjand the optimal waveband,the statistically difference betweenandwas test by the pairedt-test method,as Eq.(4)

Where S as Eq.(5)

Taketvalue determined into the table of Student'st-distribution,the correspondingp-value can be found.If thep-value is below the threshold of statistical significance(usually is 0.05),the result is thatandare different,and otherwise,they are equivalent.
All the wavebands which were satisfied with equivalent condition above can all be as the waveband with equivalent prediction performance for the optimal waveband.
3 Results and discussion
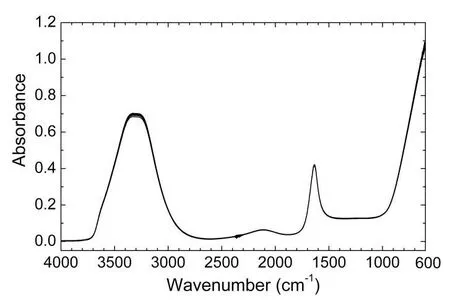
The spectra of the 105 samples are shown in Fig.1.For the whole region,the minimum M-SEPAvewas 38.1 mg L-1,and the corresponding M-SEPStd,M-RP,Ave,and M-RP,Stdwere equal to 3.21 mg L-1,0.944,and 0.013,respectively.In addition,the optimal F corresponding to the minimum M-SEPAvewas 4 at the same time.

Figure1:Spectra of 105 samples

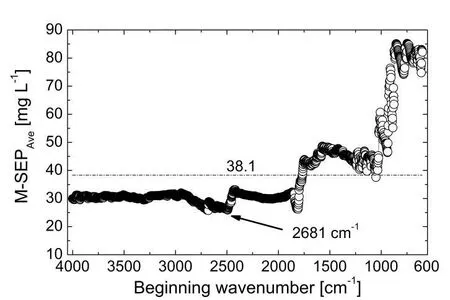
Figure2:The optimal M-SEPAve for each BW

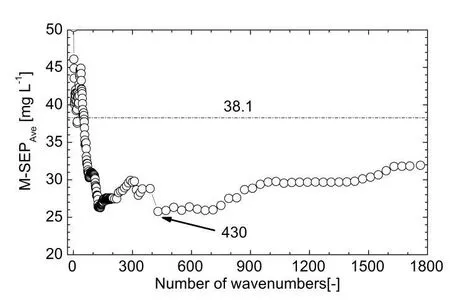
Figure3:The optimal M-SEPAve for each NW
In the MWPLS,the M-SEPAveof the partial optimization model for eachB and N are presented in Fig.2 and Fig.3,respectively.In the global optimal model,theB,N,Fwere 2681 cm-1,430,6,respectively.The waveband was 2681 cm-1to 1853 cm-1,and the M-SEPAvewas 25.7 mg L-1.Modeling was performed using the selected optimal waveband,whose result was much better than using the full spectrum.The comparison of different models is presented in Tab.1.It can be seen that this optimization model was better than the whole region model obviously and reduced the wavenumbers dramatically.

Table1:Comparison of different models
Using pairedt-test method above,57 wavebands with equivalent prediction performance for the optimal waveband were selected based on MWPLS method.These wavebands were sorted by beginning wavenumber,and their positions are shown in Fig.4.In Fig.4,wavebandawas the global optimal waveband (2681 cm-1to 1853 cm-1),wavebandb(1809 cm-1to 1568 cm-1) was the shortest waveband in 57 equivalent wavebands,its number of wavenumbers was 126,which is only 29.3% of ones of optimal waveband.So,model complexity was further reduced greatly.Besides,it is valuable for the design of specialized spectral instruments.

Figure4:Position of 57 equivalent wavebands
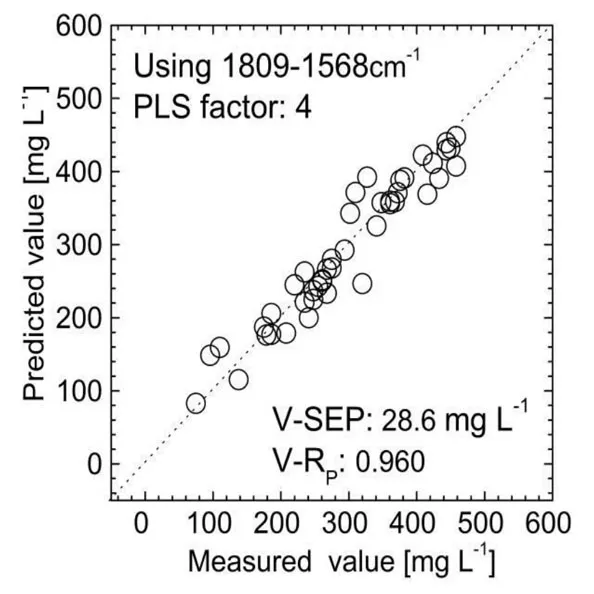
In the band of 1809 cm-1to 1568 cm-1,the PLS model coefficients were calculated according to the chemical values of all samples in the calibration set and the spectral data corresponding to each sample at these wavelength points.And then the calculated coefficients were substituted into the validation set to calculate the chemical values of all the samples in the validation set.The comparison between the predicted value and the real chemical value of the validation set is shown in Fig.5.As a result,it tells us intuitively that there is little difference between the two bands.

Figure5:Comparison of predicted and measured values
4 Conclusions
In the study of using FTIR/ATR spectral technology to analyze the amount of COD in sewage,the selected characteristic bands should not only have a high signal-to-noise ratio to achieve a low prediction error,but also minimize the number of wavelength points.The paired t-test band selection method proposed in this work was compared with the results obtained by MWPLS method.It can be found that the mean square error of the prediction was basically solved,but in comparison,the number of wavelength points was much smaller.It showed that the method proposed in this work is indeed effective.Finally,the method proposed in this work not only had reference value for the design of FTIR/ATR instrument used for the analysis of COD in sewage specially,but also had certain reference significance for the application of spectral technology to the analysis of material composition in other fields.
杂志排行
Computers Materials&Continua的其它文章
- Security and Privacy Frameworks for Access Control Big Data Systems
- A Data Download Method from RSUs Using Fog Computing in Connected Vehicles
- Quantitative Analysis of Crime Incidents in Chicago Using Data Analytics Techniques
- A Deep Collocation Method for the Bending Analysis of Kirchhoff Plate
- Privacy-Preserving Content-Aware Search Based on Two-Level Index
- A Distributed ADMM Approach for Collaborative Regression Learning in Edge Computing
