Quantitative Analysis of Crime Incidents in Chicago Using Data Analytics Techniques
2019-05-10DanielRiveraRuizandAlishaSawant
Daniel Rivera Ruiz and Alisha Sawant
Abstract:In this paper we aim to identify certain social factors that influence,and thus can be used to predict,the occurrence of crimes.The factors under consideration for this analytic are social demographics such as age,sex,poverty,etc.,train ridership,traffic density and the number of business licenses per community area in Chicago,IL.A factor will be considered pertinent if there is high correlation between it and the number of crimes of a particular type in that community area.
Keywords:Analytics,big data,Chicago,correlation,crime.
1 Introduction
This analytic will analyze data of crime incidents in the city of Chicago and try to find patterns that can be useful to characterize these incidents.By combining different data sources,the analytic will extract information that is correlated to the pattern of crime incidents.Traditional sources of information for this kind of analysis will be used,such as demographics and geographical vicinity,but also additional re-sources will be considered to try to find new relationships and valuable insights.
A typical user of this application would be the Police Department of the city of Chicago.The information that will be extracted using this analytic can be very useful to characterize the crime pattern in the city and its evolution with time.If the analytics proves to be useful,similar approaches could be developed for other cities in the US.
In the broadest sense,the main beneficiary of this analytic would be the inhabit-ants of Chicago.If this analytic provides useful insight to reduce crime incidents,all the city would benefit from it.In a more practical sense,it will also benefit the Police Department,since it will help in the decision-making process of taking action to eradicate crime.
The main objective of the analytic is to extract as much valuable information as possible.Examples of the kind of insights that we are aiming to find are the following:Which neighborhoods are more prone to which kinds of crime? Is there a trend over the years for different kinds of crimes? Are demographical factors such as poverty rate,ethnicity,etc.related to crime? What other factors that are not usually considered in this kind of analysis could be related to crime?
The goodness of the analytic can be tested by comparing against previously published results (there are several works that have been published in the past and that are similar to ours).Additionally,we could apply the analytic to historical data for which the outcome is known:if the results of the analytic coincide with the expected output,it means that the results obtained are accurate.
2 Motivation
Crime is an ever-pervasive part of society and while our police forces work tirelessly to reduce the crime rate,there is only so much they can do when working solely off their intuition and training.This is where big data comes in.Crime is rarely random; and there are vast crime archives that can provide insight into the patterns in which crimes are committed.In addition to this,there may be a multitude of factors that affect the crime rate,and the nature of the crime,which are not immediately obvious,but the identification of which could aid the police in the prediction and thus,the prevention of criminal activities.
This analytic can be used to anticipate the occurrence of certain types of crimes within the community areas (here,of Chicago,Illinois) of a city.With this information,the police can increase or decrease the number of policemen on patrol and the patrol frequency in those areas,thus improving the efficiency of the police department.
Another usage of this analytic would be by the residents of the city.For example,a family wishing to move to Chicago could look up the types of crimes committed in that area and what factors influence those crimes.
3 Related work
The paper Crime Rate Inference with Big Data [Wang,Kifer,Graif et al.(2016)] tries to approach the old yet very important problem of crime inference by utilizing urban data that was not always available in previous research:points of interest (POIs) and taxi flows.POI data provide venue information such as GPS coordinates,popularity,and reviews according to different categories such as food,shop,transit,education,etc.Taxi flow data reflect how people commute in the city,so even if two communities are distant in geographical space,they could have a strong correlation if many people frequently travel between them.In the social science literature,the demographics and geographical neighbors are known to exhibit strong correlations with crime.This paper proposes to use POI features to assist the demographic features,and to use taxi flow as hyperlinks to supplement the geographical neighbors.By introducing these new features,they considerably improve the performance of the regression model for crime rate inference.Our project focuses in a very similar problem to the one addressed in this paper.We are trying to find valuable insight as to which factors play an important role when it comes to crime incidents using big data analytics techniques.In addition to having a similar objective to our project,the paper provides some background that will be useful for our work:1) The main source of crime data [Chicago Police Department (2018)] they use is the one available at the City of Chicago data portal:We are planning on using this dataset as well because it is very complete and publicly available on line.It is updated every week,and as of October 28th it contains over 6 million incidents.2) They are introducing additional datasets to explore the correlation between crime rate and social factors such as POIs and taxi flow.This could serve as a baseline for us to try and explore the correlation with other factors,introducing additional data of our own.3) In our project we will not address the problem of crime rate inference,but some of the techniques that they use in this paper will be very useful nonetheless:feature extraction and selection,data normalization,Pearson correlation analysis and feature importance analysis.4) The results obtained in this paper can provide a valuable baseline against which to measure our own results,or to prove/disprove the hypothesis that we state.
In the Crime in Urban Areas [Zhao and Tang (2018)] paper,the authors discuss how crime prediction is typically carried out with respect to demographics of an area but that this is an insufficient predication.In order to make the analysis more sophisticated the paper delves into criminology and the various environments in which crimes occur.The various theories of criminology suggest that crime is directly related to time and location.This prompts a temporal,spatial and spatiotemporal pattern analysis on the data.This analysis reveals the existence of crime hotspots within urban areas and also gives information about the periodicity of crimes along with identifying the possibility of repeat victimization.Crime rate prediction itself can be modeled on different kinds of data such as,crime data,environmental context data and social media data.This information cross-referenced with spatiotemporal pattern analysis can provide insights into crime forecasting which can help with “next-location” prediction.The paper further talks about criminal network analysis using agent based,graph based and geographic information-based analysis.Crime analysis can be used by the police to not only increase patrols but plan efficient patrol routes in high-risk areas.
The Crime Sensing with Big Data [Williams,Burnap and Sloan (2017)] paper focuses on exploring the influence that social media data can have in predicting crime patterns.This task is of great relevance considering that the expansion of social media over the past half a decade has been unprecedented,with estimates of approximately 2.5 billion nonunique users producing hundreds of petabytes of information.Along the lines of other studies,the paper makes the assumption that each Twitter user is a sensor of offline phenomena,creating a wide sensor-net covering ecological zones.Within this network,four types of sensors are identified according to their relationship to the information published:victims,firsthand witnesses,secondhand observers (e.g.,via media reports or the spread of rumor)and perpetrators.Big social data has received little attention amongst criminologists due to the challenges (and affordances) associated with it,which can be summarized as the 6 Vs:volume,variety,velocity,veracity,virtue and value.Furthermore,the attempts that have been made to integrate social media data into statistical models for crime estimation fall short due to the fact that they focus purely on geolocation data and completely dismiss the text of the tweet.Trying to address this issue,the paper explores the correlation of Twitter mentions of broken windows indicators to police-recorded crime rates.Broken windows is a well-known theory in criminology.which in its most basic formulation states that visible signs of neighborhood degeneration are causally linked to crime.The paper’s main findings were the following:1) Estimation models including social media variables increase the amount of crime variance explained compared to models that include offline variables alone.2) Twitter mentions of broken windows indicators are positively associated with police-recorded crime rates in low-crime areas.3)Twitter mentions of broken windows indicators are negatively or not associated with crime rates in high-crime areas.
The Criminal Network Analysis [Pramanik,Zhang,Lau et al.(2016)] paper follows 4 stages:1) The Big data resource,2) Big data tools,3) Analytic procedures and 4)applications.An analysis of social networks can be used to identify previously unseen patterns in criminal networks and organizations.Relational analysis gives an idea about the relationships within and without the networks; while positional analysis describes the structure of the network.The paper follows with discussing the various big data frameworks available for Social Network Analysis.In order to improve the reliability of such studies,multidimensional analytics will need to be integrated into the criminal network analysis.
4 Design and implementation
4.1 Design details
Fig.1 shows the design details of our project.Starting with the datasets described in the following section,the first stage in the pipeline is the data transfer into HDFS through the Globus interface.Following is the cleaning and formatting of the datasets using Hadoop MapReduce.Within this stage the Socrata Open Data API (SODA) [Socrata Open Data API (2018)] was extremely useful:making use of its online querying capabilities,we were able to transform the location data (GPS) available in most of the datasets into the corresponding community areas of Chicago.The third step was to generate Impala tables,so we could access and query the data seamlessly.Once the Impala tables were in place,we use standard SQL queries to generate one correlation table per community area plus a general table for the whole city of Chicago.These tables include the correlation of each factor (demographics,traffic,etc.) to each type of crime.Finally,we transfer the correlation tables to the local file system and generate a general table for all factors,community areas and crime types for which the correlation absolute value is greater or equal than 0.8.Using this table,we generate the visualizations presented in the Results section.

Figure1:Flow diagram of the analytics process
4.2 Description of datasets
1.Crimes-2001 to present [Chicago Police Department (2018)]
This dataset reflects reported incidents of crime (with the exception of murders where data exists for each victim) that occurred in the City of Chicago from 2001 to present,minus the most recent seven days.Data is extracted from the Chicago Police Department’s CLEAR(Citizen Law Enforcement Analysis and Reporting) system.The dataset (as of October 28th,2018) contains over 6.71M rows and 22 columns (1.7 GB approx.)
2.Business licenses [City of Chicago (2018a)]
Business licenses issued by the Department of Business Affairs and Consumer Protection in the City of Chicago from 2002 to the present.The dataset comprises 955K rows and 34 columns and is updated daily (approx.300 MB).
3.Chicago traffic tracker [City of Chicago (2018b)]
This dataset contains the historical estimated congestion for 1270 traffic segments,in selected time periods from August 2011 to May 2018.This dataset has 19.6M rows and 5 columns (approx.640 MB)
4.Census community data [United States Census Bureau (2018)]
This dataset is a combination of multiple datasets of Chicago by community areas,giving information about age,ethnicity and economic demographics.The dataset has information from 2009 to 2016.
5.Train data-‘L’ station entries [Chicago Transit Authority (2018)]
This dataset shows daily totals of ridership,by station entry,for each ‘L’ station da-ting back to 2001.Dataset shows entries at all turnstiles,combined,for each station.It has 910K rows and 5 columns.
5 Results
The main result obtained with this analytic is a set of 78 correlation tables,one per community area in the city of Chicago plus a general table for the whole city.Additionally,a summarizing table including only correlations with an absolute value greater or equal to 0.8 is presented to identify the factors and types of crime that present a stronger relationship.Tab.1 shows a few rows of the 3,650 high-correlation relationships available in the complete summary.
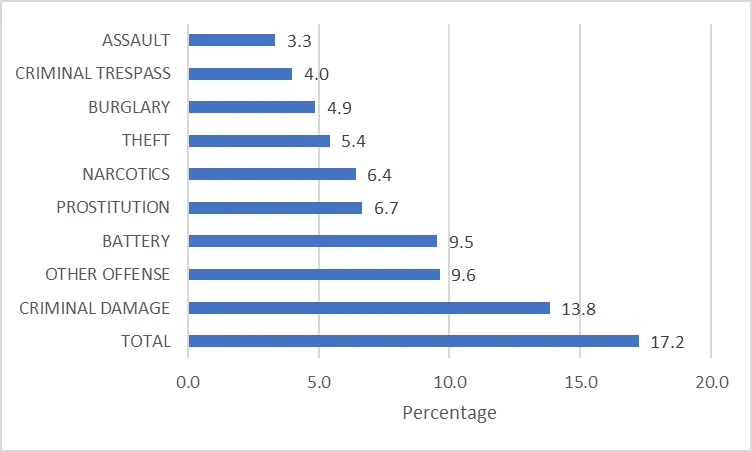
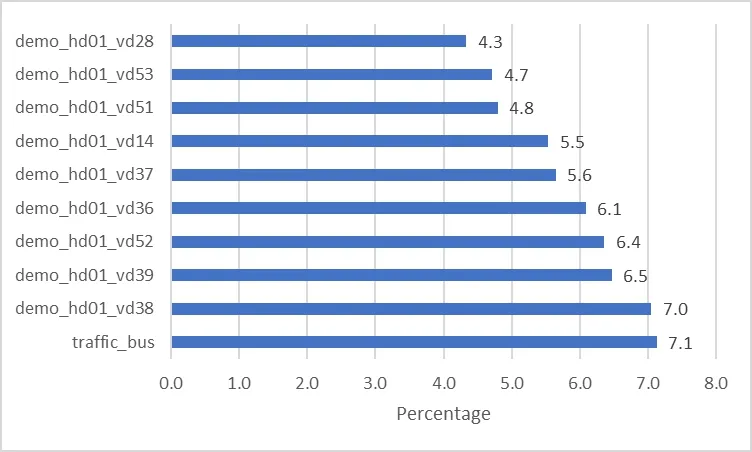
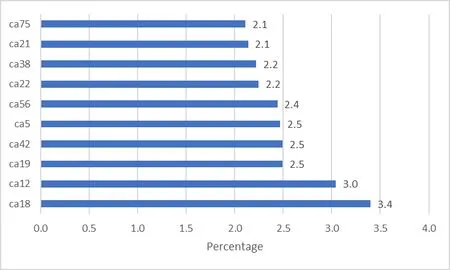
Fig.2,Fig.3 and Fig.4 show plots of the top 10 crime types,factors and community areas,respectively,with their associated percentages out of the 3,650 records.

Figure2:Top 10 crime types by percentage in the high correlation table summary

Figure3:Top 10 factors by percentage in the high correlation table summary

Figure4:Top 10 community areas by percentage in the high correlation table summary

Table1:Examples of the records found in the high correlation summary table Community area=00 means the whole city of Chicago
6 Future work
Crime is definitely influenced by multiple factors in society and these factors may be complex and unsuspected.The key to improving this analytic is to identify more such factors and testing to see how they correlate with criminal activities in various areas.This could be done by a brute force checking of a large number of factors or a more sophisticated selection of parameters perhaps curated by domain experts in criminology.The analytic itself can be applied to any city in the world.
Additionally,performing a deeper analysis including time series to identify not only the correlation between factors and crime types,but also to explore causality relationships.More sophisticated techniques such as feature ranking and selection could be explored to develop a machine learning model that would allow to forecast crime rates and therefore take action accordingly.
7 Conclusions
In this analytic we examined data of crime incidents in the city of Chicago aiming to find patterns that could be useful to characterize them.We combined several data sources including demographics,train ridership,traffic conditions and business li-censes in order to find correlations between these factors and the pattern of crime incidents.
One of the most remarkable findings was the fact that non-traditional factors,such as the number of public transportation buses or the average speed in traffic-congested zones seem to be correlated to certain types of crime in certain community areas.
Additionally,there are a few factors that exhibit a negative correlation (see Tab.1 for a couple of examples).These instances are also interesting because they can provide useful guidelines to take action towards reducing crime incidents in the most affected community areas.
杂志排行
Computers Materials&Continua的其它文章
- Security and Privacy Frameworks for Access Control Big Data Systems
- A Data Download Method from RSUs Using Fog Computing in Connected Vehicles
- A Deep Collocation Method for the Bending Analysis of Kirchhoff Plate
- Privacy-Preserving Content-Aware Search Based on Two-Level Index
- A Distributed ADMM Approach for Collaborative Regression Learning in Edge Computing
- A Noise-Resistant Superpixel Segmentation Algorithm for Hyperspectral Images
