Analysis of passenger boarding time difference between adults and seniors based on smart card data
2019-04-04LeiDaChenXuewuChengLongLuoRonggen
Lei Da Chen Xuewu Cheng Long Luo Ronggen
(School of Transportation, Southeast University, Nanjing 210096, China)
Abstract:As an essential component of bus dwelling time, passenger boarding time has a significant impact on bus running reliability and service quality. In order to understand the passengers’ boarding process and mitigate passenger boarding time, a regression analysis framework is proposed to capture the difference and influential factors of boarding time for adult and elderly passengers based on smart card data from Changzhou. Boarding gap, the time difference between two consecutive smart card tapping records, is calculated to approximate passenger boarding time. Analysis of variance is applied to identify whether the difference in boarding time between adults and seniors is statistically significant. The multivariate regression modeling approach is implemented to analyze the influences of passenger types, marginal effects of each additional boarding passenger and bus floor types on the total boarding time at each stop. Results show that a constant difference exists in boarding time between adults and seniors even without considering the specific bus characteristics. The average passenger boarding time decreases when the number of passenger increases. The existence of two entrance steps delays the boarding process, especially for elderly passengers.
Key words:elderly passengers; smart card data; boarding time differences; analysis of variance; regression analysis; marginal effect
Public transit has been regarded as an essential solution to the increasing challenges of urban traffic congestion, especially in some developing countries like China. Governments and public transit agencies have taken several measures to make the public bus services more attractive to citizens.
Among them, one measure for attracting more passengers to take buses is to ensure bus service reliability, and another critical measure is to promote accessibility for some special passenger groups like seniors. The dwelling time accounts for a substantial proportion of bus travel time, and thus it has a significant effect on service reliability. Besides, it is clear that the dwelling time is mainly spent in allowing passengers to get on and off the bus. Movements in the whole process of taking a bus, especially the boarding movement, reflect the accessibility to bus service for each type of passengers. Hence, a critical issue is to study the passenger boarding movement.
Previous studies mainly focused on investigating and analyzing the determinants of bus dwelling time using field survey data on a macro level, whereas the microscopic characteristics of bus passengers in the boarding or alighting process receive little attention[1-3]. Furth[4]found that higher variability of dwelling time might increase the risk of bus service unreliability. Based on the manually collected data, Tirachini[5]identified the effects of different factors, including the type of bus floor, the age of passengers as well as the type of fare collection system. Furthermore, by using the archived bus dispatch system data, Bertini and El-Geneidy[6]found that the dwelling time per passenger was not necessarily related to the total number of passengers. Shalaby et al.[7]proposed a bus travel time prediction model and discovered that the boarding passengers had a more significant influence than the alighting ones on dwelling time. Li et al.[8]developed a simulation model to estimate the bus dwell time, and similarly, Gonzlez et al.[9]established a bus dwelling time estimation model which considered the influence of occasional incidents. Then the emergence of smart card technology provided a new and more efficient way for researchers to model the bus dwelling time and analyze the relationship between dwelling time and the boarding/alighting process. Using the smart card data, Widanapathiranage et al.[10]presented a model of busway station dwelling time, while Sun et al.[11]used the smart card data for the first time to study the bus boarding and alighting dynamics by measuring the interval between two successive boarding/alighting passengers. Before their study, the average dwelling time per passenger was treated as a constant. However, they did not explore the distinct boarding/alighting characteristics of passengers at different ages. Moreover, Zhao et al.[12]introduced the index of rank to identify how passenger boarding/alighting time changed in a dynamic process.
Although some researchers applied the smart card data to the study of passenger boarding/alighting behavior, few of them took ages into account in their articles. However, this attribute of passengers plays a vital role in determining passenger movement time since different types of passengers may spend different amounts of time when boarding or alighting a bus.
In China, most of the smart card systems only have passenger boarding records. Given this limilation, our study focuses on the microscopic analysis of the passenger boarding process. There are two objectives in this study: the first one is to identify the difference of the boarding time between adults and seniors, and the second one is to investigate the effect of various factors on passenger boarding time.
1 Data Collection and Preprocessing
1.1 The smart card system in Changzhou
Changzhou is a prefecture-level city in southern Jiangsu province of China, bordering the provincial area of Nanjing to the west and Zhejiang province to the south. As a part of China’s highly developed Yangtze Delta region, Changzhou now covers an area of 4 385 square kilometers, with a total population of 4.7 million in its five urban districts and one satellite city. There is no metro service in Changzhou now. However, over 260 bus lines have formed an effective bus system, and bus trips account for 12.2% of daily trips for all citizens in Changzhou[13].
The smart card automatic fare collection (AFC) system was introduced in Changzhou in October 2001, which aims to decrease cash transactions. Passengers only need to tap their smart cards at the front door when boarding and all the buses have only one card reader at the front door. Besides, bus lines in Changzhou charge the same price, which is not distance-based. Either cash or smart cards can make the payment, but smart card users can enjoy a fare discount from 40% to 70%. Moreover, seniors over 70 years old can enjoy the bus services for free. It was reported that more than 75% of public transportation passengers in Changzhou used the smart card for payment in 2015. This proportion reached 95% in some of the bus lines. When a passenger is tapping on from a bus, the detailed transaction information is recorded, including time, bus ID, bus lines ID, smart card ID, the type of smart card and other operational data.
It should be noted that the transit system in Changzhou has an independent AFC system and the automatic vehicle location (AVL) system, which means that we cannot directly obtain the location of each boarding transaction. Hence, identifying the boarding location of each record is a significant issue for further studies in this research. Different from some other smart card systems in the world with complete information about boarding and alighting, the system in Changzhou, like most cities in China, can only provide boarding records. Besides, there is no automatic passenger counter (APC) system in Changzhou, which means that we cannot obtain the number of onboard passengers for each moving bus. Note that passengers are restricted to boarding at the front door and alighting at the rear door.
1.2 Data collection
This study contains one-week anonymous smart card data from March, 16th to 22nd, 2015 in Changzhou. We collected more than 4×10⁵smart card transaction records from six bus lines with a high proportion of elderly passengers and a high rate (around 90%) of those making payments by smart card. The reasons why we choose smart card data from six bus lines are as follows: Firstly, all these bus lines have a relatively high proportion of elderly passengers (over 20%). Secondly, a cash payment made by passengers can create a large time interval, in that case, we cannot apply the recorded time from consecutive smart card data to calculate the boarding gaps and use it to approximate passenger boarding time. Therefore, it is necessary to select data from a dataset which has few cash transactions.
It is acknowledged that there are more than five types of cards used in the transit system. However, students, the disabled and other types of passengers make up only an extremly small proportion of the total number of passengers, which are ignored in the analysis. This research only focuses on analysis and modeling of adult and elderly passengers.
Tab.1 shows the characteristics description of the operating buses. The contents include more than 20 fields of information, but only six fields are used in this study as listed in the table, including bus line ID, vehicle name, entrance type, length and number of doors. In Changzhou, most of the bus lines only have one type of vehicle.
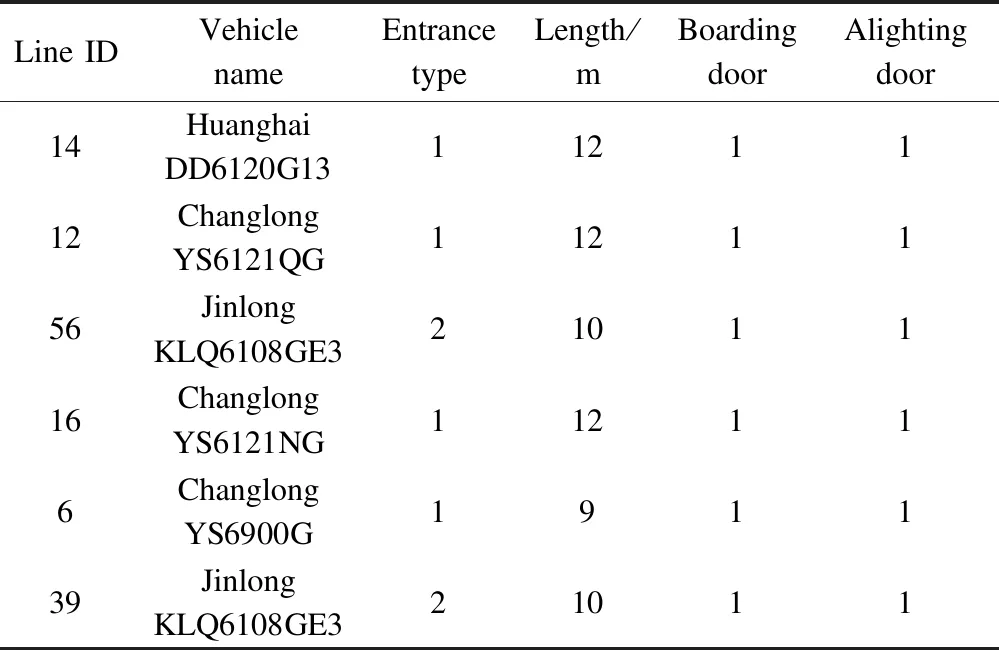
Tab.1 Bus characteristics description
Tab.2 presents the description of the smart card data structure. In our research, only four recorded fields are used to analyze passenger boarding behavior: Card type, tapping time, bus ID and bus line ID.
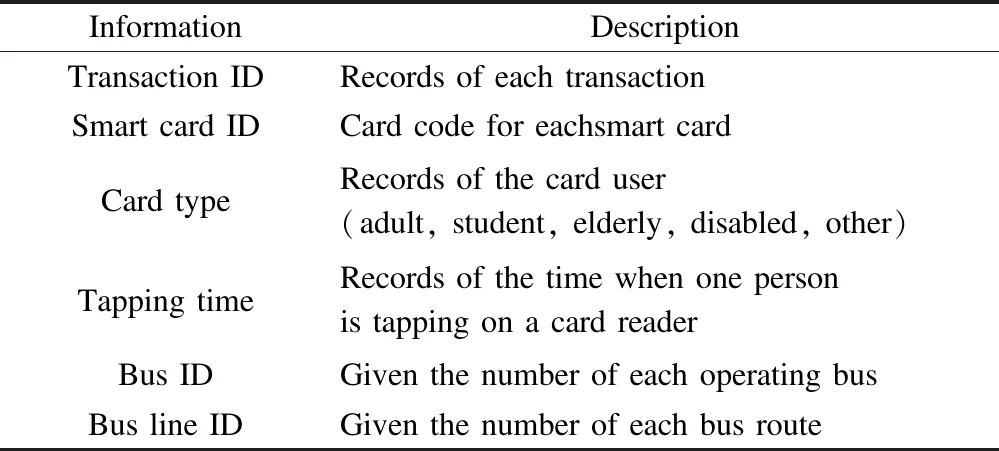
Tab.2 Smart card data structure description
Due to the requirement of identifying passenger boarding location, GPS data are also obtained from the AVL system. Tab.3 shows the detailed contents of GPS data.
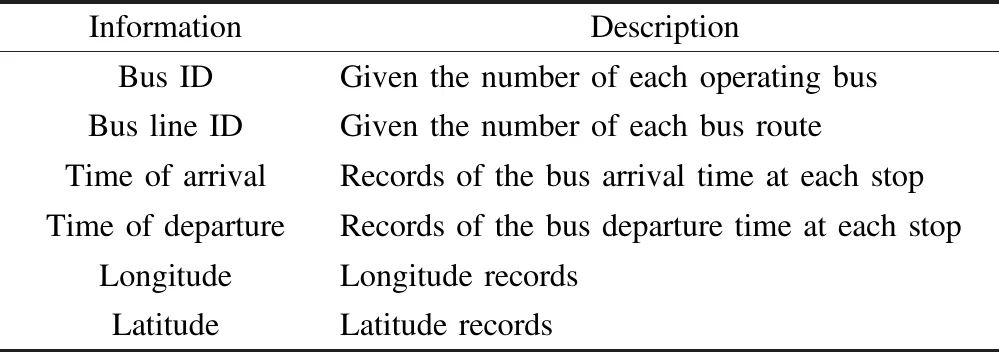
Tab.3 GPS data structure information
1.3 Data preprocessing
Data preprocessing is required before passenger boarding behavior analysis and modeling. The first step in data preprocessing is to determine the bus stop where the smart card users board. By linking the bus ID and bus line ID, we can narrow down the possibilities of the boarding location. Then, if we find that the tapping time in the smart card data is between the arrival time and departure time of one bus, we find the accurate boarding stop for this smart card record. The next step is to compute the boarding gap between two successive boarding records of two passengers. The computed boarding gap is the approximated boarding time for the latter passenger. In this way, we should notice that the boarding gap of the first passenger at each stop cannot be calculated, so the number of recorded activities is one fewer than the actual number of the boarding passengers. Since the smallest unit of the bus boarding gap is a second, the minimum gap is 1 s. Also, we will only use the terminology “boarding gap” to stand for the time that one passenger spends in boarding a bus in the rest of this research in order to avoid confusion. Fig.1 shows a complete process of computing passenger gaps.
Some extreme large gaps are defined as outliers in this study. These outliers are mainly caused by the following factors: 1) Passengers making payments by cash (Approximately 10% of payments in the records are made by cash); 2) The passenger taking his card out after boarding; 3) Bus drivers waiting for the late-coming passengers. The clustering-based method is implemented to detect and clear the outliers.
Visual C#program language and structured query language (SQL) are applied to accomplish the processes above.
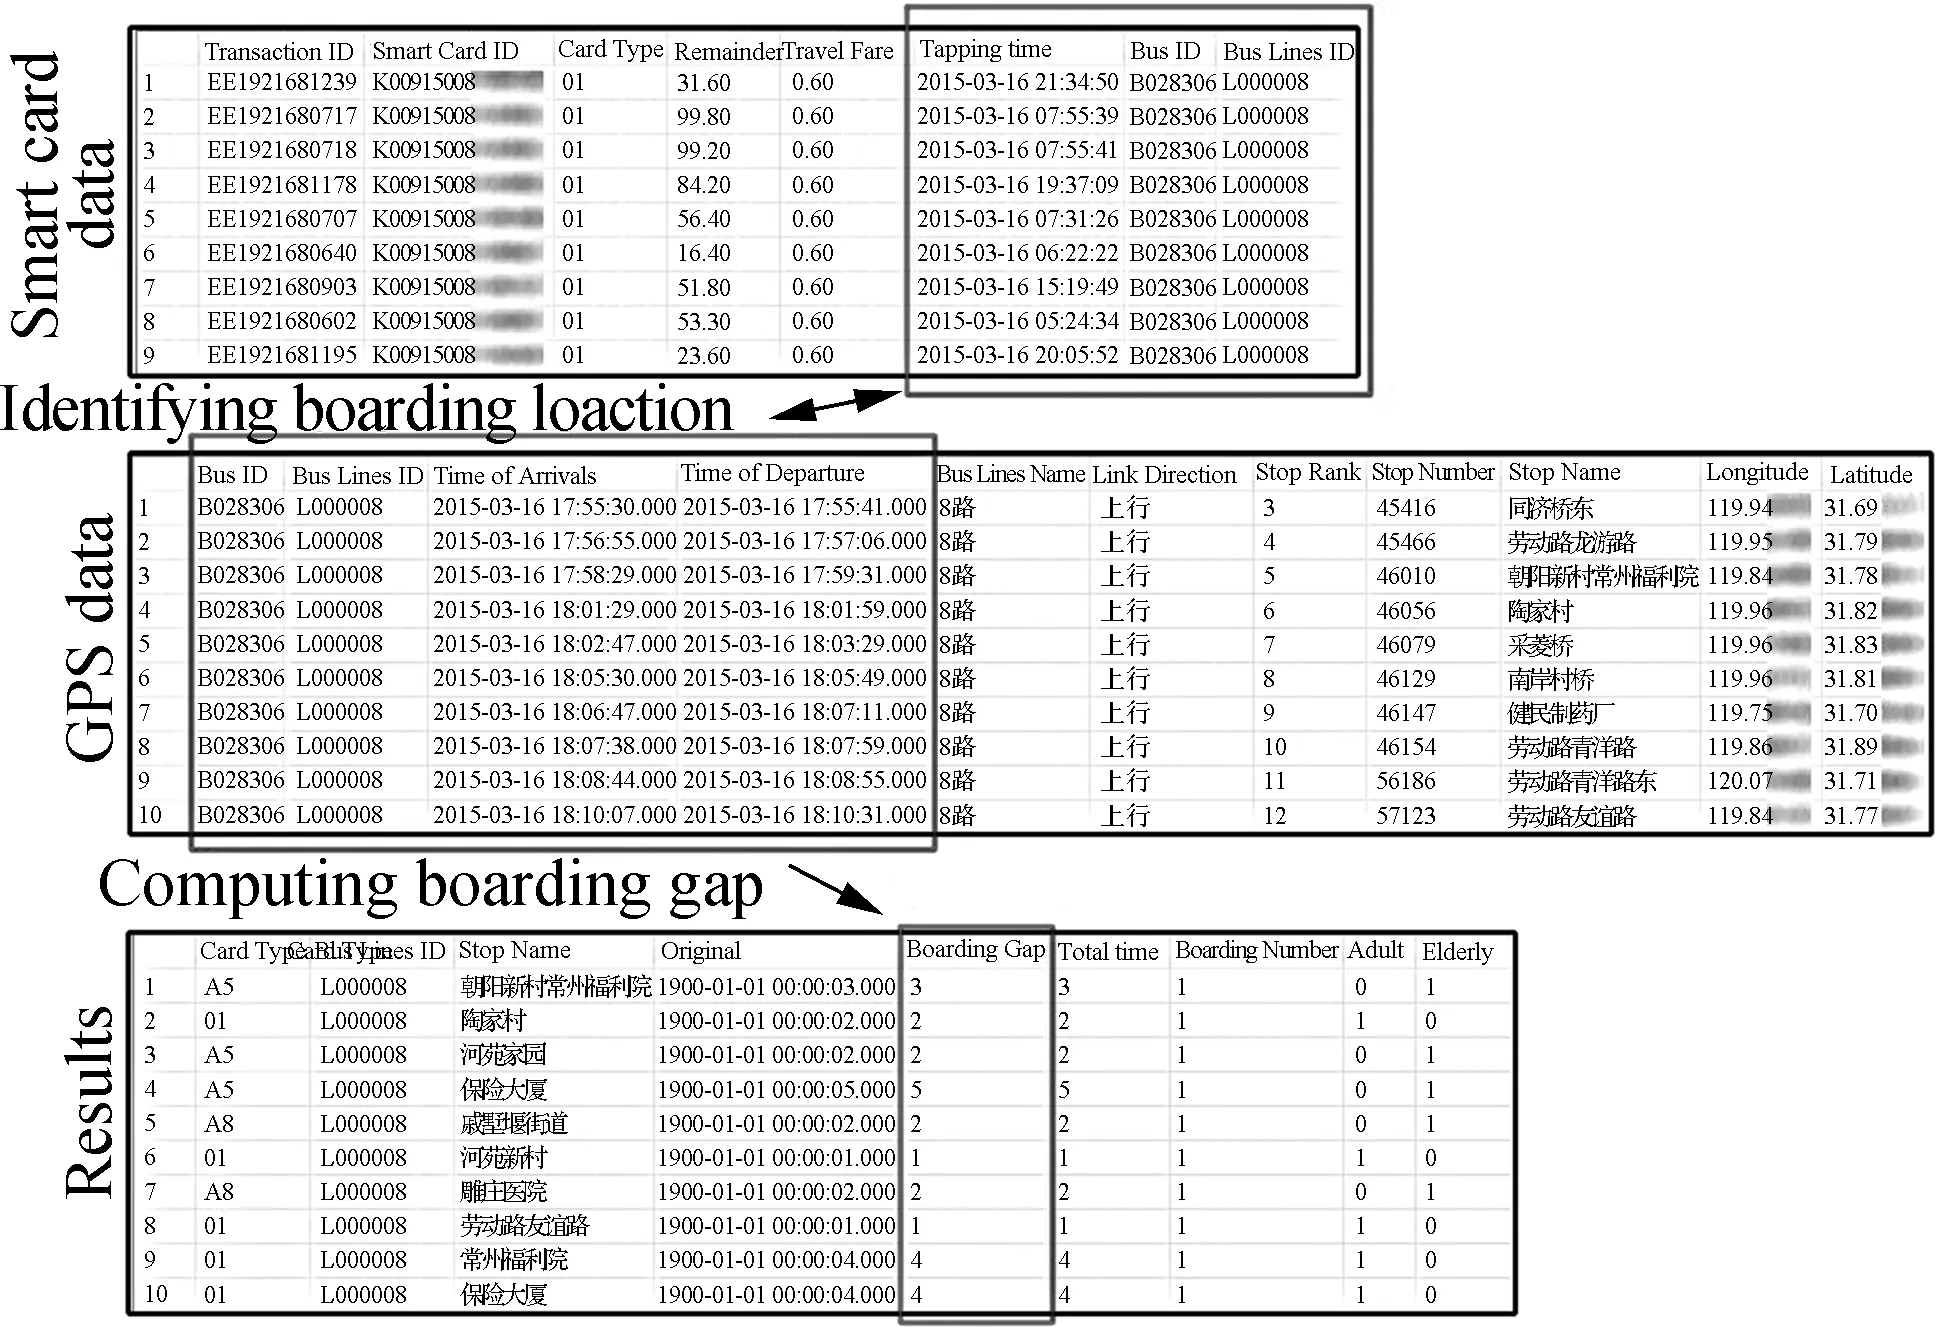
Fig.1 Process of computing boarding gaps
2 Analysis and Methodology
2.1 Descriptive analysis
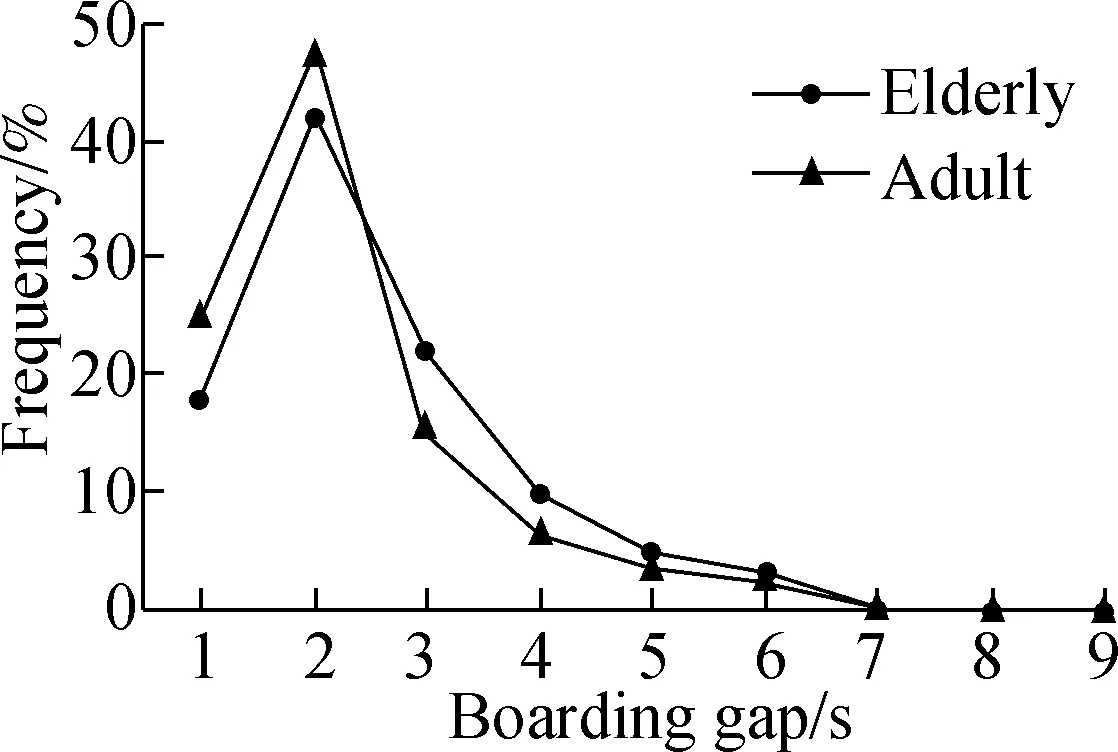
The critical issue of this study is to figure out if there is a statistically significant difference in the boarding gap between adult passengers and elderly passengers. Thus, we calculate the statistics of boarding gap for adult passengers and elderly passengers. The percentages of the boarding gap for both types of passengers are computed by dividing the total number of boarding records for one type of passenger by the number of different boarding gaps. The line charts in Fig.2 show the percentages of boarding gaps for both adult and elderly passengers. The scale of the vertical axis reflects the value of the frequency distribution. The scale of the horizontal axis indicates time durations of different boarding gaps. As can be seen in Fig.2, elderly passengers are likely to spend more time when boarding a bus.
Descriptive statistics (see Tab.4) demonstrate that the average boarding gap of elderly passengers is higher than that of adult passengers. Then, we conduct a one-way analysis of variance (ANOVA) to further check the difference in their average boarding gaps by examining the variances of samples.
2.2 Analysis of variance
Analysis of variance is a hypothesis-testing technique used to analyze the differences among means. In this study, ANOVA allows us to determine whether there are systematic treatment effects that cause the mean in one group to differ from the mean in another. Note that using ANOVA to compare the means from two independent samples is equivalent to using at-test to make this comparison. However, ANOVA seems to be more suitable for this research due to its conservativeness[14]. The results of ANOVA are presented in Tab.5.
From these results,we can demonstrate that the difference in boarding gap between these two types of passengers reaches a significant level. Thus, we should take into account this difference in the following study.

(a)
(d)

Tab.4 Statistics of passenger boarding gap

Tab.5 ANOVA for adult and elderly passengers
2.3 Regression analysis

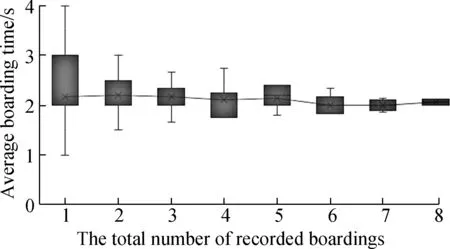
Fig.3 Trend of average boarding gap against the volume of boarding passengers

Also,we include one dummy variableD, which is active to be one if one bus has a two-step entrance; otherwiseDequals zero, representing a low floor entrance. One can expect that setting a two-step entrance in a bus increases passenger boarding gaps. Using a nonlinear regression model, we can measure the average cost of each adult passenger boardinggaand elderly passenger boardingge:
(1)

Tab.6 Results of regression analysis

3 Conclusion
In this paper, regression analysis is conducted using data from the automatic fare collection system in Changzhou, with the objective of quantifying the boarding gap and difference between adult and elderly passengers and analyzing the influence of the specific determinants of total boarding time at each bus stop, such as age and steps inside buses. The results of ANOVA demonstrate that there is a statistically significant difference between adults and seniors in the time spent on boarding a bus. In regression analysis, the model is estimated to account for the total time for a queue of passengers to boarding. We find that there are some negative marginal effects on both adults and seniors, indicating that a high demand for taking a bus speeds up the boarding process of a queue of passengers waiting at a bus stop by decreasing the average passenger boarding time. Moreover, this effect is greater on seniors than adults. From an operational aspect, this marginal effect brings extra variability in the boarding process and then this is expected to have an impact on bus service reliability. Besides, the existence of a two-step entrance is found to make the boarding process slower, which is an expected outcome. This negative impact is more significant in seniors than adults. Although the total boarding time cannot adequately represent bus dwelling time, it can be seen as an essential component of the time spent on transferring passengers. Some policy recommendations might be proposed based on the results of our study. Seniors usually spend more time boarding a bus and bring more variability to the dynamic boarding process. Thus, it might be a cost-effective way for bus agencies to provide customized bus services for the elderly, using low-floor buses with optimal capacity, to improve the efficiency of the whole transit system.
AcknowledgmentsThe authors appreciate Changzhou Public Transportation Group Corporation for providing the data used in this study.
杂志排行
Journal of Southeast University(English Edition)的其它文章
- A fatigue damage model for asphalt mixtures under controlled-stress and controlled-strain modes
- Effect of flexural loading on degradation progress of recycledaggregate concrete subjected to sulfate attack and wetting-drying cycles
- Improved adaptive filter and its application in acoustic emission signals
- GA-1DLCNN method and its application in bearing fault diagnosis
- Multi-relaxation-time lattice Boltzmann simulation of slide damping in micro-scale shear-driven rarefied gas flow
- Effect of contract choice on upstream carbon emission reduction considering carbon taxation
