Dynamic changes of key metabolites during liver fibrosis in rats
2019-03-09JiongYuJianQinHeDeYingChenQiaoLingPanJinFengYangHongCuiCaoLanJuanLi
Jiong Yu, Jian-Qin He, De-Ying Chen, Qiao-Ling Pan, Jin-Feng Yang, Hong-Cui Cao, Lan-Juan Li
Abstract BACKGROUND Fibrosis is the single most important predictor of significant morbidity and mortality in patients with chronic liver disease. Established non-invasive tests for monitoring fibrosis are lacking, and new biomarkers of liver fibrosis and function are needed.AIM To depict the process of liver fibrosis and look for novel biomarkers for diagnosis and monitoring fibrosis progression.METHODS CCl4 was used to establish the rat liver fibrosis model. Liver fibrosis process was measured by liver chemical tests, liver histopathology, and Masson’s trichrome staining. The expression levels of two fibrotic markers including α-smooth muscle actin and transforming growth factor β1 were assessed using immunohistochemistry and real-time polymerase chain reaction. Dynamic changes in metabolic profiles and biomarker concentrations in rat serum during liver fibrosis progression were investigated using ultra-performance liquid chromatography coupled to quadrupole time-of-flight mass spectrometry. The discriminatory capability of potential biomarkers was evaluated by receiver operating characteristic (ROC) curve analysis.RESULTS To investigate the dynamic changes of metabolites during the process of liver fibrosis, sera from control and fibrosis model rats based on pathological results were analyzed at five different time points. We investigated the association of liver fibrosis with 21 metabolites including hydroxyethyl glycine, L-threonine,indoleacrylic acid, β-muricholic acid (β-MCA), cervonoyl ethanolamide (CEA),phosphatidylcholines, and lysophosphatidylcholines. Two metabolites, CEA and β-MCA, differed significantly in the fibrosis model rats compared to controls (P <0.05) and showed prognostic value for fibrosis. ROC curve analyses performed to calculate the area under the curve (AUC) revealed that CEA and β-MCA differed significantly in the fibrosis group compared to controls with AUC values exceeding 0.8, and can clearly differentiate early stage from late stage fibrosis or cirrhosis.CONCLUSION This study identified two novel biomarkers of fibrosis, CEA and β-MCA, which were effective for diagnosing fibrosis in an animal model.
Key words: Ultra-performance liquid chromatography-mass spectrometry; Metabonomics;Liver fibrosis; Biomarker; Cervonoyl ethanolamide; β-muricholic acid
INTRODUCTION
Liver fibrosis is a common pathological process of all chronic liver diseases, which can be caused by a number of factors, including long-term alcohol abuse, viral infection,fatty liver disease, metabolic disease, and cholestasis[1,2]. The mechanisms of liver fibrosis and cirrhosis are considered similar; fibrosis occurs via a non-specific mechanism involving excessive accumulation of extracellular matrix proteins,including collagen. This accumulation causes hepatic stellate cell activation, which persists as long as there is liver injury in most cases of chronic liver disease[3].
Liver fibrosis can be divided into four stages (0-4): Stages 0 and 1 represent normal liver; stage 2 is mild fibrosis; stages 3 and 4 indicate severe and advanced liver fibrosis that results in cirrhosis. Importantly, liver fibrosis can be reversible at any stage prior to the development of liver cirrhosis[4]. Therefore, in chronic liver disease, fibrosis level is the most important predictor of significant morbidity and mortality.Assessments of liver injury are currently based on clinical symptoms and biopsies of the liver. Alanine aminotransferase (ALT) is a simple and inexpensive surrogate marker for liver disease; however, significant fibrosis may still be present in some patients who had normal ALT levels, and there is no better index than ALT level to predict advanced fibrosis[5,6]. The gold standard for assessing liver fibrosis is still liver biopsy. Currently, magnetic resonance imaging (MRI)- and ultrasound-based elastography is widely used to assess hepatic steatosis and fibrosis. However, in the early stages of fibrosis, these techniques lack sensitivity and specificity, and cannot be used to determine inflammation and cell damage[7]. Thus, there is a need for novel liquid biomarkers, which, in combination with fibroscan and MRI, might provide significant advances in diagnosis and monitoring fibrosis progression. Metabonomics,an effective and noninvasive diagnostic method that provides quantitative measurements of metabolite changes in biofluids, is a powerful tool for biomarker discovery and helpful for understanding the pathophysiology of a disease[8-11]. In recent years, most metabolomic studies have compared only two groups, as the results are easy to interpret. However, the natural course of disease and treatment processes vary widely, and few studies have focused on the dynamic processes of metabolic profiles and biomarkers.
In this study, we investigated biomarker concentrations and dynamic changes in metabolic profiles during liver fibrosis progression using ultra-performance liquid chromatography coupled to quadrupole time-of-flight mass spectrometry (UPLC/QTOF-MS). The objective of this study was to investigate the potential utility of metabonomic biomarkers for the early diagnosis of liver fibrosis and function.
MATERIALS AND METHODS
Animal model of liver fibrosis
A total of 100 6-week-old Sprague-Dawley rats, weighing 180-200 g, were obtained from the Experimental Animal Center of Zhejiang Academy of Medical Sciences,which were housed under a 12-h daylight/darkness cycle and in an air-conditioned animal room with 50% humidity. All experimental procedures were conducted according to protocols approved by the Research Ethics Committee of the First Affiliated Hospital, School of Medicine, Zhejiang University (No. 201543). The animals were randomly divided into five groups (n = 20 each). To induce liver fibrosis, rats were injected subcutaneously with CCl4(Sigma-Aldrich, St. Louis, MO,United States) in olive oil (v/v, 50%, Sigma-Aldrich) at a dose of 0.5 mL per 100 g of body weight, twice weekly for 12 wk. The rats in the control group were administered oil using the same injection procedure. The rats were sacrificed at weeks 1, 4, 8, and 12 to collect blood samples and liver tissues.
Pathological observation
The liver tissues were rapidly isolated and immersed into 4% (w/v) paraformaldehyde, embedded in paraffin, deparaffinized, and rehydrated with distilled water. The liver sections were stained with hematoxylin and eosin (HE) using a routine protocol,and with Masson’s trichrome (MTC) using an MTC staining kit (Sigma-Aldrich)according to the manufacturer’s instructions. The injury score of fibrosis was graded as described by Ishak[12]; ten representative views of each histological section from every rat were randomly selected and all rat models were scored.
Chemical analysis
Blood samples were collected via the caudal vein and placed into 1.5 mL centrifuge tubes. According to pathological results, serum samples were selected for MS and biochemical detection. The samples were centrifuged at 4 °C at 3000 rpm for about 15 min after incubation at room temperature for 30 min. Then, the serum samples were sent to the central clinical laboratory of the First Affiliated Hospital for total protein(TP), albumin (ALB), globulin (GLO), alkaline phosphatase (AKP), ALT, aspartate aminotransferase (AST), bile acid (BA), total bilirubin (TBIL), and creatinine (CR)concentration assays. The remaining serum was stored at - 80 °C for metabonomic analyses.
Liver immunohistochemistry
For immunohistochemistry, the paraffin sections were incubated at 4 °C overnight with primary antibodies against rat α-smooth muscle actin (α-SMA, 1:400; Abcam,United Kingdom) and rat transforming growth factor-β1 (TGF-β1, 1:500; Abcam,United Kingdom). Next day, the sections were washed with phosphate buffered saline (GenomSciences, Hangzhou, Zhejiang Province, China) three times and then incubated at 37 °C for 60 min with horseradish peroxidase-conjugated secondary antibody (1:1000; Abcam). Then, the sections were incubated with diaminobenzidine tetrahydrochloride solution (DAB kit, Abcam) for 10min, washed with distilled water,and counterstained with hematoxylin at room temperature. Finally, liver sections were sealed with neutral resin and examined microscopically.
Reverse transcription-polymerase chain reaction (PCR) and quantitative real-time PCR
Total RNA from each liver sample was extracted with Trizol reagent (Invitrogen,United States), and cDNA was synthesized using QuantiTect Reverse Transcription Kit [TAKARA Biotechnology (Dalian) Co., Ltd, Dalian, Liaoning Province, China],according to the manufacturer’s instructions. The primers used were: 5‘-CGA TAG AAC ACG GCA TCA TCA C-3’ (forward) and 5’-GCA TAG CCC TCA TAG ATA GGC A-3’ (reverse) for α-SMA; and 5’-CCT GGA AAG GGC TCA ACA C-3’ (forward)and 5’-CAG TTC TTC TCT GTG GAG CTG A-3’ (reverse) for TGF-β1. Quantitative real-time PCR was used to assess the mRNA levels of TGF-β1 and α-SMA [QuantiTect SYBR Green RT-PCR kit, TAKARA Biotechnology (Dalian) Co., Ltd.] on the 7500 Real Time System (Life Technologies, Carlsbad, California, United States). All PCR products were normalized to expression levels of β-actin used as an internal standard[13].
Sample preparation and UPLC/Q-TOF-MS analysis
A total of 100 μL of each sample was mixed vigorously with 300 μL of precooled acetonitrile after the serum samples were thawed at 4 °C, followed by centrifugation at 14000 rpm at 4 °C for 10 min. Then, the supernatants were transferred to specific glass tubes for UPLC-MS analyses. To condition the column, quality control samples(10 μL of supernatants) were obtained from each sample and tested five times before the analysis, and after every eight samples throughout the procedure.
Analytical conditions of UPLC-MS
The Acquity UPLC system (Waters, Milford, MA, United States) was used for chromatographic separations, which was equipped with an Acquity UPLC BEH C18 analytical column (I.D. 2.1 mm × 100 mm, particle size 1.7 μm, pore size 130 Å). MS detection was performed with a mass spectrometer, which was equipped with an electrospray ionization source, using the negative ion electrospray mode. The nitrogen drying gas was set at a velocity of 600 L/h, and the temperatures of source and desolvation were 120 °C and 350 °C, respectively. The cone gas velocity was 50 L/h. The sampling cone voltage was set at 40.0 and the capillary voltage at 3.0 kV; the collision gas was argon, and the collision energy was set at 5.0 eV. According to the stability of the individual metabolites, tandem MS (MS/MS) analyses were performed with the mass spectrometer set at various collision energies, ranging from 30 to 80 eV.
Biomarker selection and identification
The raw UPLC–MS data files were normalized with MassLynx v4.1 software (Waters).The final peak ratio file, containing retention time, m/z, and signal intensity of the peaks, was analyzed with SIMCA-P+ 13.0 software (Umetrics, Umeå, Sweden).Principal component analysis (PCA) and orthogonal partial least squares discriminant analysis (OPLS-DA) were combined to analyze the data. The biomarkers were identified based on m/z, retention time, and typical MS/MS fragment and pattern.According to the variance analyses and variable importance in the projection (VIP) of the metabolites, the candidate biomarkers were selected. To identify potential biomarkers, the HMDB database (http://hmdb.ca/) and PubChem compound database (http://www.ncbi.nlm.nih.gov) were searched. The final determination of biomarkers was confirmed by comparison with corresponding standards. Metabolite set enrichment and pathway analyses were based on MetaboAnalyst (www.metaboanalyst.ca).
Statistical analyses of biomarkers
The diagnostic value of the selected biomarkers was analyzed using discriminant analyses and compared to blood biochemical parameters. The discriminant analyses relied on Fisher’s functional coefficient and stepwise statistical analyses. To evaluate the discriminatory capability of potential biomarkers, we used receiver operating characteristic (ROC) curves. All statistical analyses were conducted with SPSS 19.0 software (SPSS, Inc., Chicago, IL, United States), and P < 0.05 was considered to indicate statistical significance.
RESULTS
Dynamic changes in blood biochemistry
Blood biochemical parameters, including TP, ALB, GLO, AKP, ALT, AST, BA, TBIL,and CR, were measured during the fibrosis process to examine liver function (Figure 1). Serum levels of ALB, TP, and GLO showed a gradual decrease. ALT and AST levels showed a significant increase at week 1. AKP, total BA (TBA), and TBIL levels increased significantly over time (P < 0.05); CR levels showed no obvious trend.
Morphological changes in the liver
Liver tissues were collected from each group at five time points and subjected to histological examination using HE and MTC staining. Liver tissues from the fibrosis model groups showed a series of severe morphological changes, including inflammation, fatty metamorphosis, and necrosis compared to the normal lobes of the control group. The fibrosis model livers showed fatty metamorphoses, sinusoid congestion, and hemorrhage at week 1. At week 4, the livers showed fibroblasts between the portal area and the interlobular area, and further bubble-like degeneration and necrosis. Increased numbers of fibroblasts and hepatic lobe reconstruction were observed from weeks 8 to 12 (Figure 2A-E). The injury score of fibrosis increased gradually compared to the control group (P < 0.05) (Figure 2F).MTC staining at weeks 4 to 12 revealed increasing levels of collagen deposition and fibrosis accumulation (Figure 2G-K).

Figure 1 Dynamic changes in serum biochemical parameters during the process of fibrosis. A: Albumin, total protein, and globulin; B: Alanine aminotransferase, aspartate aminotransferase, and alkaline phosphatase; C: Bile acid, total bilirubin, and creatinine. ALB: Albumin; TP: Total protein; GLO: Globulin;ALT: Alanine aminotransferase; AST: Aspartate aminotransferase; AKP: Alkaline phosphatase; BA: Bile acid; TBIL: Total bilirubin; CR: Creatinine.
Hepatic stellate cell activation markers during the fibrosis process
As shown in Figure 3, immunohistochemical staining analysis indicated that the marker of hepatic stellate cell activation α-SMA and hepatic expression of the profibrogenic marker TGF-β1 showed more and more brown staining over time and reached the most brown at week 12. These results were further confirmed by the mRNA expression of α-SMA and TGF-β1, as shown in Figure 3F and L, respectively.
Metabolic profile shift during the fibrosis process
The metabolic profiles in the serum samples were acquired using UPLC/Q-TOF-MS.Trajectory analyses of the PCA score plots for liver fibrosis at various time points revealed distinct clustering of the groups. The serum parameters (R2 Y = 0.77, Q2 =0.657) used for fibrosis classification showed good predictive ability, and several serum metabolites demonstrated time-dependent changes in the various stages of liver fibrosis (Figure 4A). OPLS-DA was used to further characterize the metabolic profiles in various stages of liver fibrosis. The control and liver fibrosis model groups showed complete separation in the OPLS-DA score plots (Figure 4B). The cumulative values of R2X, R2Y, and Q2Y in the OPLS-DA model were 0.756, 0.942, and 0.819,respectively. Hierarchical clustering and heat maps were used to investigate the metabolites detected in the five groups. The normalized intensity of each metabolite was assessed, and metabolite peaks with similar intensities were clustered together.The color distribution showed more dark red color at week 1 and week 12, with dark red representing higher intensity and dark green representing lower intensity (Figure 4C). To document the metabolite changes during 12 wk of liver fibrosis, volcano plots were constructed with thresholds of ≥ 2-fold change and P ≤ 0.05 (red dots). The metabolites showed the greatest differences at week 1 and week 12 in the fibrosis group compared to the control group (Figure 4D-G).
Metabolite quantification and identification
Based on the VIP values (VIP > 1) using the OPLS-DA models, we identified 21 metabolites that were associated with the CCl4-induced metabolic changes in the liver fibrosis model rats. These metabolites included hydroxyethyl glycine, L-threonine,indoleacrylic acid (IAA), β-muricholic acid (β-MCA), cervonoyl ethanolamide (CEA),phosphatidylcholines (PCs), and lysophosphatidylcholines (LPCs) (Table 1). To evaluate the diagnostic value, discriminant analyses were conducted in the five different groups based on selected metabolic profiles; the results showed correct classification of 96.0% of the originally grouped cases and 90.0% of the cross-validated grouped cases. Discrimination based on metabolic profiles was superior to that based on biochemical parameters, which showed correct classification of 78.0% of the originally grouped cases and 74.0% of the cross-validated grouped cases (Figure 5A and B). Correlation analyses showed a good correlation between the identified metabolites (Figure 5C). In order to further explore the impact of these selected metabolites, MetaboAnalyst 3.0 software (Metabolomics Pathway Analysis) was used to analyze the 21 positively identified metabolites to identify possible biochemical pathways during liver fibrosis. The metabolic pathways that were significantly altered by liver fibrosis included linoleic acid metabolism, glycerophospholipid metabolism,alpha-linolenic acid metabolism, glycine, serine and threonine metabolism,arachidonic acid metabolism, tryptophan metabolism, and aminoacyl-tRNA biosynthesis (Figure 5D). Table 2 summarizes the results of the metabolic pathway analyses.
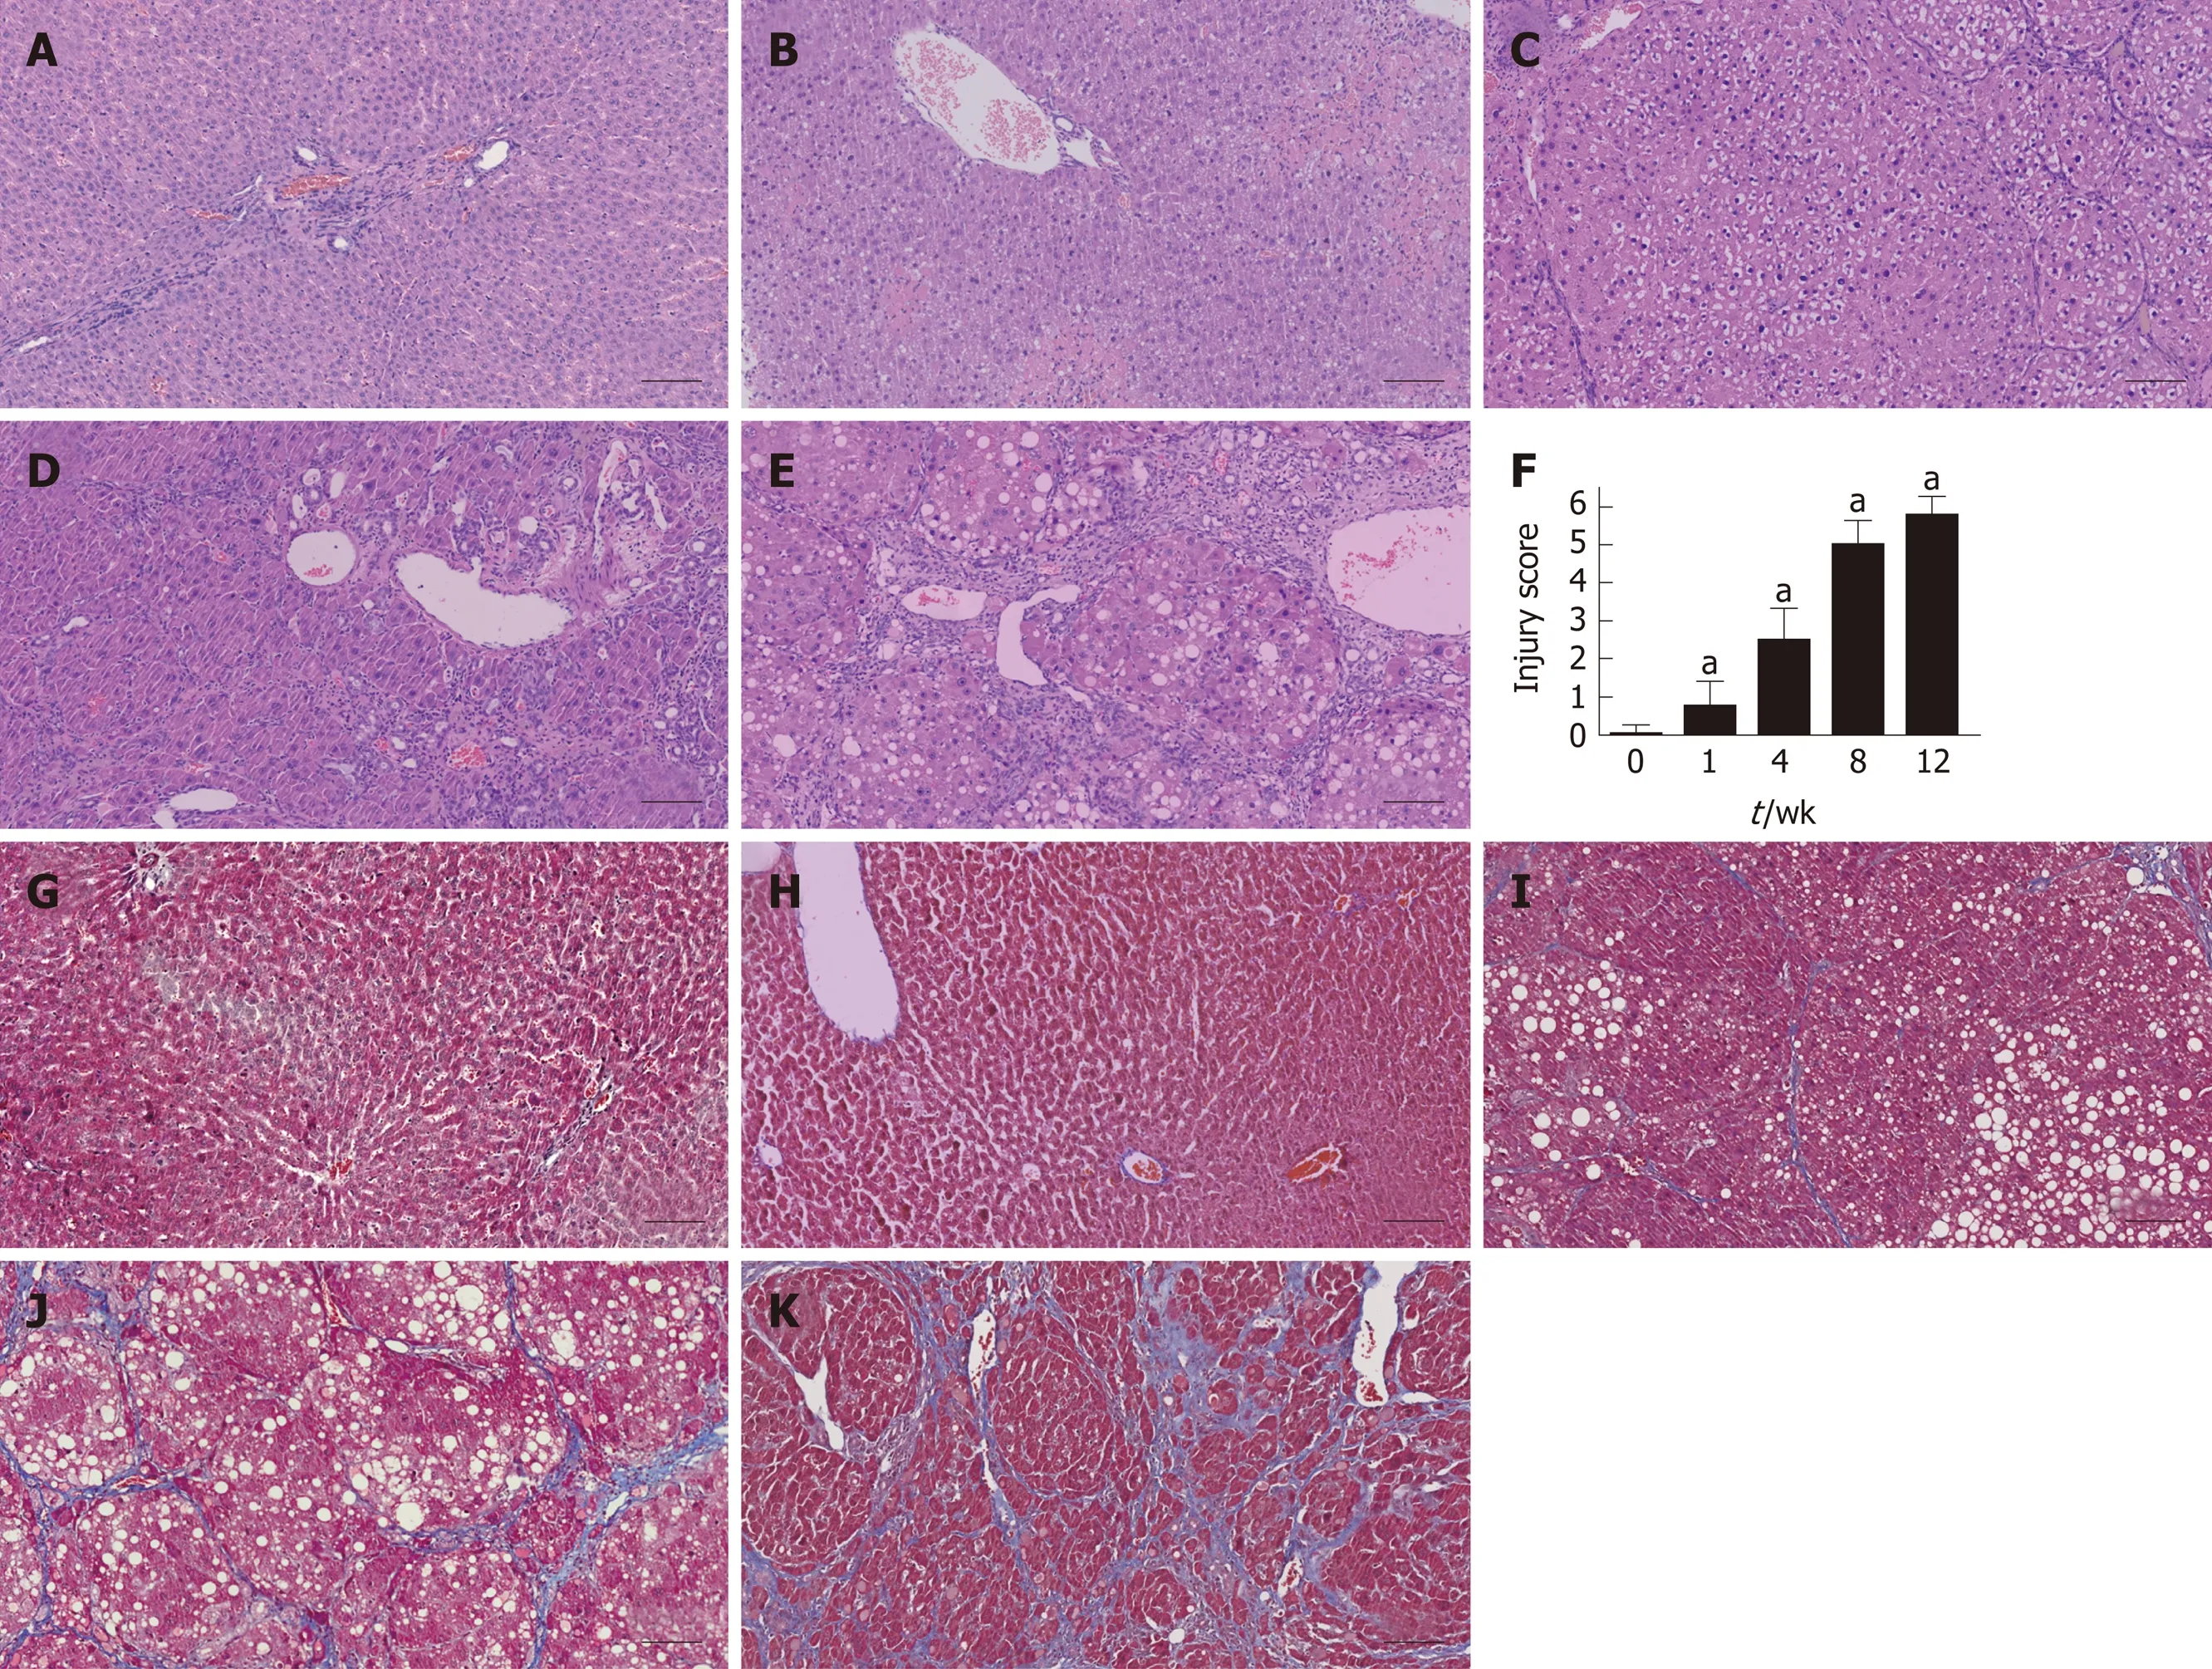
Figure 2 Histological assessment in each group using hematoxylin and eosin and Masson’s trichrome staining. A-E: Liver tissues were stained with HE in the control and fibrosis model groups at weeks 1, 4, 8, and 12; F: The injury score of fibrosis in each group; G-K: Liver tissues were stained using MTC in the control and fibrosis model groups at weeks 1, 4, 8, and 12 (aP < 0.01 vs control). Scale bars: 100 μm. HE: Hematoxylin and eosin; MTC: Masson’s trichrome.
Biomarker candidates for liver fibrosis
The MS chromatographic intensities of the 21 metabolites were analyzed by independent sample test and ROC analysis in both groups. CEA and β-MCA showed significant differences (P < 0.05) (Table 1). Combined box-and-whisker plots showed the key biomarker changes of liver fibrosis progression, from early and intermediate to cirrhosis stages (Figure 6A and B). These metabolites showed significant differences at the various stages. Interestingly, the metabolite alterations were most dramatic at the early stage and less pronounced in the advanced stage. To further validate the importance of these selected metabolites, ROC analyses were conducted to calculate the area under the curve (AUC); the diagnostic sensitivity and specificity of the metabolite cutoffs could be used to distinguish between individuals with cirrhosis,those with fibrosis, and normal controls. The results revealed that metabolite candidates showed significant diagnostic performance, i.e., with AUC values exceeding 0.8. CEA and β-MCA levels could be used to distinguish between control and fibrosis groups with high sensitivity and specificity. In addition, these metabolite levels could be used to clearly separate the early stages of fibrosis from advanced fibrosis or cirrhosis; the AUCs of TBA and ALT were only 0.795 and 0.576 between early fibrosis and late stage fibrosis or cirrhosis (Figure 6C-G).
DISCUSSION
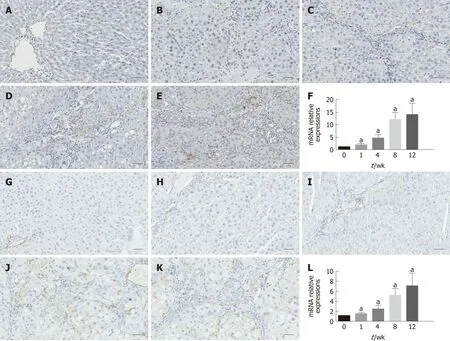
Figure 3 lmmunohistochemistry results and relative mRNA expression levels of α-smooth muscle actin and transforming growth factor β1. A-E:Immunohistochemical staining for α-SMA; F: qRT-PCR results of α-SMA at each time point; G-K: Immunohistochemical staining for TGF-β1; L: qRT-PCR results of TGF-β1 at each time point. The data are presented as the mean ± SD (error bars) and were statistically analyzed using a Student’s t-test. aP < 0.01 vs control. Scale bars: 100 μm. α-SMA: α-smooth muscle actin; TGF-β1: Transforming growth factor-β1; qRT-PCR: Quantitative real-time polymerase chain reaction.
Liver biopsy remains the gold standard for diagnosing fibrosis in chronic liver disease; however, liver biopsy has distinct limitations, such as invasiveness, potential complications, sampling error, bleeding, and risk of injury to neighboring organs[14-16].These limitations underscore the importance of developing reliable, non-invasive markers to evaluate the degree of hepatic fibrosis and stages of fibrosis. To date, no method has been developed to replace liver biopsy as the gold standard.
In this study, the CCl4-induced liver fibrosis model was successfully established in rats, and liver fibrosis and its severity were determined through HE, MTC, α-SMA,and TGF-β1 staining of histological sections. Analyses of the sera from the model and control rats at five time points revealed dynamic changes in metabolites during the process of liver fibrosis. These dynamic changes, identified in a series of assessments over time, could reveal the metabolic changes that occur during the progression of liver fibrosis, particularly in the interface phase between normal status, fibrosis, and cirrhosis. The heat map directly showed more severely metabolic patterns change at week 1 and week 12. In the early stage, the injury and death of a large number of hepatocytes resulted in abnormal liver function indicators, and we believe that this is the body’s stress response to CCl4. In the late stage, changes in liver metabolic capacity occur after injury of hepatocytes, which induces secondary changes of small molecule metabolites in vivo, as well as strong changes in metabolic spectrum.Screening of potential biomarkers may lead to early diagnosis.
CCl4is used widely in liver injury animal models, and the CCl4-induced damage is comparable to that observed with viral hepatitis. Free radicals and reactive oxygen species with oxidative stress are considered to be the main causes of the liver injury induced by CCl4[17,18]. Oxidative stress and cell membrane damage disrupt the metabolism of hepatic cells. Pathway analyses of CCl4-induced hepatocellular damage revealed involvement of several metabolic pathways, including alpha-linolenic acid metabolism; glycerophospholipid metabolism; linoleic acid metabolism; glycine,serine, and threonine metabolism; arachidonic acid metabolism; tryptophan metabolism; and aminoacyl-tRNA biosynthesis (Figure 5D). The various classes of metabolites exhibited different expression patterns during the progression of liver fibrosis. From the perspective of variation amplitude, the heat maps and Volcano plots suggested that more severe metabolic disturbances occurred during the final cirrhosis stage.
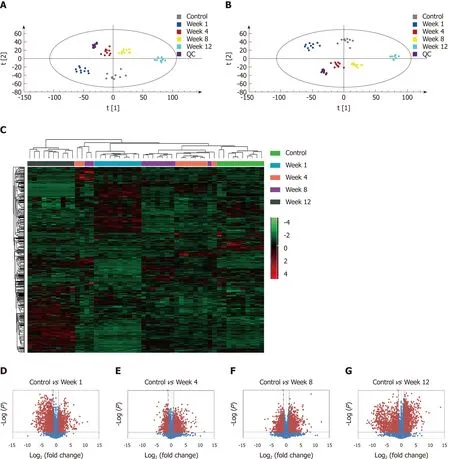
Figure 4 Metabolomic profiling and flux analyses. A: Principle component analysis for the control and fibrosis model groups at weeks 1, 4, 8, and 12; B:Orthogonal partial least squares discriminant analysis score plots for the control and fibrosis model groups at weeks 1, 4, 8, and 12; C: Heat map generated from the liquid chromatography-mass spectrometry data using the hierarchical clustering algorithm; D-G: Volcano plot analyses were used to determine the significant metabolites in the fibrosis model groups compared to controls at weeks 1, 4, 8, and 12. Data points with fold changes > 2 and P < 0.05 are labeled in red.
Although the metabolic profile can clearly distinguish fibrosis and control groups,and liver fibrosis and cirrhosis groups, the use of complex metabolomic matrices in the clinic requires further study. Therefore, we searched for new potential biomarkers out of thousands of differential metabolites. Using the OPLS-DA model for biomarker analysis, we identified 21 markers including hydroxyethyl glycine, L-threonine, IAA,β-MCA, CEA, PCs, and LPCs. To determine whether the differential levels of these metabolites were associated with stepwise fibrosis, we compared the levels in serum samples from CCl4-induced rats and controls at five time points. A comprehensive workflow was used to identify potential biomarkers, including visualization and metabolites of sample trajectories, multivariate screening for classification of different disease states, and stepwise univariate analyses for identification of important stages.Two metabolites, CEA and β-MCA, were defined as biomarker candidates.
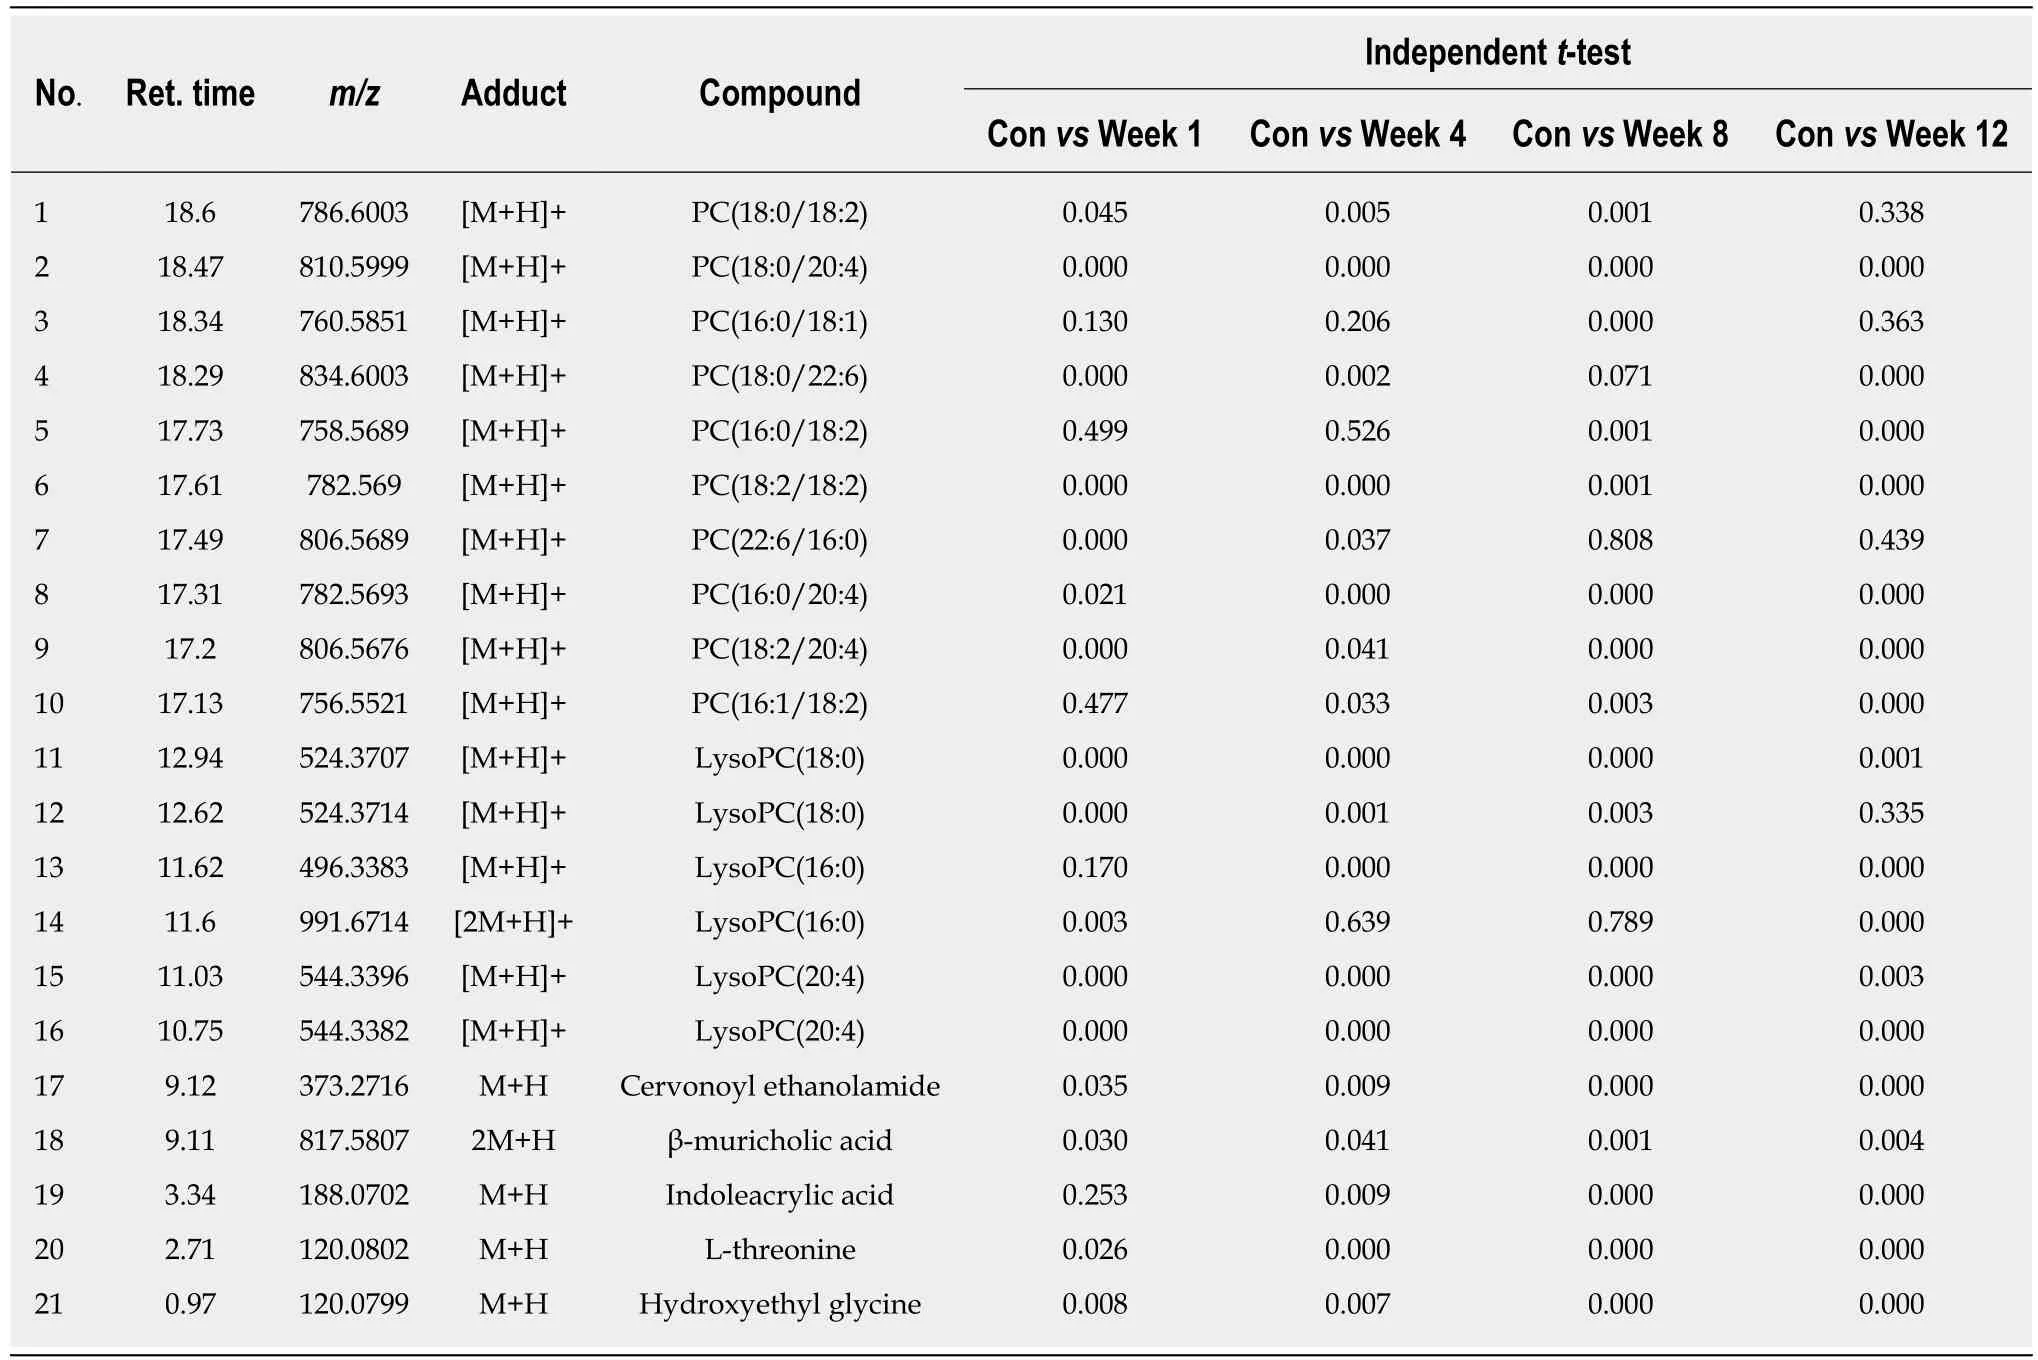
Table 1 The most prominent metabolites
CEA, also known as mead ethanolamide or eicosatrienoyl ethanolamide, is an N-acylethanolamine (NAE)[19,20]. NAEs are lipid mediators produced from N-acylphosphatidylethanolamine via several pathways. These endogenous bioactive lipids respond to a variety of stimuli and play critical physiological roles in a number of biological processes, including pain perception, metabolism, and inflammation,through different mechanisms[21-23]. NAEs include numerous fatty acid amides, such as palmitoylethanolamide, oleoylethanolamide, stearoylethanolamide, and CEA, and have been proposed as potential treatments for many diseases[24,25]. CEA is a novel eicosanoid; it was shown to be an agonist of central (CB1) and peripheral (CB2)cannabinoid receptors in 1995[14]. Increasing evidence indicates that the endocannabinoid system has a critical role in various liver diseases. In particular, the cannabinoid receptors CB1 and CB2 are upregulated in almost all chronic liver diseases, as well as cirrhosis and related disorders, and these receptors can be therapeutically antagonized[26-28]. Previous studies revealed that the CB2 agonists JWH-133 and 4′-O-methylhonokiol showed protective effects, such as decreased hepatocyte steatosis, inflammation, and liver regeneration[29-31]. In this study, we noted higher levels of CEA during the process of liver fibrosis, representing continuously increased concentrations of a CB2 agonist against CCl4-induced liver damage. In addition, CEA can directly inhibit both CD8- and CD4-T cell responses by reducing their production of TNF-α, IFN-γ, and IL-17[27].
β-MCA, a natural trihydroxy hydrophilic BA, is a major BA in the rat liver and found in their BAs[32]. BAs are major endogenous metabolites of cholesterol and are involved in many metabolic processes. Under normal conditions, the liver can effectively absorb BAs through enterohepatic circulation, and bound BAs that are present at micromolar concentrations in peripheral blood. However, hepatocyte injury in hepatic diseases leads to synthesis and clearance of BA in the liver and disturbed intestinal absorption, which is characterized by elevated levels of TBAs. The resulting high concentrations of BAs can aggravate liver injury and ultimately cause cirrhosis and liver failure[33]. The serum BA (SBA) test has been suggested to use in clinical practice to screen for liver diseases[34]. In general, in the case of hepatobiliary and intestinal diseases, significant changes in individual BA concentrations and their metabolic characteristics in plasma, urine, and feces can be observed; however, there is increasing evidence that cirrhosis is closely related to significant changes in SBAlevels[10,35]. Elevated SBA levels are a more sensitive test of cirrhosis than conventional liver function detection methods[36,37]. In this study, the increased levels of β-MCA during the process of liver fibrosis were consistent with the clinical biochemical finding of increased concentrations of TBA with fibrosis progression.

Table 2 Summary of pathway analysis results
The key aim of this study was to develop biomarkers for diagnosing fibrosis in the early stages. In addition, the study evaluated the diagnostic potential of these biomarkers. ROC analyses were performed for each metabolite candidate in comparison with currently available biomarkers, and these novel biomarkers achieved effective classification of both early and intermediate cirrhosis stages.Interestingly, the traditional clinical biomarkers, TBA (AUC = 0.795) and ALT (AUC =0.576), were not good enough to distinguish between fibrosis and advanced fibrosis or cirrhosis (Figure 6), indicating the difficulty in identifying early fibrosis and advanced fibrosis[6]. This dynamic metabolomic study of the potential biomarkers of stepwise liver fibrosis might be useful for screening early metabolic characteristics related to fibrosis. In addition, the UPLC-TOF/MS-based metabolomics analysis contributes to our knowledge of liver fibrosis. This study identified two novel fibrosis biomarkers;CEA is involved in anti-inflammation and acts as an antagonist of CB2, and β-MCA is related to the processes involved in hepatocyte damage. These biomarkers correctly classified the disease stage in our fibrosis animal model. Moreover, they distinguished between fibrosis and cirrhosis more clearly than traditional ALT and TBA levels.Further mechanistic investigations are required to investigate the involvement of these metabolites in fibrosis progression and histologic changes.
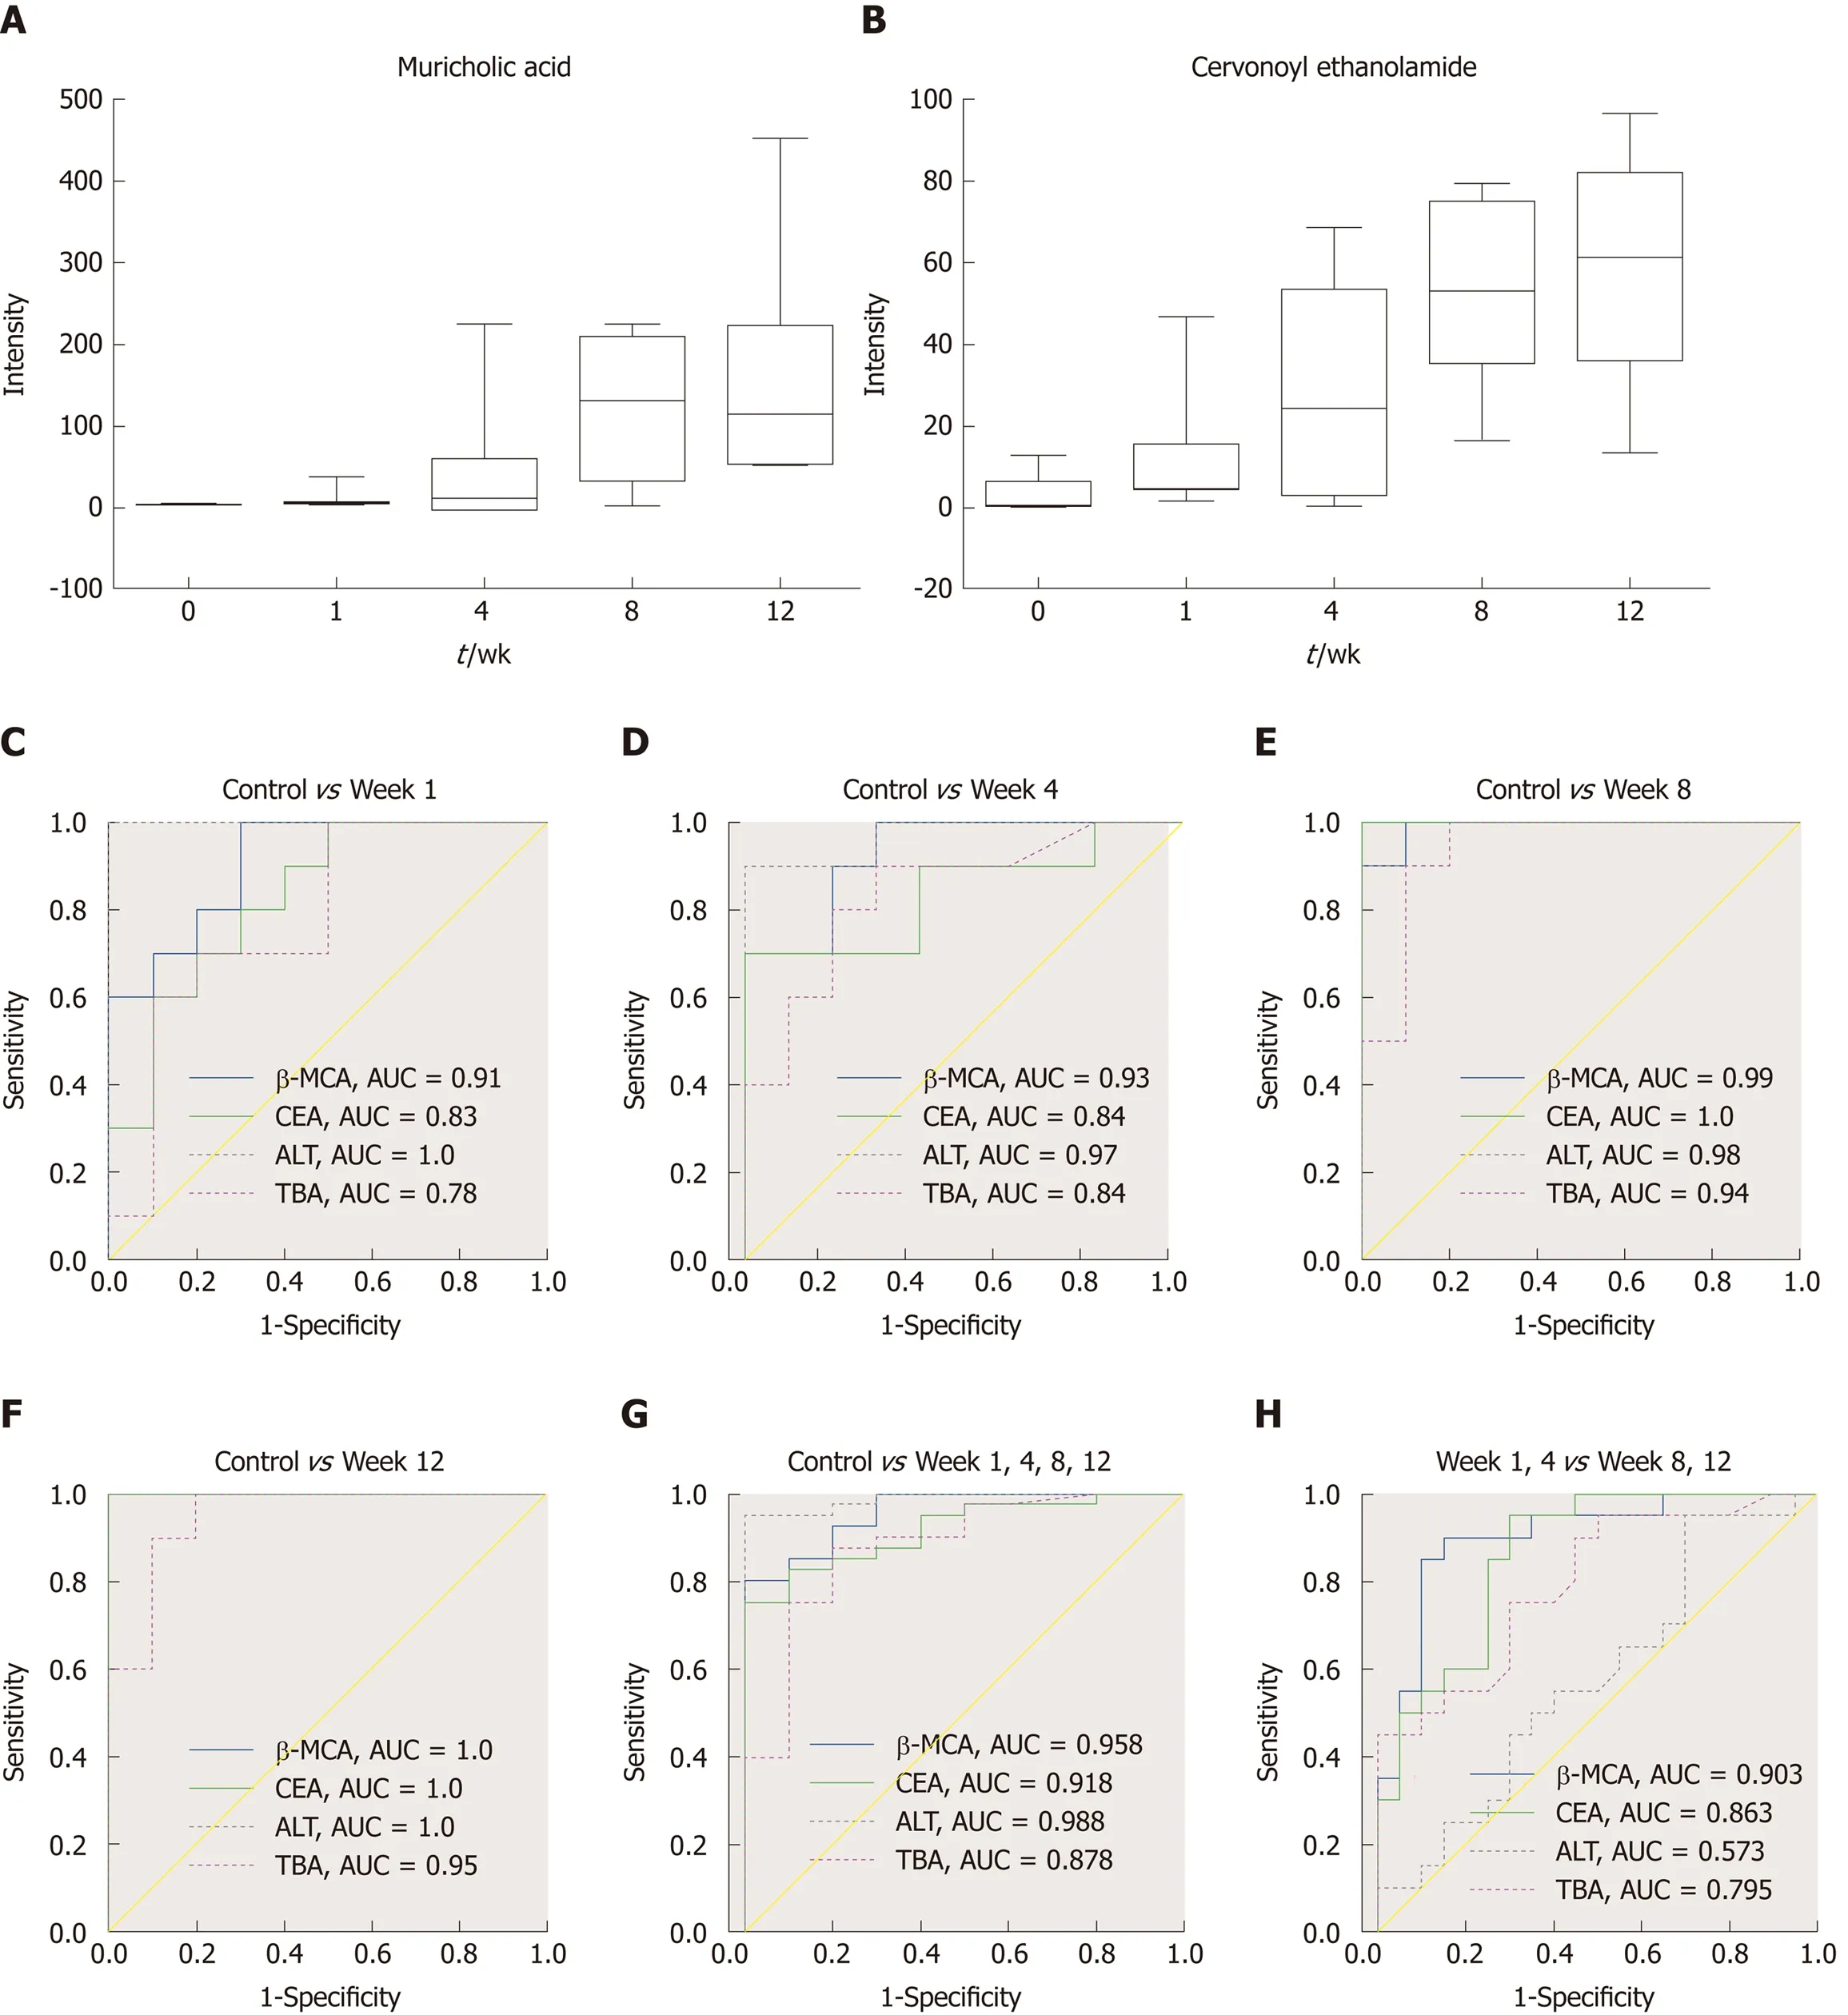
Figure 6 Biomarker candidates for liver fibrosis. A and B: Dynamic changes in the identified metabolites in each group; C-H: Receiver operator characteristiccurves for the diagnosis of liver fibrosis based on the potential biomarkers, TBA and ALT. TBA: Total bile acid; ALT: Alanine aminotransferase; AUC: Area under the curve; CEA: Cervonoyl ethanolamide; β-MCA: β-muricholic acid.
ARTICLE HIGHLIGHTS
Research background
Liver fibrosis is a common chronic progressive liver disease, and alanine aminotransferase is a commonly used diagnostic indicator for liver disease. Magnetic resonance imaging- and ultrasound-based elastography has been used for further assessment of hepatic steatosis and fibrosis, but these techniques are not able to diagnose inflammation and cell damage very well.Therefore, new liver fibrosis and functional biomarkers are needed as supplements.
Research motivation
Metabolomics is an important component of systems biology which provides quantitative measurements of global changes in individual metabolic characteristics in biological fluids responding to a variety of physiological and pathological stimuli, and it can be used to discover new biomarkers for differential diagnosis of disease.
Research objectives
The main objectives were to investigate the dynamic changes in metabolic profiles during the liver fibrosis progression, and seek for potential novel biomarkers for early diagnosis of liver fibrosis.
Research methods
A liver fibrosis model was induced by subcutaneous injection with CCl4. The dynamic changes in metabolic profiles during the progression of liver fibrosis were analyzed by ultra-performance liquid chromatography-mass spectrometry, and independent sample test and receiver operating characteristic analysis were used to identify potential biomarkers.
Research results
A liver fibrosis model was successfully established, which was evaluated by liver chemical tests,liver histopathology, Masson’s trichrome staining, and the expression levels of α-smooth muscle actin and transforming growth factor β1. Principal component analysis and orthogonal partial least squares discriminant analysis were used to characterize the metabolic profiles, which can clearly distinguish early liver fibrosis and advanced groups. We identified 21 metabolites associated with liver fibrosis, and two of them, β-muricholic acid (β-MCA) and cervonoyl ethanolamide (CEA), had excellent diagnostic value.
Research conclusions
The dynamic metabolomics profile is useful for screening early metabolic characteristics associated with progression of fibrosis. Two new metabolic biomarkers identified in this study,β-MCA and CEA, can correctly classify the disease stage in our fibrosis animal model.
Research perspectives
According to the results of rat experiments, further mechanistic studies are needed to investigate the involvement of these metabolites in fibrotic progression. We also need to collect clinical samples for further verification, and the markers identified may be used for clinical diagnosis in the future.
ACKNOWLEDGEMENTS
We would like to thank Dr. Ke Sun at the Department of Pathology of the First Affiliated Hospital of Zhejiang University for her kind review of the histopathology.
杂志排行
World Journal of Gastroenterology的其它文章
- Current and future pharmacological therapies for managing cirrhosis and its complications
- Outcomes of per oral endoscopic pyloromyotomy in gastroparesis worldwide
- Dbx2 exhibits a tumor-promoting function in hepatocellular carcinoma cell lines via regulating Shh-Gli1 signaling
- Procyanidin B2 protects against diet-induced obesity and nonalcoholic fatty liver disease via the modulation of the gut microbiota in rabbits
- Triggers of histologically suspected drug-induced colitis
- Women on the liver transplantation waitlist are at increased risk of hospitalization compared to men
