Nonlinear Modeling and Identification of Structural Joint by Response Control Vibration Test
2019-03-07LIUXinWANGLixiaoCHENQidongSUNBeibei
LIU Xin,WANG Lixiao,CHEN Qidong,SUN Beibei
1.School of Mechanical Engineering,Changshu Institute of T echnology,Changshu 215500,P.R.China;
2.School of Mechanical Engineering,Suzhou University,Suzhou 215000,P.R.China;
3.School of Mechanical Engineering,Southeast University,Nanjing 210096,P.R.China
Abstract:Components of mechanical product are assembled by structural joints,such as bolting,riveting,welding,etc.Structural joints introduce nonlinearity to some engineering structures,and the nonlinearity need to be modeled precisely.To meet serious quality requirements,it is necessary to detect and identify nonlinearity of mechanical products for structural optimization.Modal test to acquire a dynamic response has been applied for decades,which provides reliable results for finite element(FE)model updating.Here response control vibration test for identification of nonlinearity is presented.A nonlinear system can be regarded as linearity for particular steady state response,and classical linear analysis tool is applicable to extract modal data for particular response.First,its applicability is illustrated by some numerical simulations.Subsequently,it is implemented on experimental setup with structural joints by shaking table.The stiffness and damping function dependent of relative displacement are fitted to describe its inherent nonlinearity.The spring and damping forces are identified by harmonic balance method(HBM)to predict output response.Based on the identified results,the procedure is recommended that it allows a reliable measurement of nonlinearity with a certain accuracy.
Key words:nonlinear identification;shaking table;response control vibration test;relative displacement;structural joint;constant response
0 Introduction
In the stage of new product design,finite element(FE)analysis is an important tool to evaluate the product’s quality.Most mechanical structures’FE model needs to be updated to reveal its dynamic property.However,modal tests are limited to the linear range.Due to structural joints,frictional contact and manufacturing error,practical structures do not comply with the assumption of linearity.So nonlinearity cannot be neglected for dynamic modeling.The nonlinear behavior depends upon input excitation and output response,and some researchers had considered the nonlinearity induced by structural joints for numerical modeling[1-2].In dynamic analysis,vibration test is used to acquire the dynamic response of engineering structures.It reveals the presence of nonlinearity by examining the shift of frequency response function(FRF),change of waveform and response amplitude as increase of excitation levels.Aiming at a better study of the effect of nonlinear behavior involved in some structures’dynamics,nonlinear analysis needs a standard testing to solve these problems.
Many methods had been presented for identification of nonlinearities[3-5],and most of them focused on numerical modeling.Kerschen et al.[3]made a systematic review of the research progress of these technical and introduced various identification methods by time or frequency domain data.Göge[4]applied the analytical linearity plot to different aircraft prototypes in ground vibration tests,and it was used to judge nonlinearity types.The most popular time domain identification method was force-state mapping method[5],which could be widely used in multiple degree of freedom(MDOF)system.Jalali et al.[6]contributed a method for numerical modeling of bolted joint interface,and parameters of an assumed nonlinear model were identified to describe its nonlinear stiffness and energy dissipation.The restoring force surface method was another similar identification method and the method was applied for identification of a real-life spacecraft by Novel et al.[7].In addition,Wang et al.[8]proposed equivalent dynamic stiffness mapping technique for identifying the parameters of a nonlinear system.Its application for identification of MDOF systems was also illustrated.And all the identification methods need to capture time or frequency domain signals for the next study.
The analysis of FRF is widely used for nonlinear identification.In this paper,response control vibration test is conducted for nonlinear identification numerically and experimentally.It depends on the basic assumption that some nonlinear structures behavior linearly for steady-state response.And classical linear modal extraction tools are suitable for each steady-state response.The equivalent stiffness and damping are fitted as suitable function,which reveals inherent nonlinear elements.The investigation is interesting that response control vibration test is conducted for nonlinearity identification,which allows the adjustment of excitation level around resonance.The fitting stiffness and damping function are dependent of relative response amplitude between base and mass,which describes structural joint’s nonlinearity.Besides,the amplitude dependent damping and stiffness function are extracted from transmissibility rather than FRF as in previous study[9-11].Typical nonlinear numerical models are also applied for illustration.The aim is to construct a numerical model to reflect the nonlinear behaviors of experimental setup.Response control vibration test is implemented to identify the nonlinearity,and it enables the non-smooth nonlinearity of structural joint being approximated with ordinary polynomials.Finally,the predicted response is compared with the measured one,which shows a certain identification accuracy.
1 Linearity of Nonlinear System
1.1 Theory
In Refs.[8,10,11],some nonlinear structures exhibit linear behavior for steady response amplitude,and equivalent linear analysis is thus applicable.Provided that the dynamic behaviour is an isolated nonlinear mode,the governing equation of a nonlinear system can be expressed as

where m,c and k represent the mass,linear stiffness and damping,respectively.The response displacement,velocity and acceleration are presented as x,˙and¨,and nonlinear damping or spring force are represented with nk(x)andIf a nonlinear structure is excited by harmonic excitation and the force value is

With the above ideas[11]that most of the vibration energy is concentrated in the excitation frequencyω,which is equivalent to the harmonic balance method(HBM)with first-order expansion.So the vibration response can be rewritten as

where X denotes the amplitude andωthe phase angle of the response.When Eq.(3)is substituted into nonlinear force nk(x)and nc(x˙),it can be expanded by the Fourier series and only the primary harmonic component is considered as dominant

where V=ωX is the velocity response amplitude.k(X)and c(V)are the amplitude-dependent stiffness and damping,which can also be regarded as equivalent describing function.Derivation of equivalent describing function is conducted by HBM according to Eqs.(6),(7)[12-13].
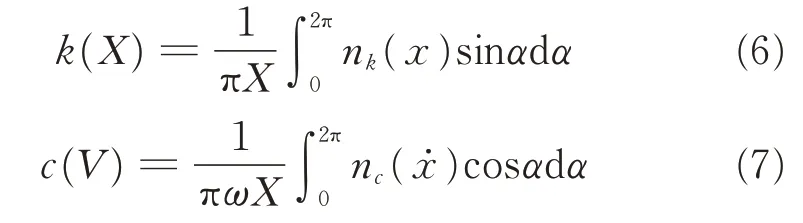
whereα=ωt is the phase angle of the complex response.This linearization only holds true for that particular response.The equivalent describing function of many nonlinear systems has been derived according to Refs.[11-13].The stiffness and damping is dependent of the response amplitude,then Eq.(1)can be written as

The stiffness and damping function can be employed to describe the nonlinearity and predict the interior nonlinear force.Nonlinear receptance of the system can be written in terms of function as

For various harmonic excitation,Eq.(9)can be solved by the iterative procedure for response prediction[14].Once a convergent solution is obtained after several iterations,a nearly constant value will be considered as the result.Meanwhile,describing function inversion[15]also can be used to identify the nonlinear parameter from the fitting result and provides an approximation of restoring force.Variation of stiffness and damping function as the response amplitude is not optional and corresponds to the law of a particular function.
1.2 Response control vibration test
Modal analysis is the most direct methods to detect the nonlinearity in dynamics study[16].Here,vibration test is divided into two groups:Excitation control vibration test and response control vibration test,which need control input excitation or output response.Fig.1(a)shows the experimental FRFs for different excitation levels in excitation control vibration test.As the increase of the excitation level,the nonlinearity is induced.The distorted FRF can be used for characterization of the nonlinearity.It reveals a hardening stiffness property by deformation of FRFs.Fig.1(b)shows the excitation levels level around the resonance.In response control vibration test,dedicated excitation signals are used to keep the response amplitude constant by a feedback control.The FRFs of the same nonlinearity are shown in Fig.2(a).And the excitation level is allowed to be adjusted(Fig.2(b)).In contrast to Fig.1(b),the excitation force is a variable,so that the excitation force is changed for constant response.It can be concluded that the FRFs exhibit no obvious distortions.And it exhibits non-deformed FRFs,which seem linear and reflect equivalent stiffness and damping for particular response.The shift of resonant frequency can be observed,and response control vibration test is used for nonlinearity identification.Then the conventional linear analysis tools can be used to extract parameters from the non-distorted FRF,and equivalent stiffness and damping can be obtained.Stiffness and damping function are obtained by fitting,which describes inherent nonlinearity and predicts the nonlinear force by HBM.

Fig.1 Experimental FRFs by excitation control vibration test

Fig.2 Experimental FRFs by response control vibration test
2 Numerical Cases
Typical nonlinear numerical models are applied to illustration.The identification method is used for extraction of classical nonlinearity,and the governing equation of the dynamic system is presented as

where fnk(x)andare the nonlinear stiffness and damping force.Runge-Kutta method ODE45 in MATLAB is used to solve the nonlinear equations.The time-domain response lasts for enough time to ensure required steady state response.The analyzed frequency around resonance is chosen with increments of 0.05 Hz.In the simulation process,the excitation level is adjusted so that the constant response is obtained for each frequency.Excitation control vibration test is also simulated as reference.And a three-dimensional space over the constant excitation/response and frequency is proposed to plot FRFs in Figs.3—5(a),(b).In excitation control vibration test,the inward axis is constant excitation.In response control vibration test,the inward axis is constant response.According to the simulated results,equivalent stiffness and damping are obtained.The parameters of nonlinearities are listed in Table 1.Obtained discrete stiffness and damping are fitting by equivalent describing function,as shown in Figs.3—5.

Table 1 Some classical nonlinearities used for numerical simulation(m=1.2kg)
A cubic hardening spring is used for simulation.The obtained FRF is shown in Fig.3.The stiffness function of cubic hardening spring is obtained by HBM as

Fig.3(a)shows FRF by excitation control vibration test.Excitation level ranges from 0 to 10 N along an inward axis,and frequency ranges from 5 to 8 Hz along a horizontal axis.Fig.3(b)shows the FRF obtained by response control vibration test.The control response amplitude ranges from 0 to 40 mm also along inward axis in Fig.3(b).Figs.3(c),(d)show the controlled response amplitude and excitation.Fig.3(e)shows the equivalent stiffness for different response levels.It can be shown that the stiffness function rises simultaneously.And the variation tread meets a polynomial form because of the stiffness hardening effect.Fig.3(f)shows the linear damping.
The simulated FRF of Coulomb damping is shown in Fig.4.And when HBM is applied,the damping function is obtained as

Fig.3 Simulated FRFs for cubic stiffness

where Nfis the friction force.Figs.4(a),(b)show the FRFs obtained by excitation/response control vibration test.By increasing the level of excitation,there is consistent stiffness(Fig 4(e)),which reveals linear stiffness.However,a large variation of equivalent damping is observed in Fig.4(f),and it is an indication of typical nonlinearity of Coulomb damping.
The combined nonlinearity(cubic stiffness and quadratic damping)is used for simulation.FRF by excitation control vibration test is shown in Fig.5(a).FRF by response control vibration test is shown in Fig.5(b).The FRFs are in three-dimensional space over the constant excitation/response and frequency.Fig.5(c)shows the constant response.Fig.5(d)shows the adjusted excitation.The equivalent stiffness and damping function for each response are fitted in Figs.5(e),(f).And the identified damping coefficient is corresponding to displacement linearly.According to HBM,the describing function of quadratic damping is


Fig.4 Simulated FRFs for Coulomb damping
3 Experiment
3.1 Exper imental preparation
Most components of practical structures are assembled together by structural joints,such as bolting,riveting,and welding,etc.Specimen is manufactured due to its low cost and convenience.The specimen is a large rectangle mass with a length of 340 mm,a width of 160 mm and a height of 50 mm,which has been used as a balance weight before.The specimen can be considered as a mass resting on a cushion and connected to the base by structural joints,which introduces nonlinearity into system.Response control vibration test is conducted for nonlinearity identification,as shown in Fig.6.A suitable preload is important before test.Since for a high pretension level,it is difficult to excite the nonlinearity,the joint system is hardly to bear a high base excitation for a loosened pretension level.
3.2 Vibration test

Fig.5 Simulated FRFs for combined nonlinearity
First,the hammer impacts at the middle point are implemented in the vertical direction.It is conducted to observe the dynamic response.Three accelerometers are attached to different positions of specimen.Fig.7 shows that the highest amplitude is around 181 Hz.It is confirmed that the dominant mode is rigid motion in vertical direction by the coherence of three accelerometers’output.It can also be validated by the mode shape in Fig.8.The modal grid contains 21 different measurement points that are uniformly distributed by mass.
It is pointed out that the interesting mode is vertical rigid motion,and it presents the procedure for identification of nonlinearity.As three accelerometers have nearly the same outputs around the dominant resonance,and one point will be observed for investigation.The random test is conducted.The mass is excited from 160 to 200 Hz around the resonance,and all input and output signals are in the vertical direction.Fig.9 shows the measured random excitation,where Fig.9(a)shows the time-domain data of the base excitation,Fig.9(b)shows the frequency-domain random excitation,Fig.9(c)depicts the power spectrum density(PSD)of acceleration response of mass.The acceleration response suggests that energy of the nonlinear system is concentrated in the excitation frequency.The primary harmonic response is dominant therefore,the energy of super-harmonics and the sub-harmonics can be ignored.Linearity for particular response is thus reasonable and accurate in following vibration test according toÖzer’s assumption[17].
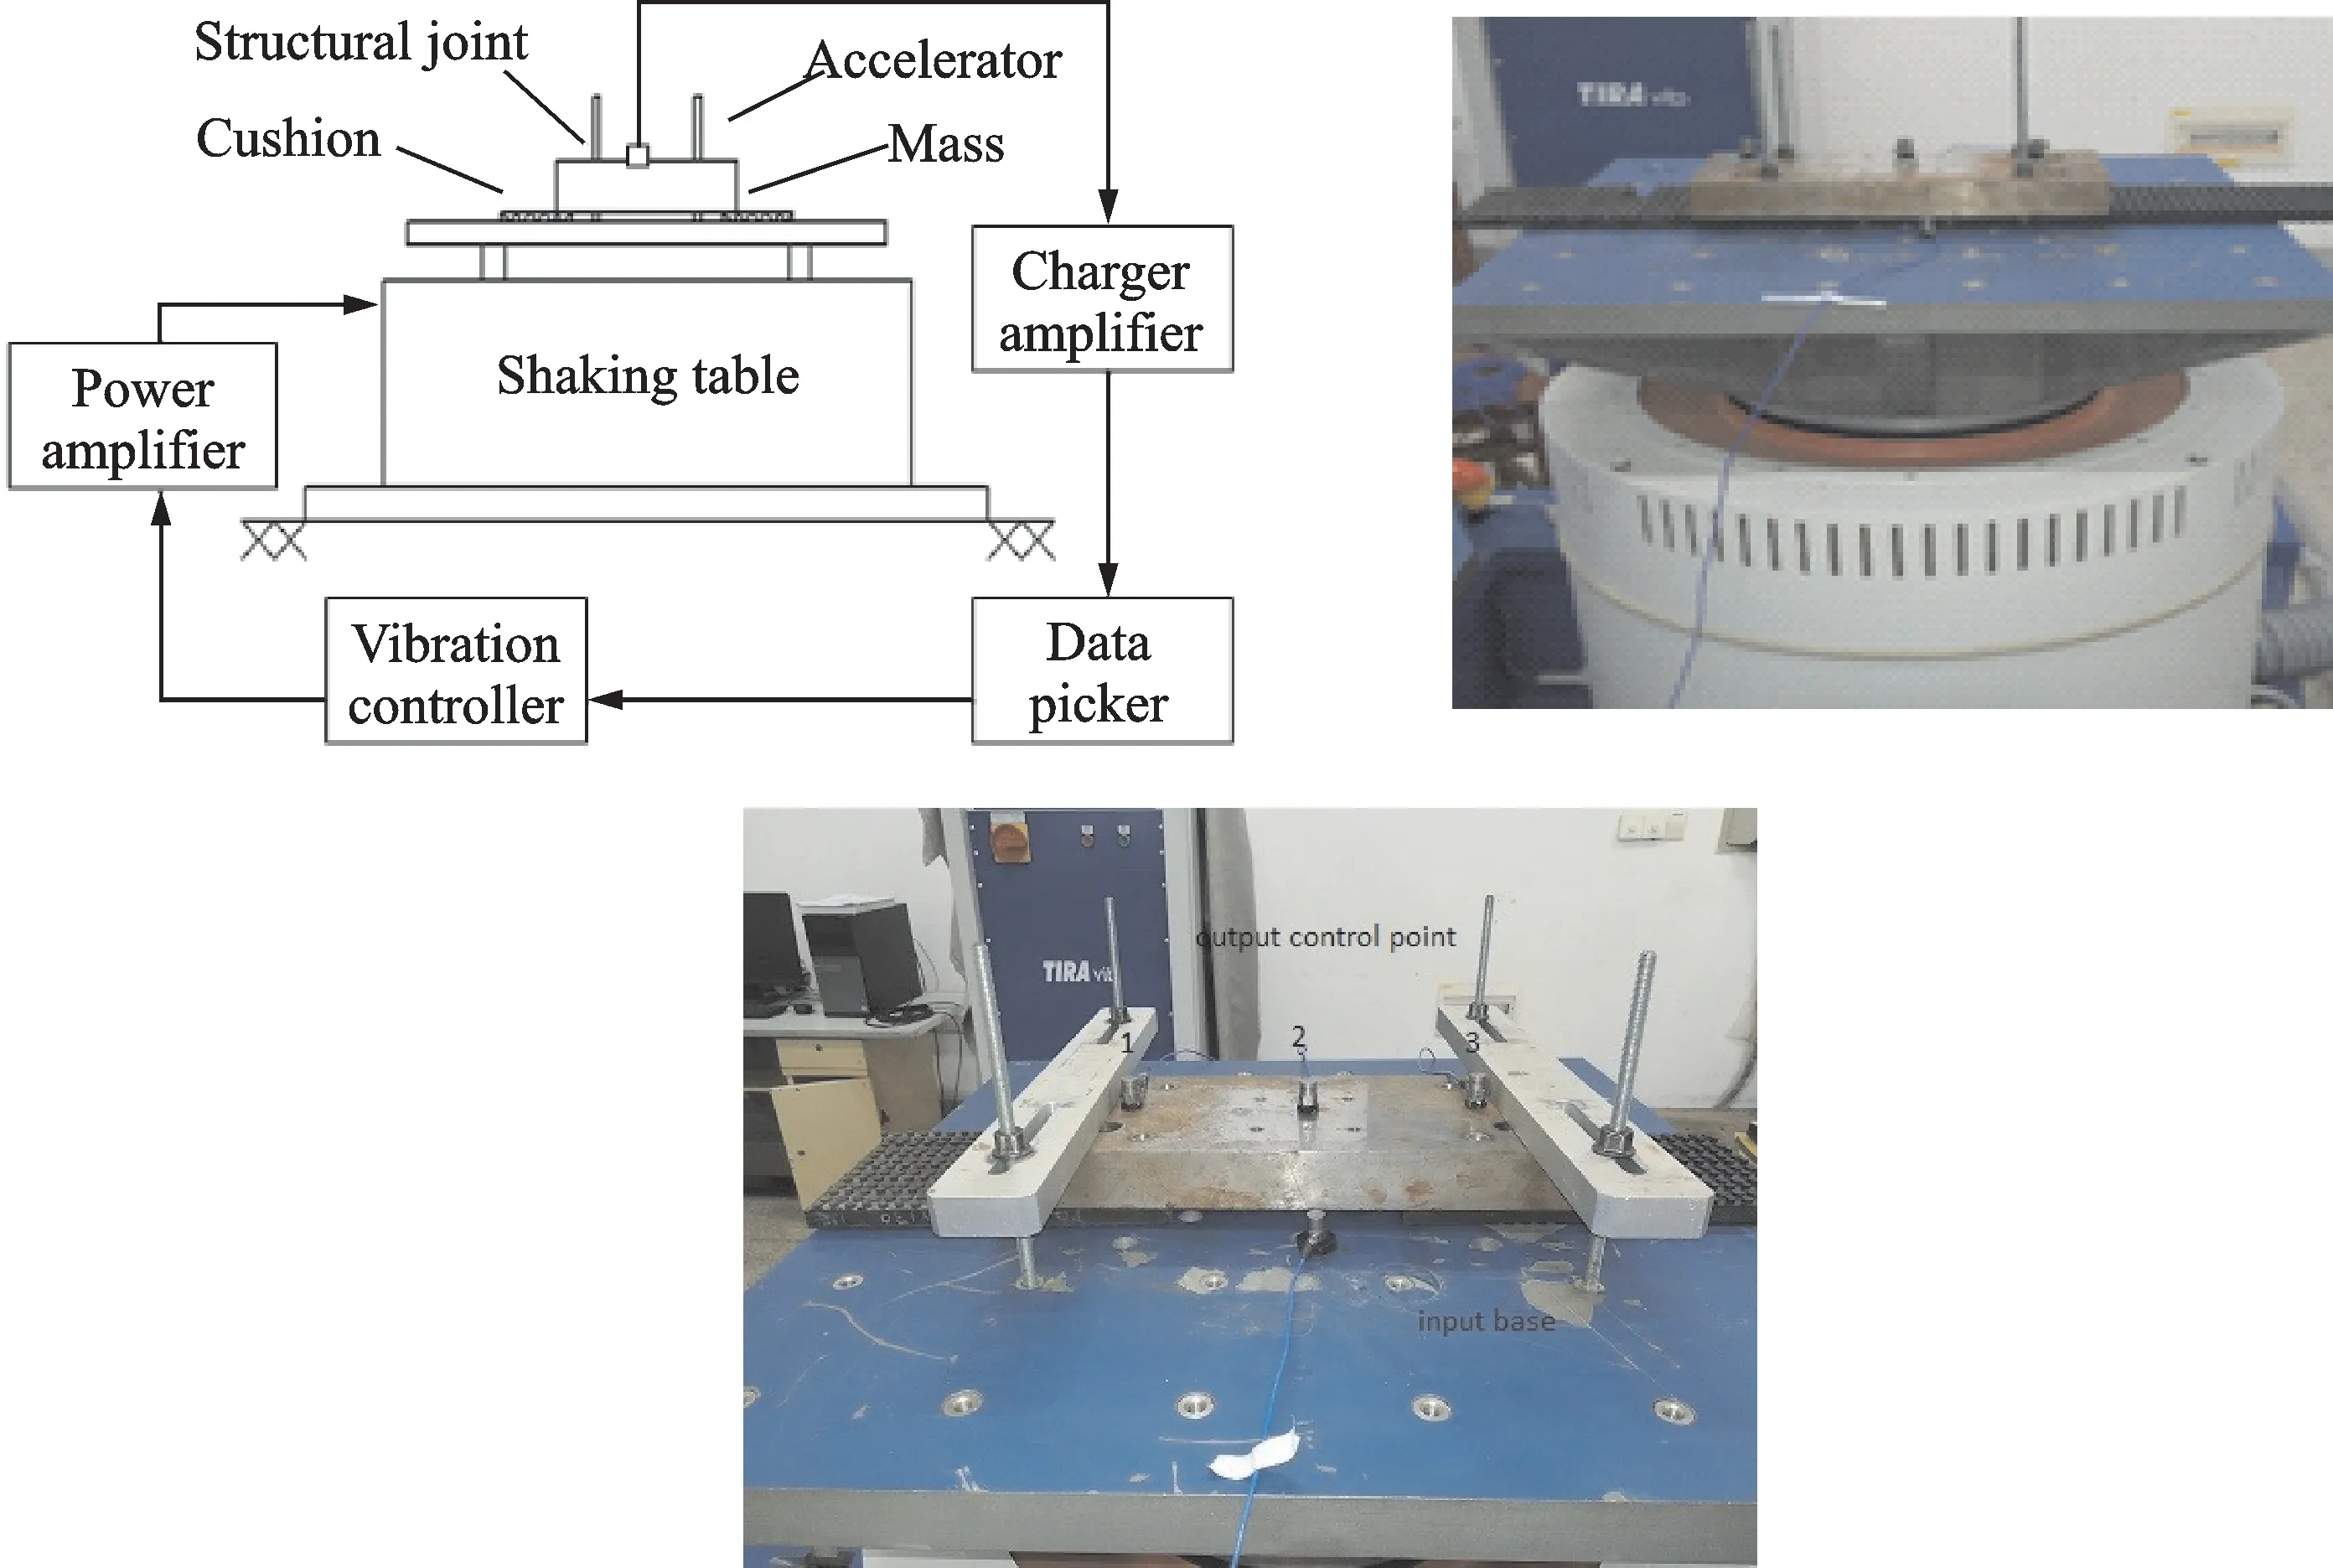
Fig.6 Schematic of experimental setup

Fig.7 Measured acceleration response in vertical direction
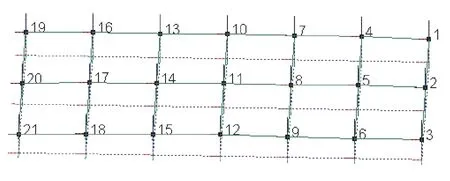
Fig.8 Modal shape for the vertical rigid motion around 181 Hz
Response control vibration test is conducted by a shaking table.The accelerometer placed on mass is selected as the control point,and the output response can be maintained as constant by feedback control system.The accelerometer placed on shaking table is used to pick up the excitation signals.The closed loop control is achieved by the m+p VibControl.The measured transmissibility is obtained and analyzed by the m+p data pickup,which is used to extract modal data.Ten nearly constant output response levels from 3×10⁻³to 50×10-3mm will be shown and the experimental result confirms response control is achieved successfully by closed-loop control.Fig.10(a)shows the nearly constant displacement response,Fig.10(b)the adjusted base excitation levels when approaching resonance,and Fig.10(c)the transmissibility from 150 Hz to 200 Hz by response control vibration test.It is true that the obtained transmissibility is non-distorted especially for large control response,which generates equivalent linear behavior.However,the shift of resonant frequency can be observed by experimental transmissibility,which reveals combined nonlinear stiffness and damping.Obvious softening stiffness can be observed with the decrease of resonance frequency as the increase of control response level.Hardening damping is confirmed by the width of peak(higher damping)and the change of peak amplitude.The effective linear behavior is generated for various control response levels,and it will be utilized for equivalent stiffness and damping fitting as well as identification of nonlinear force.

Fig.9 Base excitation signals
Excitation control vibration test is also conducted,as it is more convenient to control base excitation level.The results will be used to verify stiffness and damping function obtained by response control vibration test subsequently.The transmissibility is the ratio between mass response to base excitation.Different base excitation levels have been used for exciting the structure around the resonance.Fig.11(a)shows the base excitation level.Fig.11(b)depicts the base accelerations for different excitation levels 1,5,9 and 13 m/s2.
4 Modeling and Validation

Fig.10 Response control vibration test by shaking table
The procedure has been explained with some nonlinear numerical models in Section 3.Shaking table test results in transmissibility,so nonlinearity identification is conducted by transmissibility rather than FRF.Subjecting to a base excitation in the vertical direction,it can be considered as equivalent system containing spring and damper.Supposing a base excitation as y=Y sinωt,and the theoretical model can be used for numerical simulation


Fig.11 Excitation control vibration test on shaking table
where m is the mass,k and c are the linear spring and viscous damping,respectively,x the displacement response of mass,and y the displacement excitation of base.Two kinds of transmissibility are introduced.The absolute transmissibility is defined as

whereωnandωare the resonant frequency and excitation frequency,respectively,andζthe damping ratio.The maximum amplification factor occurs at the resonant frequency and it is

Another is relative transmissibility,defined as

The modal information can be obtained by the transmissibility.The evolution of resonant frequency and damping ratio can be well represented by the function of output displacement response X.Fig.12 shows the evolution of resonant frequency and damping ratio.The resonant frequency and damping ratio is corresponding to output response.It reveals the structural joint’s softening stiffness and hardening damping.

Fig.12 Evolution of resonant frequency and damping ratio against the control response
Moreover,previous study has also revealed that the modal parameters are dependent of several factors,such as response amplitude,excitation level,frequency and excitation type,etc[18].Given the relative displacement between mass and base as z=x-y,Eq.(14)can be rewritten as

Since it is more suitable to describe the stiffness and damping function by the relative displacement.Z is the relative displacement amplitude,and it can be regarded as effective deformation of structural joint[19].And it is also the displacement difference between mass response and base excitation.A numerical model corresponding to relative displacement is conducted to present the nonlinearity.The relative displacement Z can be calculated by
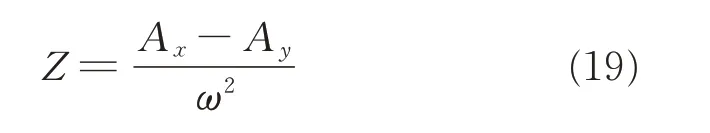
where Axand Ayis the acceleration spectra of mass response and base excitation,respectively.The spring or damping nonlinearity of structural joint is considered to be dependent of Z.The equivalent describing stiffness and damping function is defined as k(Z)and c(Z).The nonlinearity property is dependent of relative displacement.A theoretical model Eq.(20)is employed to predict vibration response.Finally,it will be validated against experimental one.

The equivalent describing stiffness and damping function is related to the relative displacement,which can be used to describe the nonlinear characteristic.It is possible to obtain series of discrete stiffness and damping corresponding to relative displacement.The ordinary polynomials is used for fitting.Since for nonlinearities in real structure without any priori information,ordinary polynomials is more suitable to describe the complex and non-smooth nonlinearities instead of a special function[20].The fitting results obtained by constant response vibration test is shown in Figs.13(a),(b).

Fig.13 Fitting stiffness and damping depedent of relative response
The stiffness and damping have been fitted with suitable basis function by experimental transmissibility,and unknown element in the assumed mathematical model Eq.(21)can be obtained by HBM according to Eqs.(6),(7).

where c=1 789,k=1.588e7,=nk(z)+nk(z)=-5.527 6e10z|z|+4.184e13z3,=9.827 7-1.037 7Eq.(21)is regarded as nonlinear numerical model,which can be used to predict the output response.The absolute transmissibility Trcan be calculated by Eq.(22),and the predicted response will be compared with the experimental one.
Nonlinearity identification by response control test is conducted,the numerical solutions of Eqs.(21),(22)are used to predict vibration response.And 1,5,9,13 m/s2are used as the base excitation level.The predicted transmissibility is plotted as solid lines in Fig.13.The predicted transmissibility is compared with experimental one.It shows that the predicted transmissibility and measured one are close.The fitting function reveals the hardening damping and softening damping,and identified results have the ability to describe the nonlinearity with certain accuracy.The significance of the result is that it enables the complex nonlinearity,whose physics may not be well understood,to be represented by polynomials approximation instead of the unduly complex one[21].The identified result is sufficient to describe nonlinear property within a certain range,and a broader range of excitation values ideally far away from the tuning region is not recommended.
5 Conclusions

Fig.14 Simulated transmissibility extracted by const-response vibration test and measured one by excitation control vibration test for 1,5,9 and 13 m/s2 base excitation
Procedure for nonlinear parametric identification of structural joint by response control vibration test is investigated.And identification method is based on the fact that stiffness and damping can be regarded as constant under particular vibration response.Then the classical linear analysis tools could be used to extract modal data from the measured FRFs.Response control vibration test is conducted by shaking table,and output vibration response is maintained as constant by adjusting base excitation.It results in equivalent stiffness and damping for particular control response.The discrete stiffness and damping can be fitted with suitable function over response amplitude,which can be utilized to describe the nonlinearity and to predict vibration response.It is illustrated that it can parametrically identify nonlinearities by numerical cases.Then the experiment is conducted,and the dominant resonance is investigated.It is important that it enables the non-smooth nonlinearity without any prior information to be represented as a function of effective relative displacement.It represents structural joint’nonlinearity at least to a first-or second-order ordinary polynomials approximation well.The predicted vibration response reveals the feature of peak shifts and amplitude changes.It proves the accuracy of identification results and validates constant response vibration test in extracting nonlinear property of real structure.
杂志排行

Transactions of Nanjing University of Aeronautics and Astronautics的其它文章
- BeiDou B1I/B3I Signals Joint Tracking Algorithm Based on Kalman Filter
- Impact Analysis of Solar Irradiance Change on Precision Orbit Determination of Navigation Satellites
- Characterization of Self-driven Cascode-Configuration Synchronous Rectifiers
- Cooperative Search of UAV Swarm Based on Ant Colony Optimization with Artificial Potential Field
- H∞Preview Control for Automatic Carrier Landing
- Single-Phase to Three-Phase Inverter with Small DC-Link Capacitor for Motor Drive System