A dataset of agro-meteorological disasteraffected area and grain loss in China (1949 –2015)
2018-11-17GuoJingpengChenHuiqianZhangXiaorongZhaoYinghuiMaoKebiaoLiNingZhuLiang
Guo Jingpeng , Chen Huiqian, Zhang Xiaorong, Zhao Yinghui*, Mao Kebiao*, Li Ning, Zhu Liang
1.College of Resources and Environment, Northeast Agricultural University, Harbin 150030, P.R.China;
2.Institute of Agricultural Resources and Regional Planning, Chinese Academy of Agricultural Sciences, Beijing 100081, P.R.China;
3.School of Education Science, Shanxi Normal University, Linfen 041000, P.R.China
Abstract: As a big agricultural country, the People’s Republic of China has experienced a series of natural disasters since its founding, such as the 1959– 1961 Great Famine, the 1998 floods and the 2008 snowstorm.Here we present a dataset summarizing four categories of meteorological disasteraffected area at provincial level in China from 1949 to 2015: mildly-affected area, moderately-affected area, heavily-affected area, and total affected area.Based on crop-planting data and natural disaster data, grain losses are also evaluated by using a grain loss assessment model.The dataset plays an important role in the future prediction, prevention, and reduction of agrometeorological disasters.
Keywords: natural disasters; grain loss; provincial; China; 1949 – 2015
Dataset Profile
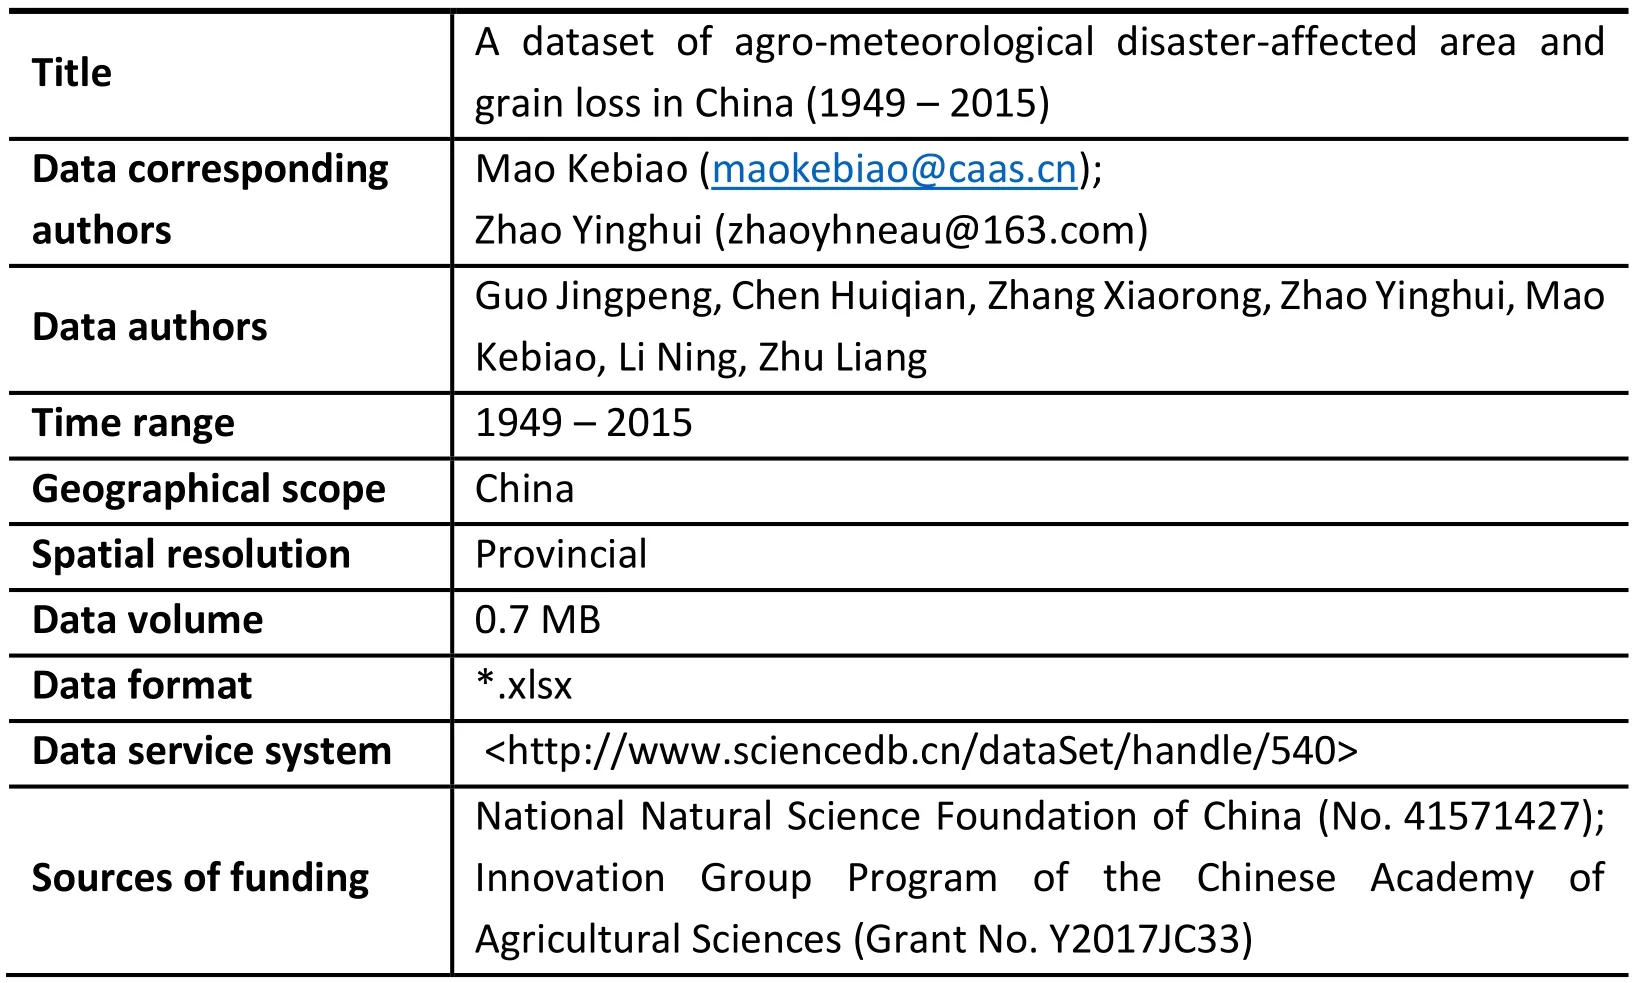
Title A dataset of agro-meteorological disaster-affected area and grain loss in China (1949 – 2015)Data corresponding authors Mao Kebiao (maokebiao@caas.cn);Zhao Yinghui (zhaoyhneau@163.com)Data authors Guo Jingpeng, Chen Huiqian, Zhang Xiaorong, Zhao Yinghui, Mao Kebiao, Li Ning, Zhu Liang Time range 1949 – 2015 Geographical scope China Spatial resolution Provincial Data volume 0.7 MB Data format *.xlsx Data service system

Dataset composition This dataset consists of two data files: Natural_disaster.zip stores data of disaster-affected area and Grain_loss.zip stores evaluated data of grain losses.(1) Natural_disaster.zip is a 0.45 MB disaster data set made up of three files:● Mildly-affected area.xlsx presents the areas with less than 100% of the yield that would be expected under long-term average temperature and precipitation due to natural disasters;● Moderately-affected area.xlsx presents the areas with less than 70% of the expected yield due to natural disasters;● Heavily-affected area.xlsx presents the areas with less than 30% of the expected yield due to natural disasters.(2) Grain_loss.zip is a 0.25 MB grain loss data set made up of two.xlsx files:● Grain_loss_amount.xlsx;● Grain_loss_ratio.xlsx.
1.Introduction
With a vast territory, diverse climatic types, fragile ecosystems and varied types of disasters, China is a country that suffered from the most serious natural disasters in the world.Agricultural disasters constitute the main natural disasters in China, mainly including flood, drought, low temperature, hail, and typhoon,with flood and drought being the most prominent.1–3In June and July 2017, 11 provinces in southern China suffered from floods, which affected more than 11 million people, including 78 people who died or disappeared and 27 thousand houses that collapsed.Direct economic losses reached 25.27 billion yuan, leading to a government supply of up to 1.88 billion yuan for disaster relief.Research on the temporal-spatial laws, driving mechanism, risk assessment, regional regularity,and control measures of natural disasters needs the support of historical disaster datasets.3–4Here we sorted, summarized and evaluated the data of major meteorological disasters in China at provincial level from 1949 to 2015, as well as the data of grain losses caused by these disasters.
Firstly, we summarized mildly-, moderately-, and heavily-affected area, as well as total affected area by meteorological disasters from 1949 to 2015 (i.e., flood,drought, low temperature, hail, typhoon).Secondly, based on the crop planting dataset, we estimated grain losses caused by these disasters at provincial level by means of grain loss assessment model.The dataset, which includes information on agro-meteorological disasters and grain losses, can provide a scientific basis for investigating the spatiotemporal pattern of agro-meteorological disasters.
2.Data acquisition and processing
2.1 Overview
It should be noted that, due to limited data availability, statistics of Hong Kong,Macao, and Taiwan were not included in this dataset.This study covers five main disaster types that took place in 31 provinces/municipalities in China: flood, drought,hail, low temperature, and typhoon.The raw data were collected over the period 1949 – 2015 via Python scripts (Figure 1) from the website of the Ministry of Agriculture of China (MAC) and China Statistical Yearbooks Database (CSYD), as listed in Table 1.Python scripts 1, 2, and 3 (Figure 1) are Web-based data mining techniques.

Figure 1 Flowchart illustrating the dataset formation

Table 1 Description of the raw data

Heavily-affected area (10*4 ha) 1949 - 2015 31 provinces /municipalities in China Yearbooks Database(CSYD)Grain yield (kg*ha^-1) 1949 - 2015 31 provinces /municipalities in China Crop planting dataset Crop-sown area(10*4 ha) 1949 - 2015 31 provinces /municipalities in China(10*4 ha) 1949 - 2015 31 provinces /municipalities in China Grain-sown area Website of the Ministry of Agriculture of China (MAC)
Firstly, we cleaned, sorted and replenished the raw meteorological disaster data drawn from the above two sources.Secondly, the final meteorological disaster dataset and the planting dataset were used to generate grain loss data via grain loss assessment model.A detailed description of the final dataset is given in Table 2.
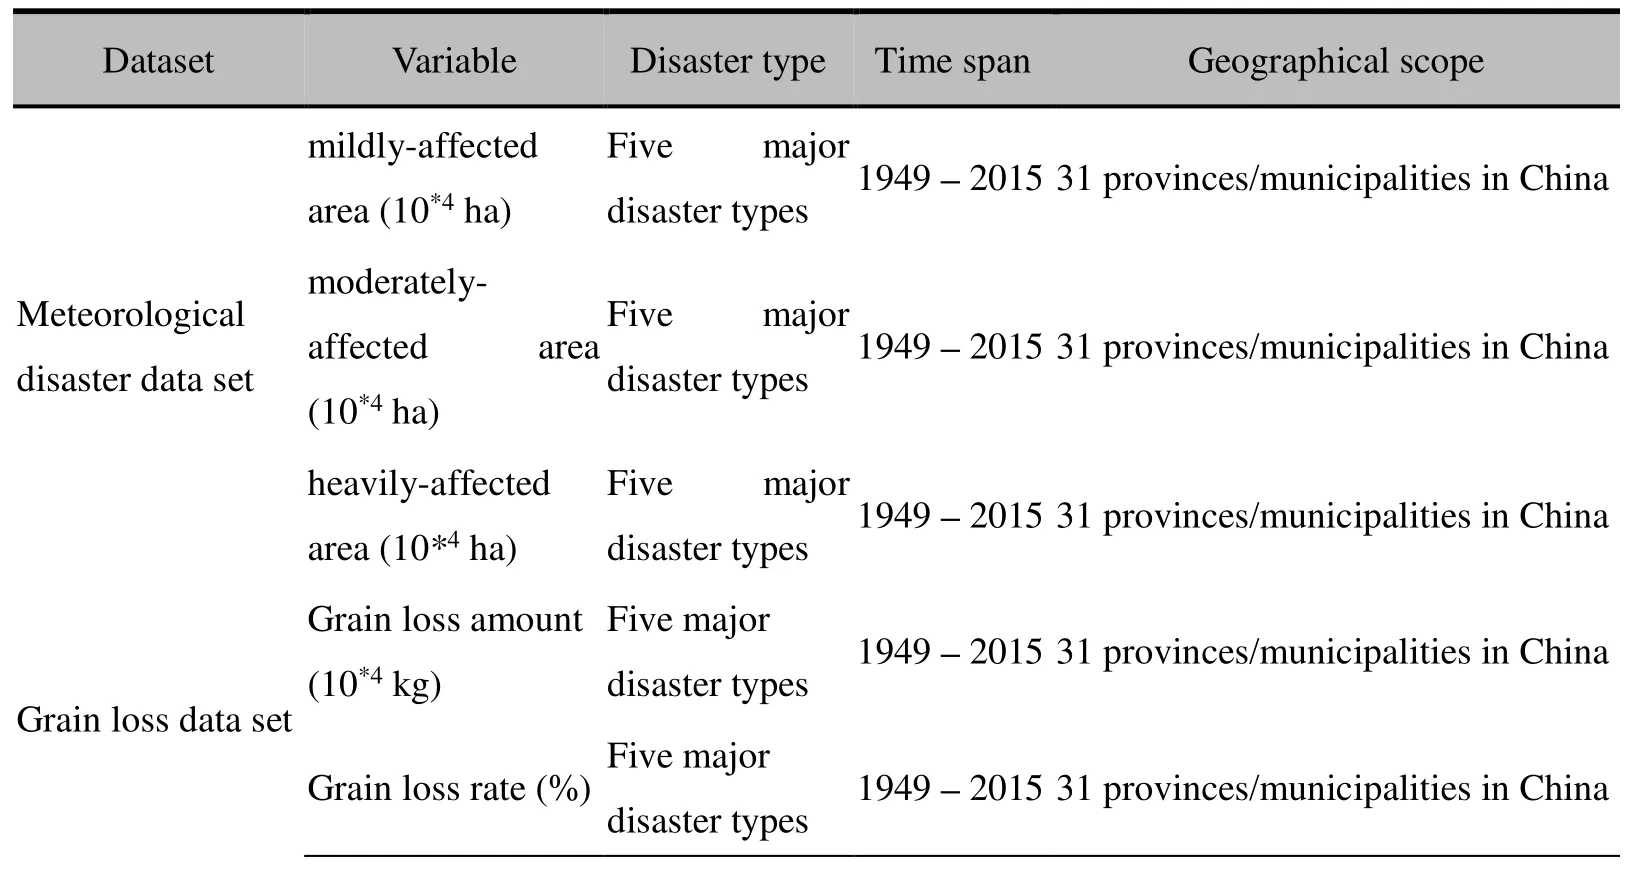
Table 2 Description of the data of meteorological disaster-affected area and grain loss
2.2 Methods
Li et al.(2010) constructed a statistical model for estimating the amount of grain loss based on grain yield and disaster-affected area.Researchers (Shi et al., 2014;Guan et al., 2015) in China mainly used the statistical model to estimate the amount of grain loss in recent years.4–6This section uses the model to estimate the amount of grain loss based on the following formula:

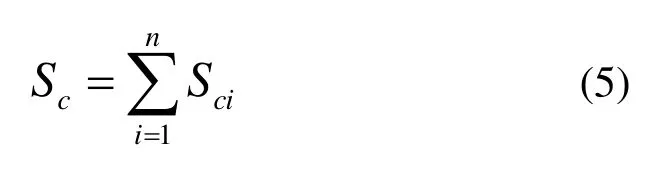
whereScis the amount of grain loss in China;nis the number of provinces and municipalities;Sciis the grain loss in Provincei; Gqis the grain loss caused by mild disaster; Gmis the grain loss caused by moderate disaster; Gzis the grain loss caused by severe disaster;Riis the ratio of grain-sown area to crop-sown area;Ai1, Ai2,andAi3designate the amount of crop area affected by mild, moderate and severe disasters,respectively (mild disaster: 10 – 30% grain losses; moderate disaster: 30% – 70% grain losses; severe disaster: over 70% grain losses); andyiis the grain yield per ha of Province i in the same year.P1, P2,andP3assume a value of 20%, 50%, and 85%,respectively, assigned based on the median method in tandem with the definitions of crop affected area and crop failure area.
The ratio of grain losses to total grain output in the same year was defined as the rate of grain losses.8It is expressed by:
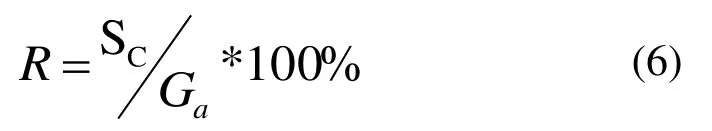
whereRis the ratio of grain loss;Scis the amount of grain loss;Gais the amount of total grain output.
3.Sample description
Moderately-affected area.xls includes six worksheets (tag name: Flood,Drought, Hail, Low_temperature, Typhoon).Each table is a 2 * 2 matrix form; the first column of the worksheets records the name of the province/municipality; time dimension (1949 – 2015) is given in the first line and matrix values are in units of 104ha.
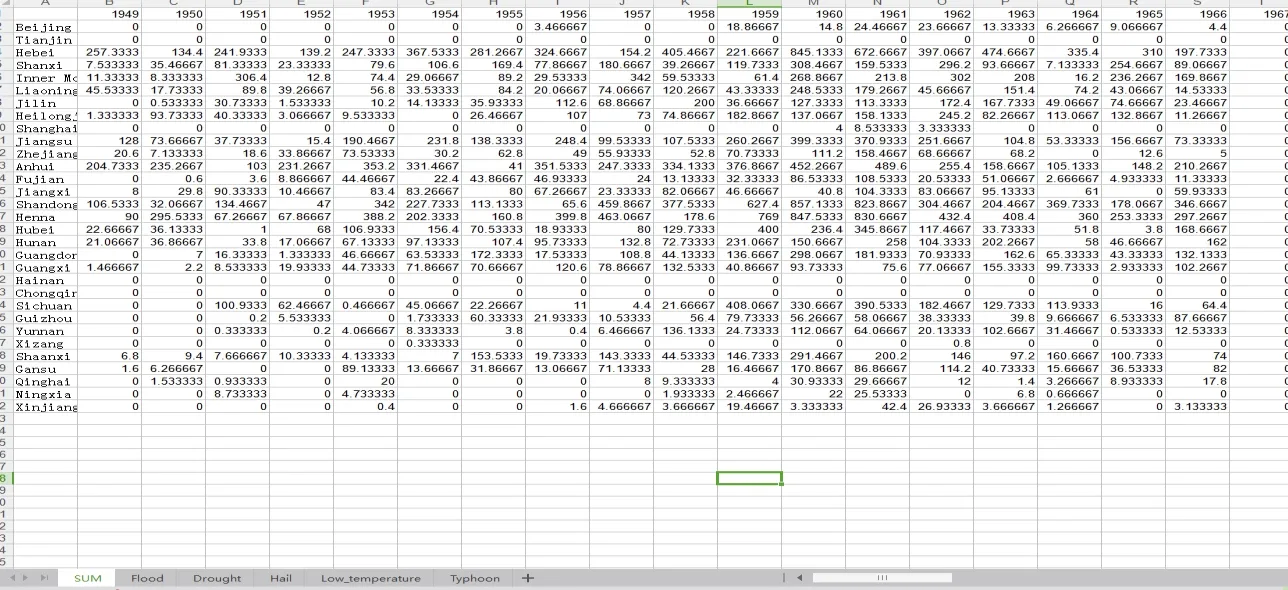
Figure 2 Moderately-affected area at provincial level
4.Quality control and assessment
Quality control involved detailed inspection and exploration of patterns to detect any typographical errors or other data errors.The data provided herein were re-processed from the raw data supplied by MAC and CSYD, and as such depended on the quality and reliability of the data sources.Zhao et al.(2017) used the above data to analyze the tempo-spatial characteristics of natural disasters and grain losses in China from 1949 to 2015, and found that flood and typhoon were concentrated in,and greatly limited to, central China, eastern China and the southeast coast of China,unlike other disasters which were randomly distributed.Their findings were hence consistent with the findings of Guan et al.(2015) and Du et al.(2015).2-5
5.Usage notes
The dataset is released via Science Data Bank(http://www.sciencedb.cn/dataSet/handle/540), and the Resource Service System of the CERN Data Center (http://www.cnern.org.cn), where users can log into the system, click data resources and select data to enter the download page.There are no copyright or proprietary restrictions on the dataset.
