Optimizing submerged arc welding using response surface methodology,regression analysis,and genetic algorithm
2018-07-06AjitnshuVedrtnmGynendrSinghAnkitKumr
Ajitnshu Vedrtnm,Gynendr Singh,Ankit Kumr
aDepartment of Mechanical Engineering,Invertis University,Bareilly,UP 243001,India
bDepartment of Applied Mechanics,Motilal Nehru National Institute of Technology Allahabad,Allahabad,UP 211004,India
1.Introduction
Automation of the welding process for higher production rate requires the established relationship of the weld bead geometry and process parameters for predicting and controlling the quality of weld bead[1].The design of the experiment and various statistical methods(Response surface methodology,Taguchi Approach,Factorial designetc.)can be used for developing the relationships between weld bead geometry and process parameters[2].The SAW is having high productivity so it is preferred for many welding applications[3].The SAW is used in the fabrication of offshore structures,pipelines,marine vessel,and pressure vessel as an excellent surface appearance and the high deposition rate is achieved[4].A good number of authors[5-10]used statistical techniques for optimization of the process parameters in the SAW process.
The variable polarity can be adopted for controlling the composition of the weld bead during SAW[11].The heat input during SAW can be reduced by using the bypass electrode[12].Double electrode SAW can be utilized for achieving the same metal deposition rate for lesser heat input[13].The optimum combination of travel speed and root opening also reduces the heat input which avoids distortion in fillet welding[14].The monitoring and controlling the weld bead penetration in SAW can be performed using control system based on base metal current[15].The SAW is an automated welding process which achieves high deposition rate.SAW includes a solid incessant bare electrode wire and a blanket of powdered flux.The flux accumulated is of enough depth to submerge the arc column entirely so that there is no smoke or spatter and the weld is also protected from the atmospheric gases.The load carrying capability and weld bead geometry depends on the flux used in the welding[16,17].The flux also influences the mechanical properties and microstructure of the weld metal[18-20].A few authors have used GA for welding process optimization[21-23].
RSM establishes the cause and effect relationship among the input variables and true mean responses as a two/threedimensional hyper-surfaces[2].The input variables can be optimized for good quality of weld by developing the mathematical models through the execution of experimentation following the RSM.RSM is used in the present work for designing the experimentation and also for developing relationships for predicting the hardness and geometry of the weld bead.The effects of variation in open circuit voltage,current,welding speed,and nozzle-to-plate distance on bead width,bead height,and hardness were investigated and analyzed.Later,analysis of variance(ANOVA)is also performed for further analysis and validation of experimentation.The results may be used for predicting the weld bead quality,selecting optimum process parameters quality and optimizing the welding process.
2.Materials and methods
A constant voltage fully automatic SAW machine(TORNADO SAW M-800)of 800 A,3-phase,50Hz rectifier type power source,and 3.2mm stainless steel electrode was used for the welding.Fig.1(a)and Fig.1(b)show the experimental set-up and a welded sample respectively.Weld beads were deposited using wire reel of 3.2mm as per the design matrix on the stainless steel samples of 101.6 76.2 10mm3.The samples were cleaned manually using the brush to make them dust and rust free before clamping them to the welding bed having the required earth connection.The welded samples were cleaned to make them free from slag.Avernier caliper is used to measure bead height and bead width.Every experimental run(for same inputs)was performed three times and the average bead width and height were considered as final reading to minimize the error.Hardness was measured with the Rockwell hardness tester.
Table 1 shows the welding parameters with their ranges selected for the experimentation.The minimum and maximum values of all the inputs were coded as reflected in Table 1.The experiments were designed according to the parametric approach used in the central composite design of the RSM.The response curves of the process parameters for the data are plotted.The main effects(response curves)are used for evaluating the effects of parametric variation on the response characteristics.The RSM and regression analysis were performed using MINITAB 17.

Fig.1.(a)Experimental setup used(SAW Machine)and(b)Photograph of the welded sample.
3.Results and discussion
Table 2 shows the observations recorded during experimentation as per the design matrix.The results of experiment provide insight into the influence of the process parameters on the responses.The value of bead width varies from 17.8 mm to 22.6mm,bead height varies from 2.88 mm to 4.1 mm.The maximum hardness was 44 measured on Rockwell hardness C scale.The final proposed mathematical model equations for bead height,bead width and hardness terms of coded factors are given by equations(1)-(3)respectively.

HereA=voltage,B=current,C=travel speed,D=nozzle to platedistance and in coded form these parameters are varying from-2 to+2 levels.

Table 1Welding parameters and their range.
The results indicate that an increment in voltage increases the bead width but decreases the bead height,whereas the current increment result-in the increment in bead height and no change in bead width.The bead width and height decrease with the increment in welding speed.The value of bead hardness increases with increment in current but the increment in voltage and travel speed does not have a significant influence on the bead hardness.Table 3 indicates that the predictions from the mathematical model developed and the corresponding experimental results are having a fair agreement.The design of experiment based on RSM identifies the direction in which the original design requires to move for an optimal condition.The weld pro file and hardness are response parameters which depends on the welding process parameter as reflected by the relations obtain from the RSM for optimum conditions.
Regression analysis and ANOVA was conducted for establishing the linear relations between the response variables and input variables and also for confirming the reliability of the experimental results.The results of regression analysis will also ensure that the results obtained from RSM are adequate.The adequacy of the RSM results will be judged by comparing them with results of regression analysis and verification experiment.The bead hardness obtained by the regression analysis is given in equation(4).

Table 2Experimental results of the response characteristics.
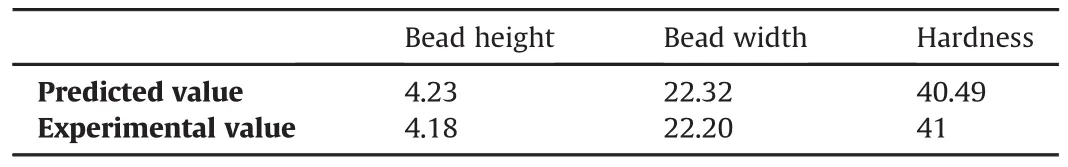
Table 3Verification of mathematical model.
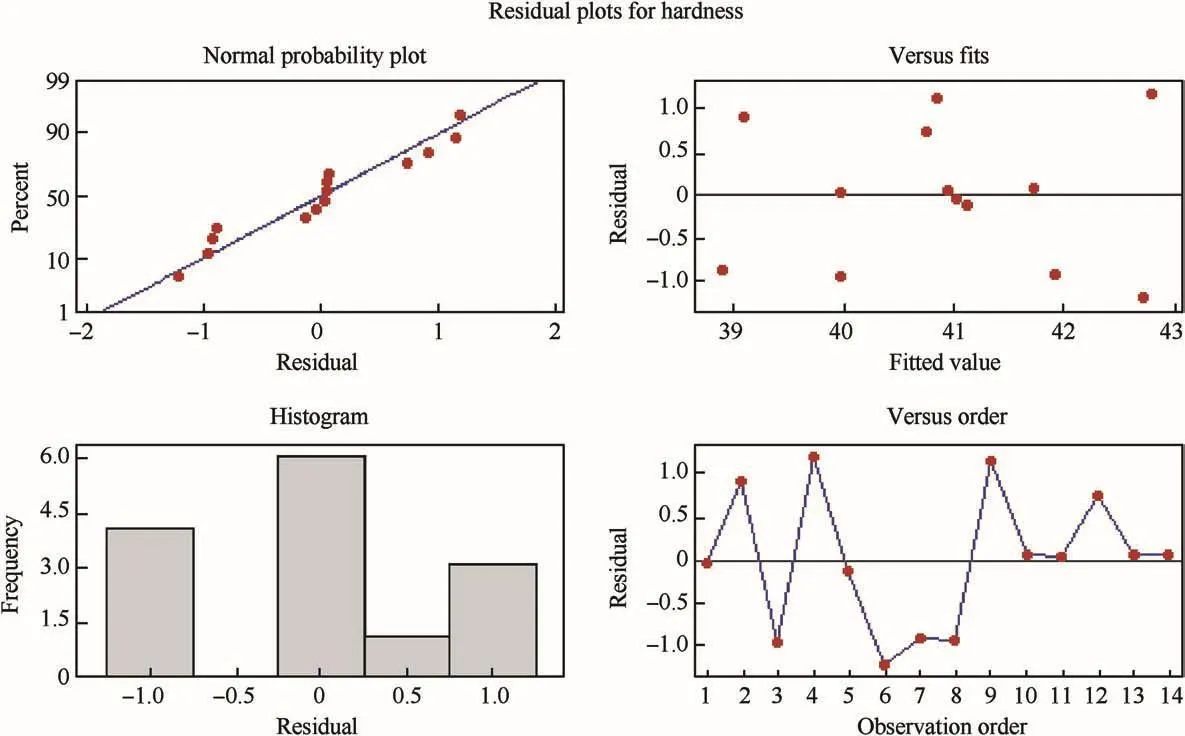
Fig.2.Residue plots for bead hardness.

Fig.3.Residue plots for bead height.
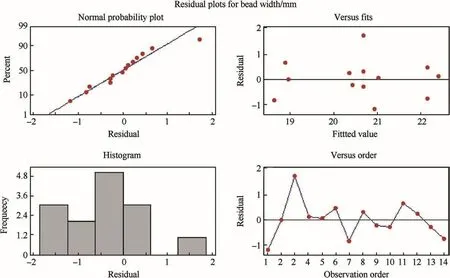
Fig.4.Residue plots for bead width.


ANOVA and residue plots(Fig.2)for hardness clearly shows that pencil thickness test is nearly qualified but residues have variation up to an extent,thus equation(3)will be giving a better prediction,as have better fit to the data,then equation(4)which shows the linear relationship of the bead hardness on input factors.Experiment for verification has reflected same.
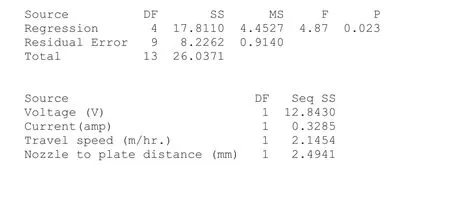
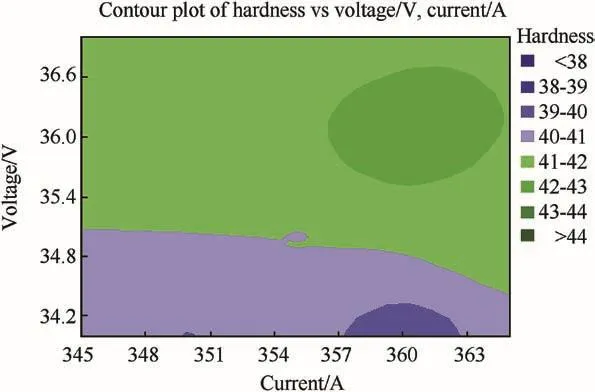
Fig.5.Contour plot of hardness vs voltage,current.
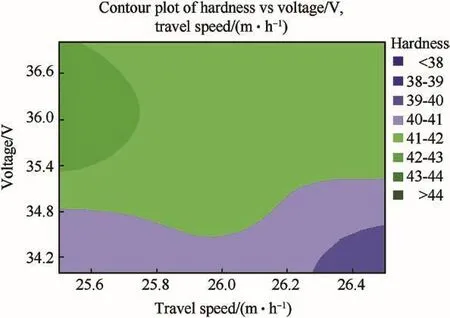
Fig.6.Contour plot of hardness vs voltage,travel speed.
Equation(5)shows the relation between the bead height and all input parameters.


ANOVA and residue plots(Fig.3)for bead height clearly shows that pencil thickness test is qualified and residues have variation within a considerable range,thus equation(5)may give the comparable results to equation(1)in simplified form.The regression analysis also reflects that the variation in weld height is comparatively(with hardness)linear to the input parameters.Experiment for verification has reflected same.


Fig.7.Contour plot of hardness vs voltage,nozzle to plate distance.

Fig.8.Surface plot of hardness vs travel speed,nozzle to plate distance.
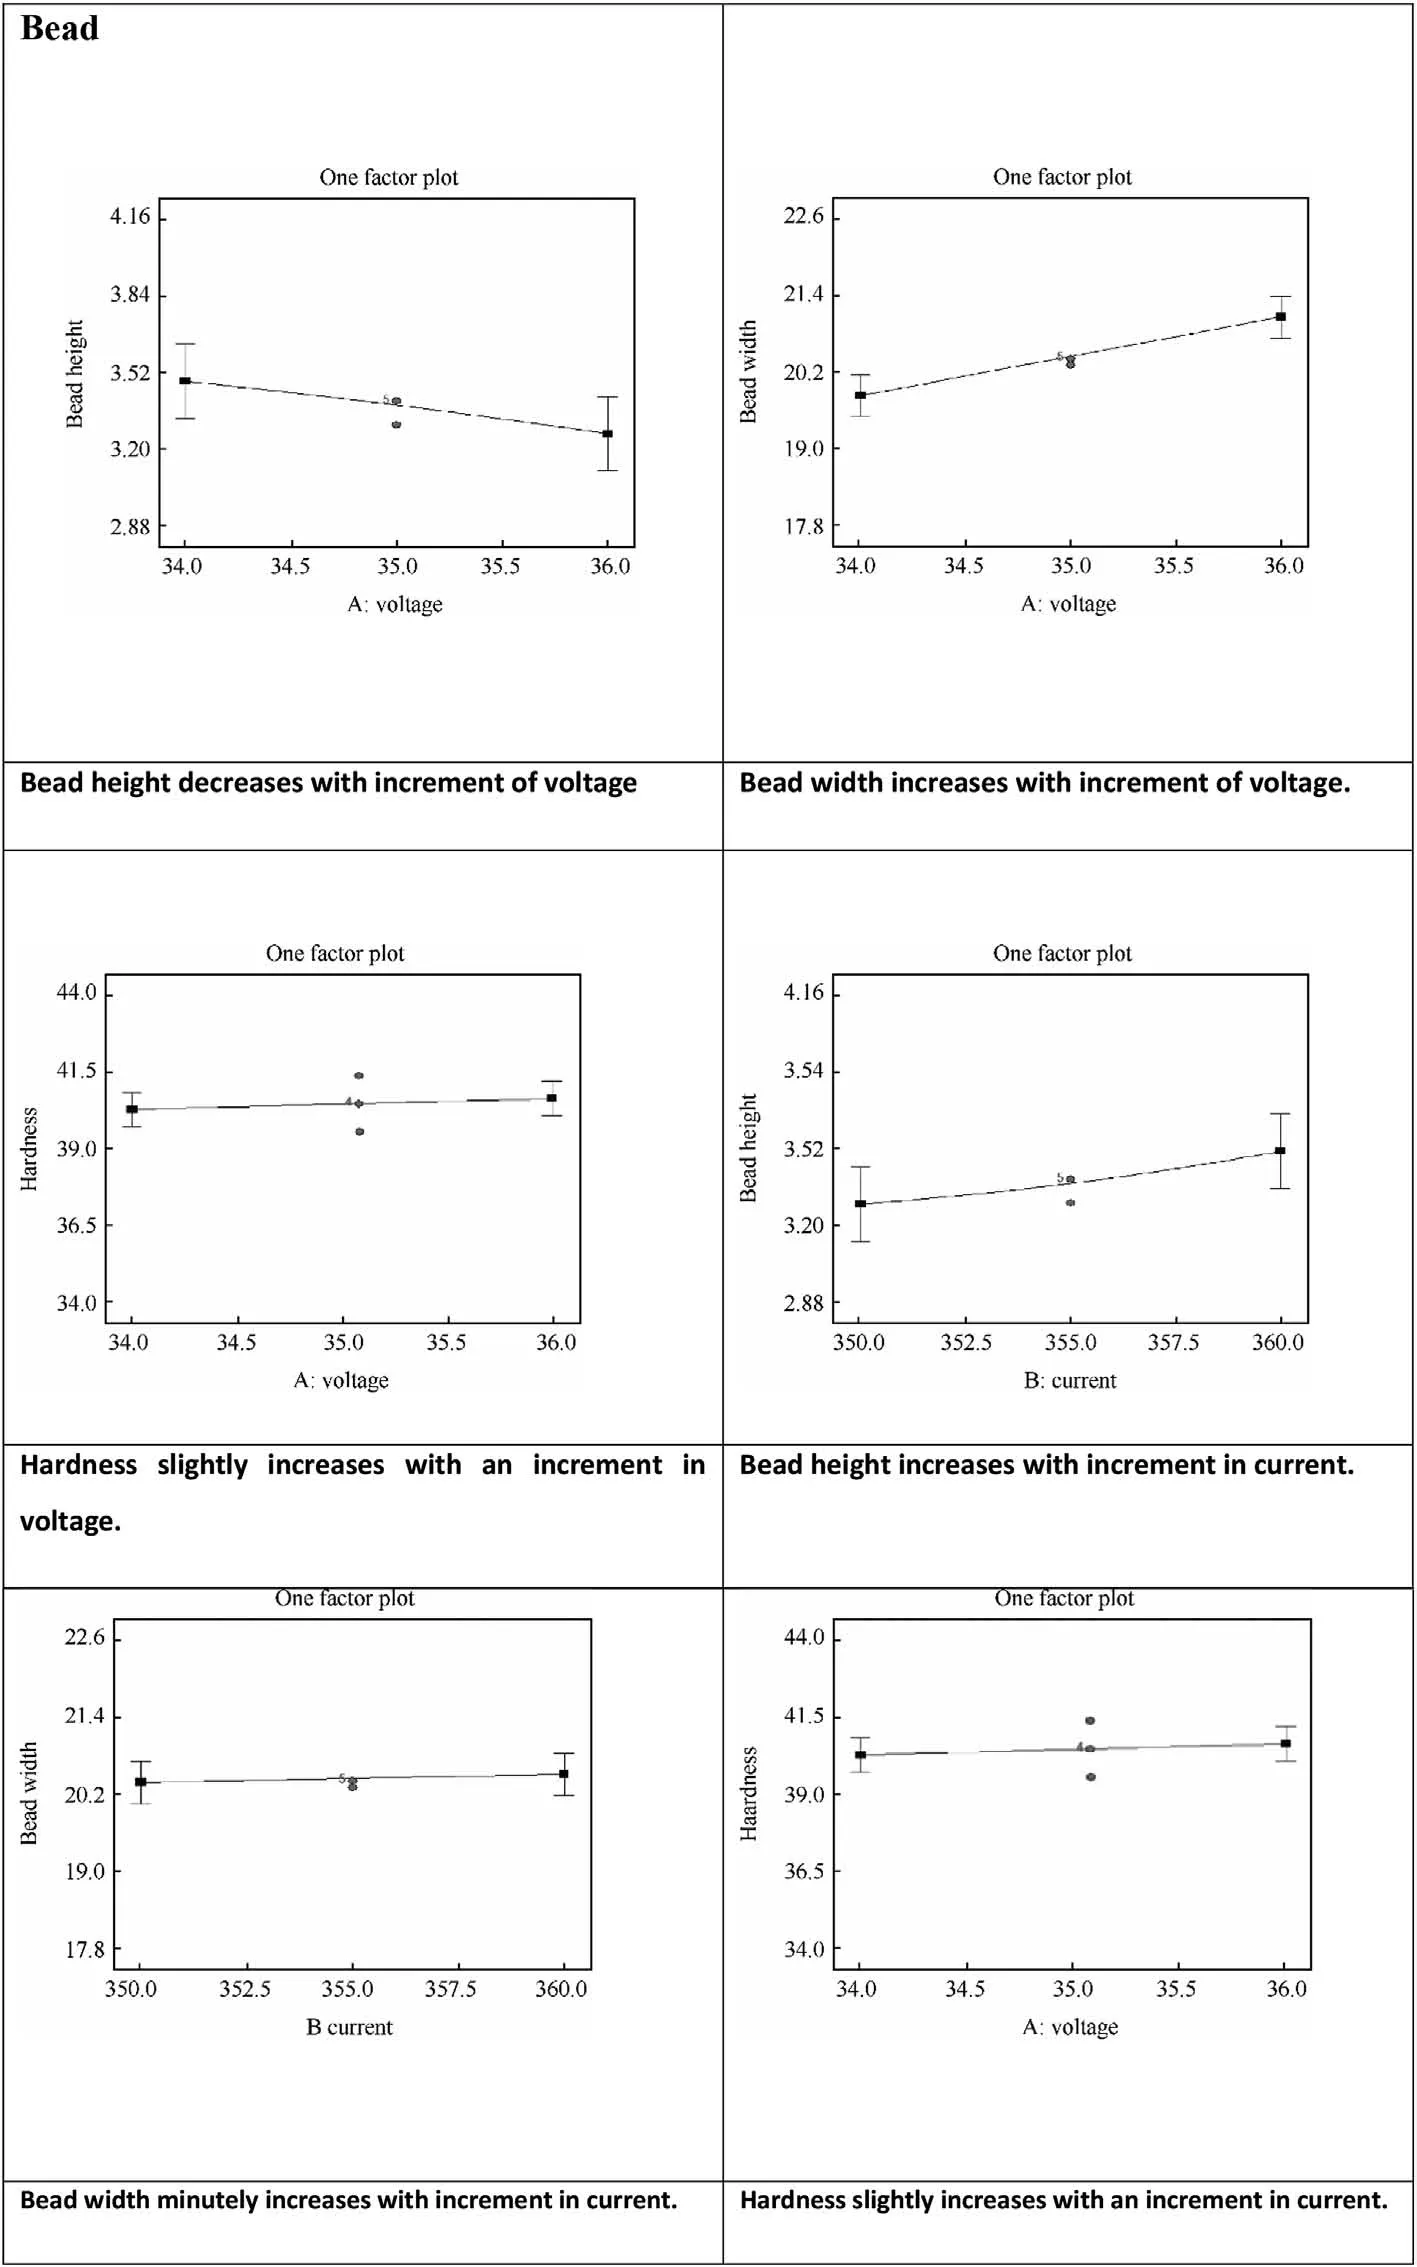
Table 4Effect of current and voltage change on bead height,bead width and hardness.

Fig.9.Procedure of GA to optimize SAW process parameters.

Fig.10.Procedure of GA to optimize SAW process parameters.

Fig.11.Mutation of a gene in developed GA for near optimal weld bead width.
Equation(6)shows the relation between the bead width and all input parameters.

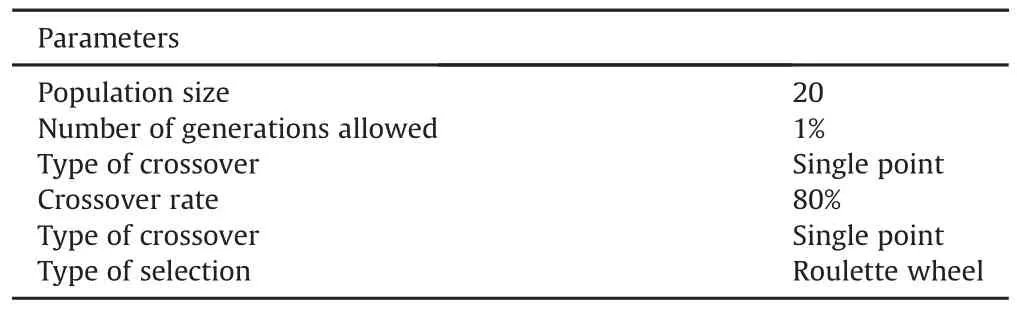
Table 5Parameters for GA computations.
ANOVA and residue plots(Fig.4)for bead width clearly shows that pencil thickness test is qualified and residues have variation within a considerable range,but the polynomial equation obtained from RSM was a better measure for bead width as verified by the verification experiment.

Here,Rshows an observation having the large standardized residual.The ANOVA represents that the error during the experimentation is within specified limits.
Fig.5 represents the contour plot of hardness vs voltage,current.It clearly represents that lower range of voltage(34.1-34.3V)and higher range of current(357-363 Amp)results in minimum hardness.Fig.6 represents the contour plot of hardness vs voltage,travel speed.It reflects that higher range of voltage(35.4-37 V)and lower range of travel speed(25.5-25.7m/hr)results in maximum hardness.Fig.7 represents the contour plot of hardness vs voltage,nozzle to plate distance.It shows that higher range of voltage(35.4-37 V)and lower range of nozzle to plate distance(30-31 mm)results in maximum hardness.Fig.8 represents the surface plot of hardness vs travel speed,nozzle to plate distance.It represents the various combinations of shows that lower value of travel speed and lower value of nozzle to plate distance results in maximum hardness.Table 4 includes the one-factor plots of the influence of voltage and current change on bead height,bead width and hardness and also the explanation of the plots.
Fig.9 shows the procedure of GA application for optimizing SAW process.The initial population(individual)represents the possible solutions of an optimization problem.The present work includes the possible solution based on the voltage,current,nozzle to plate distance,and speed.The GA requires determination of the fitness function for determining the survival of every individual.The present study utilized standard GA procedure for optimization which includes.
1.Determination of the objective function (bead width minimization)
2.Determining the factors influencing the objective function in the system.
3 Formulation of experimental/analytical model
4 Objective function formulation with reference to Eq.(2).
5 Establishing the constraints,345≤welding current≤365
33≤arc voltage≤37
25≤welding speed≤27
28≤nozzle to plate distance≤36

Table 6GA results.
The optimum point is assumed to be in the established range of process variables.Firstly,the initial population is formed utilizing the process parameters.Further,the arbitrary solutions are determined for the bead width.The fitness function of every individual is then determined utilizing the objective function for the present populations.The crossover,reproduction,and mutation are utilized for determining the subsequent generation of the latest population.Secondly,the selection is performed by rotating the roulette wheel a number of times and the selected individuals are stored in the mating pool.After the selection process,the crossover is performed in which two strings(parents)and an arbitrary location(crossover site)is randomly selected in both strings and the parts of the strings subsequent the crossover sites are interchanged from the parent strings for forming the offspring strings.Fig.10 shows an example of crossover(singlepoint)used in GA,where two mating chromosomes are cut and exchanged between the two parents.For protecting the good strings,the mutation rate is kept low.The uniform mutation includes, firstly,selection of a division of the vector entries of the individual by an algorithm is performed such that every entry has an equal probability of being mutated.Further,the every chosen entry is replaced by an arbitrary number by an algorithm selected consistently from the series for the selected entry.Fig.11 shows the gene mutation.The crossover rate,population size,and mutation rate decide the performance of an algorithm.
The higher crossover rate or a large population size permits examination of the solution space and decreases the probability of settling with a poor solution.Table 5 shows the GA computations parameters.The mutation rate and crossover rate are chosen as 1%and 80%respectively.The objective function value for last ten generations is constant which reflect the optimum value.Table 6 clearly reflect that the result predicted by GA is close enough to the practical value obtained during experimentation.Fig.12 shows that both the GA and RSM have predicted the weld bead geometry effectively;thus,can be used as the potential method for establishing the relationship of process parameters and weld bead geometry in the SAW process.
4.Conclusions
The process parameters were determined for the optimum weld bead width,bead height and bead hardness in the SAW process using RSW,regression analysis,and GA.It was found that weld parameters significantly affect the response variables selected for the study.The results reflect that an increment in voltage increases the bead width but decreases the bead height,whereas the current increment result-in increment in bead height and no change in bead width.The increment in welding speed result-in decreased bead width and height.With an increment in the nozzle-to-plate distance,the bead width decrease,but bead height increases.The bead hardness increases with current but voltage and travel speed do not have a significant persuade on the hardness.The predictions from the mathematical model developed by RSM and the corresponding experimental results are having a fair agreement.The regression analysis,ANOVA and residues plots indicate that error is with-in considerable limits,but the verification experiments confirmed that polynomial relations of response parameters from RSW is having the better fit to data and thus the closer results to experimentation when compared to the relations obtained from the regression analysis.
The effect of diameter of electrode on weld pro file and hardness can be evaluated in the further study.The present study could be extended further in future if the results obtained from RSW are compared with the experimental design using Taguchi approach also with an artificial neural network.

Fig.12.Comparison of weld bead width.
Acknowledgments
Present work is supported by PEC University,Punjab and Invertis University,Bareilly,(U·P.),India.
[1]Parmar RS.Welding processes and technology.New Delhi:Khanna Publishing Company;1997.
[2]Montgomery DC.Design and analysis of experiments.Singapore:John Wiley Pvt.Ltd;2001.
[3]Houldcraft P,John R.Welding and cutting.A guide to fusion welding and associated cutting processes.New York,NY:Industrial Press Inc;1989.
[4]Chandel RS,Seow HP,Cheong FL.Effect of increasing deposition rate on bead geometry of submerged arc welds.J Mater Process Technol 1997;72:124-9.
[5]Pandey ND,Bharti A,Gupta RS.Effect of submerged arc welding parameters and fluxes on element transfer behaviour and weld metal chemistry.J Mater Process Technol 1994;40:195-211.
[6]Tsai HL,Tarng YL,Tseng CM.Optimisation of submerged arc welding process parameters in hard facing.Int J Adv Manuf Technol 1996:402-6.
[7]Tarng YS,Yang WH,Juang SC.The use of fuzzy logic in the Taguchi method for the optimisation of the submerged arc welding process.Int J Adv Manuf Technol 2000:688-94.
[8]Lucia Vera,Brito Othero de,Jacobus Cornelis Voorwald Herman,Neves Nasareno das,Bott Ivani de S.Effects of a postweld heat treatment on a submerged arc welded ASTM A537 pressure vessel steel.ASM International MEPEG 2001:249-57.
[9]Tarng YS,Juang SC,Chang CH.The use of grey-based Taguchi methods to determine submerged arc welding process parameters in hard facing.J Mater Process Technol 2002;128:1-6.
[10]Ana M a,Paniagua-Mercado,Estrada-Diaz Paulino,Lopez-Hirata Victor M.Chemical and structural characterization of the crystalline phases in agglomerated fluxes for submerged-arc welding.J Mater Process Technol 2003;141:93-100.
[11]Borle SD,Gall LE,Mendez PF.Primary chromium carbide fraction control with variable polarity.Weld J 2015;94:1-7.
[12]Toma RE,Brandi SD,Souza SE.Comparison between DC(+)and square wave AC current outputs to weld AISI 304 for low temperature applications.Weld J 2011;90(9):153-60.
[13]L.U Y.I,Chen,Shi YU,Xiangrong LI,Jinsong Chen,Kvidahl LEE,Zhang Ming YU.Double electrode arc welding process:principle,variants,control and developments.J Manuf Process 2014;16(1):93-108.
[14]L.U Y.I,JinSong Chen,Zhang Ming YU,Kvidahl LEE.Predictive control based double electrode submerged arc welding for fillet joints.J Manuf Process 2014;16(4):415-26.
[15]L.U Y,Zhang YM,Kvidahl L.Heat input reduction in fillet welding using by pass and root opening.Weld J 2013;92(12):390s-400s.
[16]Jian LUO,Yaling Dong,Longfei LI,Xiaoming Wang.Microstructure of 2205 duplex stainless steel joint in submerged arc welding by post weld heat treatment.J Manuf Process 2014;16(1):144-8.
[17]Gunaraj V,Murugun N.Application of response surface methodology for predicting weld bead quality in submerged arc welding of pipes.J Mater Process Technol 1999;88:266-75.
[18]Datta S,Bandyopadhyay A,Pal PK.Grey based Taguchi method for optimization of bead geometry in submerged arc bead-on-plate welding.Int J Adv Manuf Technol 2008;39:1136-43.
[19]Pandey ND,Bharati A,Gupta SR.Effect of submerged arc welding parameter sand fluxes on element transfer behavior and weld metal chemistry.J Mater Process Technol 1994;40:195-211.
[20]Dallam CB,L.I.U.S,Olson DL.Flux consumption dependence of micro structure and toughness of submerged arc HSLA weldments.Weld J 1994:140-51.
[21]Correia DS,Goncalves CV,Sebastiao Junior SC,Ferrares VA.GMAW welding optimization using genetic algorithms.J Braz Soc Mech Sci Eng 2004;26:29-33.
[22]Gunaraj V,Murugan N.Prediction and optimization of weld bead volume for the submerged arc process-part 1.Weld J 2000:286-94.
[23]Pe′rez Pozo Luis,Fernando Olivares Z,Orlando Duran A.Optimization of welding parameters using a genetic algorithm:a robotic arm-assisted implementation for recovery of Pelton turbine blades.Adv Mech Eng 2015;7(11):1-17.
杂志排行
Defence Technology的其它文章
- Effects of ply orientation and material on the ballistic impact behavior of multilayer plain-weave aramid fabric targets
- Effect of magnesium on FOX-7 and its tautomers-A DFT treatment
- Influence of welding consumables on tensile and impact properties of multi-pass SMAW Armox 500T steel joints vis-a-vis base metal
- Effect of functional composite coating developed via sulphate and chloride process parameter on the UNS G10150 steel for structural and wear mitigation in defence application
- Virtual ballistic impact testing of Kevlar soft armor:Predictive and validated finite element modeling of the V0-V100probabilistic penetration response
- Pitting and stress corrosion cracking studies on AISI type 316N stainless steel weldments