Virtual ballistic impact testing of Kevlar soft armor:Predictive and validated finite element modeling of the V0-V100probabilistic penetration response
2018-07-06GauravNilakantanSuzanneHornerVirginiaHallsJamesZheng
Gaurav Nilakantan,Suzanne Horner,Virginia Halls,James Zheng
aTeledyne Scientific&Imaging,Thousand Oaks,CA 91360,USA
bProgram Executive Office Soldier,Fort Belvoir,VA 22060,USA
1.Introduction
Aramid(e.g.Kevlar,Twaron)woven fabrics are used in body armor systems for extremity protection and as backing for the ceramic torso plates.The penetration response of armor is probabilistic and represented by aV0-V100curve that describes the probability of complete fabric penetration(0-100%)as a function of projectile impact velocity(V).Sources of intrinsic and extrinsic statistical variability such as filament and yarn moduli and tensile strengths,inter-yarn friction,projectile impact location relative to the weave,and projectile trajectory contribute to the fabric probabilistic penetration response and the characteristic zone of mixed results(ZMR)that is observed during experimental testing[1].The ZMR is the regionbetween the lowest penetrating shot velocity(VP)and highest non-penetrating shot velocity(VNP)such thatVP<VNP.Two metrics often used to assess and compare the performance of body armor systems are the back-face signature(BFS)andV50velocity.The maximum allowable BFS,which determines if the armor provides sufficient protection against behind-armor blunt trauma(BABT)is 44mm for 80%of all test shots at a 95%confidence level,and it should never exceed 50 mm[2].TheV50velocity,which represents the projectile impact velocity that has a 50%probability of completely penetrating the armor target,can be estimated from a relatively few number of test shots(e.g.less than a dozen).However theV50metric is not a very informative parameter.Instead,velocity performance metrics at the tail of theV0-V100curve,such as theV1orV0.1velocity,provide a better metric for armor applications,but require a large number of test shots to estimate with confidence.The precise probability level(e.g.0.1%,1%)used as the metric is determined based on acceptable risk.
For the past few decades,a slew of finite element studies have utilized fiber-level[3-7],yarn-level[8-16],and membrane-level[17-19]models to simulate the ballistic impact response of woven fabrics(primarily plain-weave Kevlar fabrics)as well as the transverse impact response of single yarns.In the fiber-level yarn and fabric models,individual fibers are discretized using 1D elements(e.g.trusses)and 3D elements(e.g.hexahedral solids).All the fibers within the yarn may be individually modeled(e.g.all 400 fibers of a 600 denier Kevlar KM2 yarn[6])or only a subset of the fibers(19 of the 400 fibers[3])depending on the intended resolution and computational requirements.In the yarn-level fabric models,individual warp and fill yarns are discretized using 1D elements(e.g.trusses),2D elements(e.g.shells),and 3D elements(e.g.tetrahedral and hexahedral solids).In the membrane-level fabric models,the entire woven fabric ply is homogenized and discretized using 2D elements(e.g.membranes,shells).Typically,rate-insensitive orthotropic linear elastic material models are employed for the fibers and yarns of single-layer fabric models,however viscoelastic and elastic-plastic material models have also been utilized depending on available experimental data for model input.Yarn failure is typically modeled using element erosion based on a longitudinal tensile strength failure criterion,which is a reasonable assumption for single-layer fabric targets impacted by non-sharp projectiles at velocities between theV1andV99velocities.However at very high velocities(»V99)and for multi-layer fabric models, fiber and yarn transverse shearing and crushing failure modes need to be accounted for.Further details about these models are available in various review articles[20-23].A decade ago,the high computational cost of yarn-level fabric models fully discretized with 3D finite elements limited the size of fabric targets modeled to a single ply of~10 cm×10 cm;however currently available high speed computing infrastructure enables the simulation of massive 3D yarn-level fabric finite element models(>300M degrees of freedom)that are representative of realistic sized fabric ballistic test packs,such as 24 plies of 38 cm×38 cm[1].
The entirety of the aforementioned finite element studies of fabric impact are deterministic and therefore incapable of generating a ZMR and aV0-V100curve.These deterministic models cannot shed light on how sources of material,geometry,and testing variability that are inherent in all composite fabric armor systems affect the probabilistic penetration response.Furthermore,some of these sources of stochastic variability are coupled with each other and interact differently depending on the impact scenario[24,25].Thus,from the perspective of predictive virtual testing meant to reduce or replace dependence on experimental testing and from the perspective of practical armor design,such deterministic models of fabric impact are insufficient.The usefulness of these deterministic models is limited to studying qualitative deterministic trends while investigating the parametric effects of material,weave architecture,projectile characteristics,and target fixturing.The emphasis here is on general qualitative trends as opposed to precise quantitative predictions,therefore there is less scrutiny on model accuracy and the choices of input data and simplifying assumptions.Such insight is still useful in contributing to the overall understanding of the mechanisms of energy dissipation,deformation,and failure for various fabric target impact scenarios.
A much more challenging task lies in the quantitative validation of a deterministic model,that can accurately predict numerical results corresponding to performance metrics such asV50velocity,residual projectile velocity,fabric dynamic deflection,and time required to arrest the projectile.For rigorous quantitative model validation,the choice of input data,assumptions,and methodologies becomes critical.In terms of quantitative deterministic predictions,two fabric impact studies in particular by Chocron et al.[26]and Wang et al.[3]have presented validation of their deterministic fabric models by comparing experimentalV50data with numerical deterministicV50predictions,and then claimed the model predictions to be accurate.However,as discussed below,the reported validation does not appear to be consistent or rigorous and therefore cannot be considered an indicator of the predictive capability of these reported models;underscoring the exceedingly challenging nature of the problem of modeling predictive and quantitatively accurate fabric impact dynamics.
In the first example,Chocron et al.[26]used a yarn-level fabric finite element model to study the ballistic impact response of a multi-layer Kevlar fabric target,wherein each yarn was discretized with only two solid elements across the yarn width(i.e.diamond shaped yarn cross-section)based on their previous findings with single-yarn transverse impact studies.However,those findings do not necessarily translate from a single-yarn model to a fabric model as the problem of single-yarn transverse impact essentially reduces to a 1D wave propagation problem that could be modeled and solved with any arbitrary yarn cross-sectional shape.In a woven fabric with interlacing yarns that interact with each other via frictional sliding and rotations,and load transfer mechanisms,the yarn cross-section needs be sufficiently discretized to capture the smooth elliptical orsinusoidal cross-sectional shape(e.g.Duan[27],Rao[10],Nilakantan[24]),which cannot be accomplished with only two elements across the yarn width.Chocron et al.[26]then reported scaling their fabric finite element model size to match the experimental fabric areal density.This step is deemed unnecessary with an appropriately modeled virtual fabric microstructure and consistently assigned homogenized yarn material densities as demonstrated later in Section 2.2.1.For their multi-ply fabric model,Chocron et al.[26]sourced the input material data from various experimental data published by other research groups[10,28].Properties such as the yarn transverse compression modulus,transverse shear modulus,inter-yarn and inter-layer friction become important with multi-layer targets especially with the highly non-linear transverse compression behavior of multi-layer targets[29,30],through-thickness wave propagations,and the presence of multiple fiber and yarn failure modes such as transverse shear failure and fiber crushing.Whereas for singlelayer woven fabric targets,a simple linear-elastic orthotropic set of yarn properties and a simple tensile failure criterion often suffices.Therefore,Chocron's selection of yarn properties from the literature[10,28]were not representative of the complexities of a multi-layer fabric target.Furthermore,the choice of yarn tensile strain to failure(and correspondingly yarn tensile strength)in Chocron's model that was sourced from the literature[10,28]did not account for the weaving strength degradations that are observed in the Kevlar fibers and yarns extracted from woven Kevlar fabrics,and also did not consider that the warp and fill fibers and yarns are degraded in strength to different extents[31,32].Obviously the choice of yarn tensile strength is a critical determinant of the penetration response of the fabric during ballistic impact.Chocron's model did not address the issue of ply nestling and packing together observed in multi-layer fabric targets which is obviously not of concern in single-layer targets.Instead,Chocron's multi-layer fabric target was simply a replica of an individual ply copied multiple times and then stacked vertically with some small gap between each ply.The experimental ballistic testing conducted and reported by Chocron et al.[26]to validate their fabric finite element model acknowledged fabric slippage from the clamped edges.This is not a well set up experimental test to begin with,as boundary slippage is well known to significantly affect(incorrectly bias)the fabric ballistic impact response[33,34].To remediate this,they used a fabric finite element model with free edges,however this already ensures an inconsistent comparison between experimental and simulation results because the impact event is wave dominated.The longitudinal stress waves that propagate along the yarns interact very differently with a perfectly clamped boundary than a free boundary[24,33,35](and boundaries with arbitrary extents of slippage lie somewhere within these two extremes);resulting in a different state of yarn stresses at the impact site in turn affecting the fabric strain energy dissipation and instant of yarn failure.Chocron et al.[26]also report using a different sized fabric model than the experimental targets to save computational time.In spite of these several factors,Chocron et al.[26]presents numerical deterministicV50velocities for the multi-layer Kevlar fabric target against three different projectiles(0.30 cal FSP,9-mm,.357 Magnum)that are quite close to the experimentalV50velocities.For e.g.,they reported an experimental 420m/s and a numerical 425 m/sV50velocity for the 0.30cal FSP projectile case.Thus,the reported validation by Chocron et al.[26]points to numerous inconsistencies that have not been adequately explained and justified in support of this model.
In the second example,Wang et al.[3]used a fiber-scale fabric model called the ‘digital element approach’to simulate the ballistic impact of a single-ply,fully-clamped Kevlar fabric target impacted by a spherical projectile.Wang sourced input material data(i.e.Kevlar KM2 fiber tensile strengths)for the ‘digital’ fibers in the fabric model from experimental single- fiber data published by another research group[36].However this experimental data corresponded to virgin Kevlar fibers extracted from a 850 denier Kevlar KM2 spool,which is not representative of the fiber tensile strengths of fibers extracted from woven fabrics as it is well known that weaving degrades Kevlar fiber and yarn tensile strengths,moreover that the warp and fill fibers and yarns are degraded to different extents[31,32].In addition,the Kevlar fabric(Hexcel Schwebel Style 706)used in the experimental impact testing of Weerasooriya et al.[37]and Schiffman and Wetzel[38]that were in turn used for the validation of Wang's model utilized 600 denier Kevlar KM2 yarns.Wang's model assumed perfectly clamped boundaries with zero slippage and compared their numerical results to experimental V50data from Schiffman and Wetzel[38],however the experimental data corresponded to fabric targets that demonstrated noticeable boundary slippage during testing,thereby resulting in inaccurate experimentalV50velocities that were not representative of the actual material response[33].Wang et al.[3]then reported a range of numericalV50velocities for several test cases that matched the experimentalV50velocities up to a single decimal point precision.For e.g.Wang's estimation of the range ofV50velocity for a single-ply Kevlar S706 target was 106.3-111.3 m/s(stopped-penetrated)with the experimentalV50velocity at 106.3m/s.With the several aforementioned factors,it appears the model results may have simply been calibrated in some form to match the experimental results.It is also unclear why Wang et al.[3]reported a range for their numerical(deterministic)V50velocity instead of a single impact velocity as the transition point between the non-penetrations to penetrations is very clearly de fined for deterministic impact simulations.Whereas,for probabilistic simulations and for actual experimental test shot data,the transition point is not clearly de fined,instead as explained earlier,there is a zone of mixed results(ZMR).
Somewhat recently,Nilakantan et al.[24,39-41]introduced a new class of probabilistic woven fabric finite element models that mapped in experimentally-characterized sources of statistical variability into the fabric model such as statistical yarn tensile strengths.Following a procedure similar to experimental testing,a series of impact simulations at varying projectile impact velocities was then executed to determine the numerical fabricV0-V100curve.This was the very first time a yarn-level fabric finite element model could successfully generate a ZMR and aV0-V100curve.However,Nilakantan's work was not experimentally validated at the time and therefore could not be considered quantitatively predictive.Nilakantan's probabilistic computational framework was exercised to study qualitative trends on the effects of clamping conditions,projectile size and shape,inter-yarn friction,and yarn strengths on theV0-V100response of single-ply Kevlar targets.Later,Wang et al.[4]adapted Nilakantan's method of mapping statistical strengths to their digital-element fiber-scale fabric model and used it to make numericalV0-V100predictions of a circular-shaped,single-ply,fullyclamped Kevlar S706 fabric target impacted by a 0.22cal spherical projectile.However,Wang's numericalV0-V100curve significantly overestimated the experimentalV0-V100curve.Wang et al.[4]then applied a somewhat arbitrary 20%strength degradation to both the warp and fill fiber strengths without adequate justification,to mimic the effects of weaving strength degradations;however this still did not resolve the discrepancy in theV0-V100curve,pointing to the presence of other factors or inconsistencies that are as yet unresolved.
To date,there is no predictive and validated finite element simulation capability for woven fabrics modeled at the yarn-level that can accurately predict the experimentalV0-V100curve.This serves as a barrier to the ultimate goal of virtual armor design and testing that can eventually eliminate the need for costly prototyping and experimental testing of current and conceptual fabric armor weaves and materials.In this paper,we present the world's first such capability,considering the exemplary case of a single-ply,fully-clamped Kevlar S706 fabric target impacted bya 0.22 cal 17-gr FSP projectile,and demonstrate that the finite element modeling framework can accurately predict the experimentalV0-V100curve.We also reportthe experimental data and its statistical analysisthat has been used for model input as well as model validation that can serve as a benchmark for future works.
2.Material and methods
2.1.Experimental testing
2.1.1.Fabric and target construction
Kevlar Style 706 greige fabric(CS-811 finish)is used in this study(JPS Composite Materials,Lot Number4825,Roll Number 0482500101).The fabric areal density is 183.43 g/m2with an approximate thickness of 0.282 mm and a yarn span of 0.747mm in the warp and fill directions.The nominal denier of the warp and fill Kevlar KM2 yarns is 600.Each yarn is comprised of 400 approximately circular filaments of nominal diameter 12 micron and density 1.44 g/cm3.Fig.1 displays the steps in the preparation of the individual fabric targets.203.2 mm×203.2 mm fabric plies are marked and cut from the roll.A single ply is then sandwiched between two aluminum picture frames on whose faces self-adhesive abrasive anti-slip tape has been applied in order to eliminate boundary slippage during testing.The assembled fabric target is then aligned within the steel test fixturing comprised of two thick plates bolted together,with a torque of 35.3 N-m applied to each bolt.The exposed fixture window,which corresponds to the exposed fabric target is 101.6 mm×101.6 mm.For a few of the 39 prepared targets,the boundary lines(i.e.the four straight edges of the exposed target)and the center lines(i.e.the two intersecting orthogonal lines that form a cross at the middle of the exposed target)are marked with a black marker.This is to ensure zero fabric boundary slippage during testing(by observing the boundary lines post-test)and to make sure the projectile impacts the fabric around its dead center(byaligning the laser targeting cross-hairs of the gas gun with the center lines).Any fabric boundary slippage during experimental testing,no matter how small,will detrimentally bias the fabric impact performance and result in a poor test[33].All experimentally tested fabric targets in this study demonstrated zero fabric boundary slippage and the impacts were consistently around the fabric dead center.
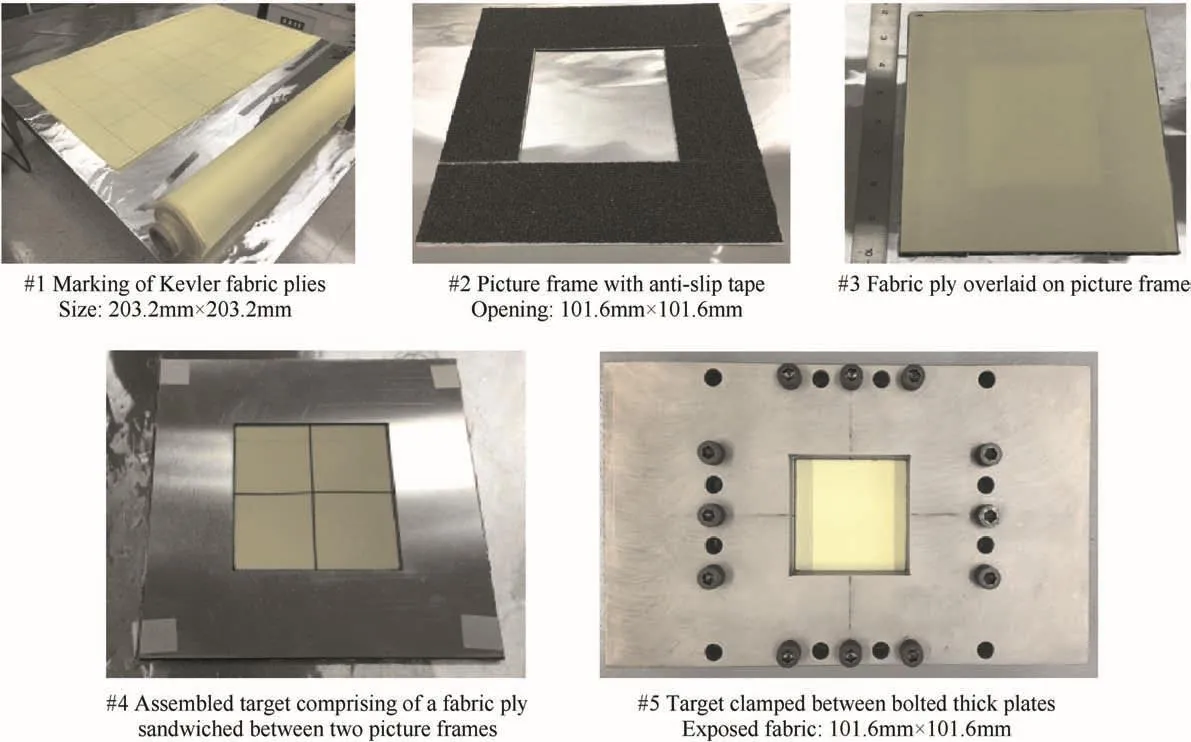
Fig.1.Preparation of fabric target and test fixturing.
2.1.2.Ballistic impact testing
Fig.2 displays the ballistic test range.Two high speed cameras(Photron FASTCAM SA5)are positioned towards the side and on top of the test fixture to measure the projectile impact and residual velocities using high speed video analysis.The side camera was operated at 705×520 pixels@20,000 fps(frames per second)while the overhead camera was operated at 448×728 pixels@20,000 fps.The simultaneous use of two cameras enables the tracking of oblique and curved projectile trajectories in 3D space.The use of high speed video also provides a definitive categorization of a penetrating versus a non-penetrating event during testing,in contrast to using the witness-bag method where it may not always be clear.A third high speed camera at the rear provides a close-up around the impact site of the rear face of the target to observe yarn deformation and failure.The 0.22 cal(actual diameter 5.461 mm,actual length 6.142 mm),17-gr(actual mass 1.096g),alloy steel(grade 4340)FSP projectile is launched from a smooth bore gas gun.Gated velocity sensors at the tip of a barrel also provide a projectile velocity,as a check to the value obtained from the high speed video image analysis.Laser cross-hairs at the end of the barrel are used to target the intended point of impact.
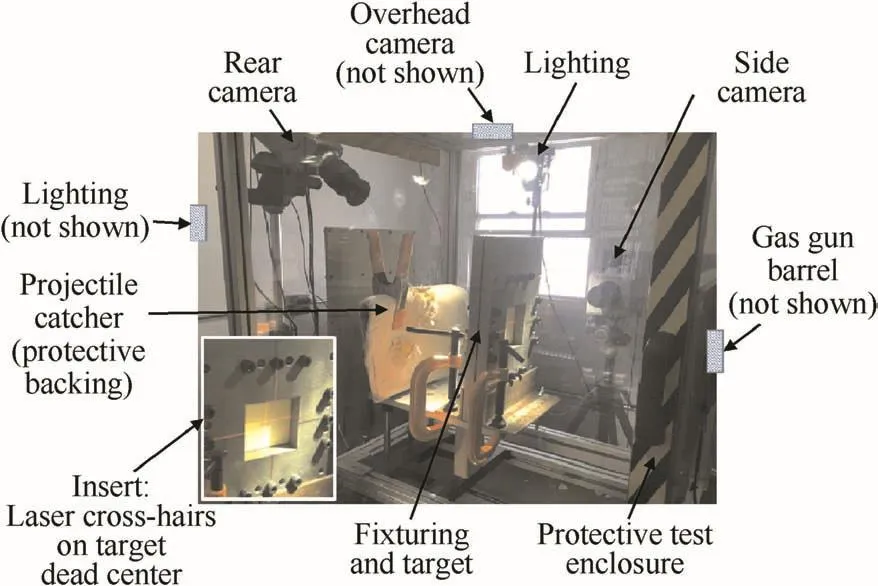
Fig.2.Ballistic test range.
A total of 39 test shots were conducted at varying impact velocities.Each fabric target was shot once at the center.At the end of each test,the outcome(penetration=1,non-penetration=0)was recorded along with the projectile impact velocity(Vi),and residual velocity(Vr)in the case of penetrations.A statistical analysis was then conducted using SenTest(Neyer Software LLC[42])to determine theV0-V100curve,represented by a Normal distribution with the mean(μ)representing theV50velocity.Fig.3 displays a close-up around the impact site of the strike and rear faces of an exemplary post-test fabric target that resulted in a non-penetration at an impact velocity(Vi)of 119.75m/s.For reference,the experimentalV50velocity is 120.98 m/s.The strike face shows an imprint of the FSP projectile as seen in Fig.3a,however no yarn failure can be observed with the naked eye.It is possible however that some fibers within the yarns may have been damaged by the sharp edges of the projectile.The rear face of the fabric target shows a slight residual bulge around the impact site as seen in Fig.3(b),but there are no other distinguishing characteristics.Fig.4 displays a penetrated fabric target with aViof 135.85 m/s and aVrof 65.18 m/s.Both the strike and rear faces show failed yarns protruding fromthe weave with the individual filaments within the yarns spread apart and appearing entangled with each other.However a closer visual inspection with the naked eye reveals relatively clean and sharp fiber fracture surfaces.This is a likely consequence of the flat faces and sharp edges of the FSP projectile.Further investigations of the experimental fabric targets and failed yarns such as conducting scanning electron microscope(SEM)studies of single fractured filaments and counting the number of partially and fully failed warp and fill yarns within each fabric target is outside the scope of the present study and left to future work.The complete set of experimental impact testing results such as theV0-V100curve,Vi-Vrvelocities,and projectile exit trajectories are displayed in Figs.10-14 and discussed in Section 3.

Fig.3.Post-test exemplary non-penetrated fabric target:Vi=119.75 m/s(a)strike face(b)rear face(as a reference scale,note the yarn span is 0.747mm).
2.1.3.Statistical yarn and fabric properties
One of the sources of statistical variability considered in this study is the yarn tensile strength.Based on the dimensions of the exposed fabric target,a series of quasi-static(0.0083s-1)single yarn tensile tests(end-tabbed specimens)were conducted on fabric-extracted greige warp and fill yarns of gage length 101.6 mm using a load frame(Instron Model 5567,500 N load cell).The yarn tensile modulus and tensile strength were calculated from the test data.Fig.5 displays the results from the testing of 55 warp and 47 fill yarns.For comparison,the results from the testing of 34 spool extracted yarns of the same 101.6 mm gage length are also included.Fig.5(a)compares the tensile modulus,which exhibits some variability,as indicated by the coefficient of variation,CV,which is the ratio of the standard deviation(σ)to the mean tensile yarn modulus(μ)expressed as a percentage.Fig.5(b)compares the statistical yarn tensile strengths.Each color symbol in Fig.5(b)(i.e.o,x,+)is a median rank and represents one yarn tensile test.These median ranks,ranging from 0 to 1,represent the cumulative probability of yarn failure(y-axis)at a particular tensile stress level(x-axis),and can also be interpreted as the cumulative fraction of yarns within a population(y-axis)that have a particular yarn strength or less(x-axis).Equation(1)lists the calculation of median ranks using Benard's approximation.
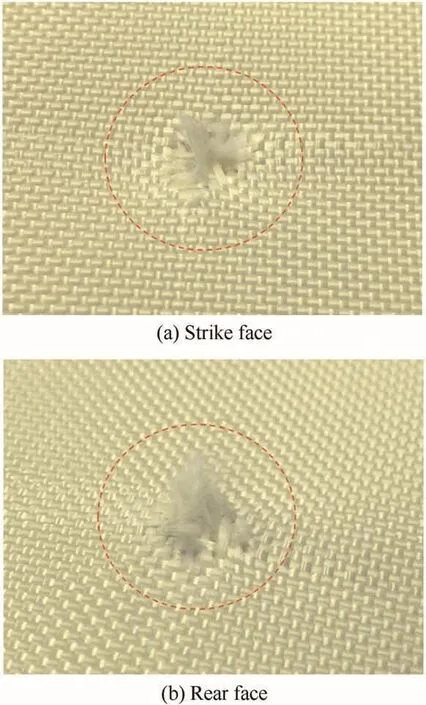
Fig.4.Post-test exemplary penetrated fabric target:Vi=135.85m/s,Vr=65.18 m/s(a)strike face(b)rear face(as a reference scale,note the yarn span is 0.747mm).

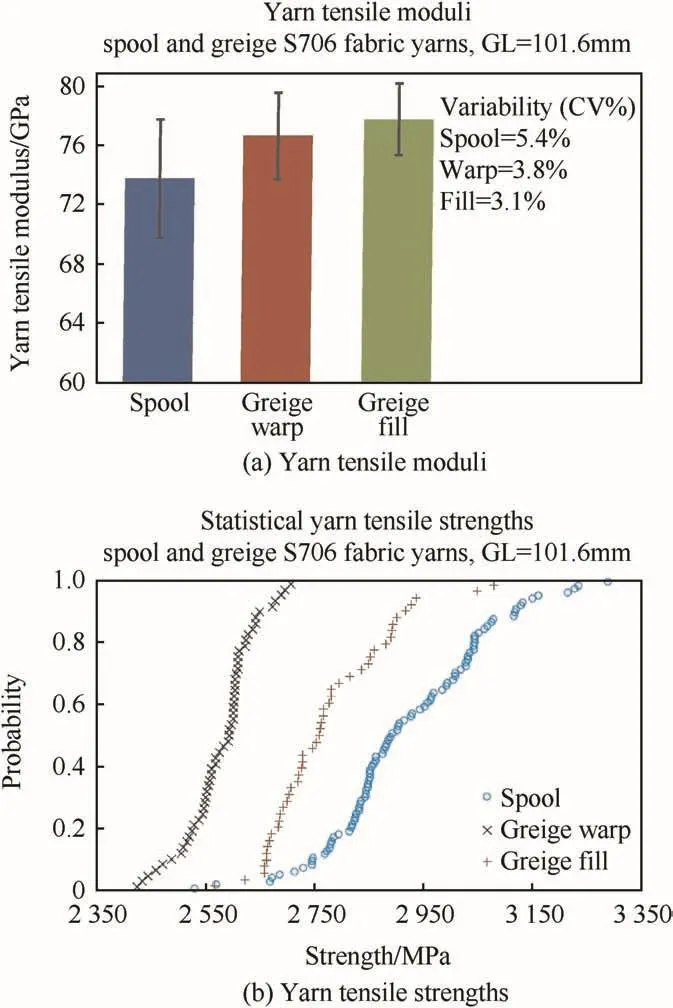
Fig.5.600 denier Kevlar KM2 yarn properties at a gage length of 101.6 mm(a)Yarn tensile moduli(b)Yarn tensile strengths.
whereNrepresents the total number of yarn specimens tested andirepresents the yarn specimen number sorted from lowest to highest strengths.
Due to weaving effects,both warp and fill yarns are degraded in strengths(i.e.yarn strength distributions shift leftward in Fig.5(b))with the warp yarns showing greater weaving degradations.Table 1 lists some of the statistics of the raw experimental data sets of the greige yarn tensile modulus and strength.Further details are available in Nilakantan et al.[32].Another source of variability considered in this study is the inter-yarn frictional interactions.These have been previously experimentally characterized by Nilakantan et al.[43]using single yarn pull-out tests at varying rates from Kevlar S706 fabric patches under varying pre-tensions.These statistical inter-yarn frictional interactions were then shown by Nilakantan et al.[25]to have significant effects on the probabilistic fabric impact performance considering partially clamped singlelayer Kevlar S706 fabric targets.
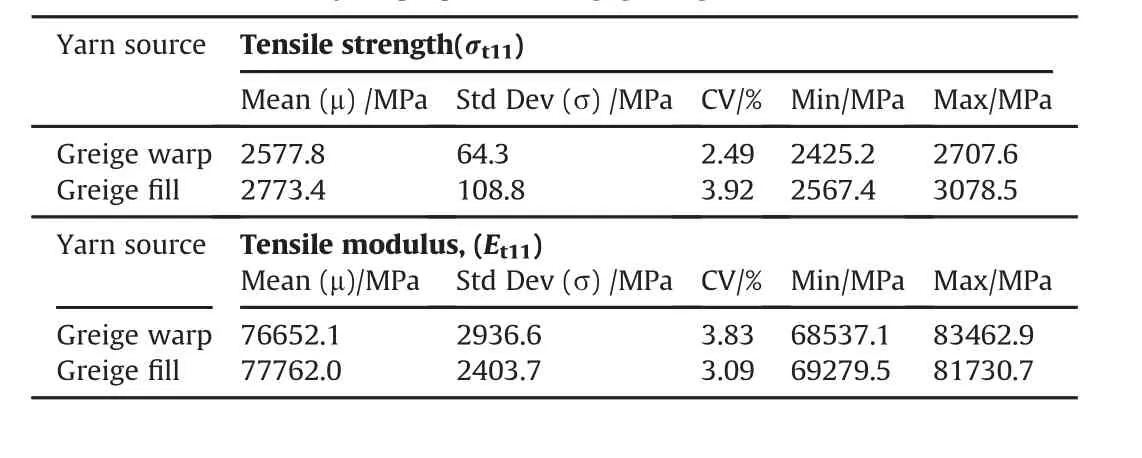
Table 1600 denier Kevlar KM2 yarn properties at a gage length of 101.6 mm.
2.2.Finite element modeling
2.2.1.Virtual microstructure and virtual test setup
Fig.6a displays optical cross-sections of the greige fabric warp and fill yarns with the corresponding FE mesh.Detailed validation of the experimental and virtual microstructures using image analysis is available in Nilakantan et al.[44].This validation includes a comparison of fabric thickness,warp and fill yarn width and thickness,warp and fill yarn cross-sectional area and aspect ratio,warp-warp yarn gap,and warp and fill yarn fiber packing fraction.The yarns are discretized with single-integration point 3D hexahedral elements.Four elements are used across the yarn width to sufficiently capture the yarn cross-sectional shapes.One element is used through the yarn thickness to prevent the yarns from developing bending stiffness as the yarns are essentially bundles of single fibers with negligible bending stiffness.The yarns are assigned an orthotropic linear elastic material model.The precise details of the material model are provided later in this section.Experimental Kevlar KM2 yarn tensile testing has previously shown a linear elastic stress-strain relationship[32].The yarn material model is assumed to be rate-insensitive.Experimental single fiber testing has previously shown that the tensile strengths of Kevlar fibers do not exhibit significant strain-rate effects[45].Equation(2)lists the yarn material model orthotropic elastic stress-strain relationship in the compliance form.
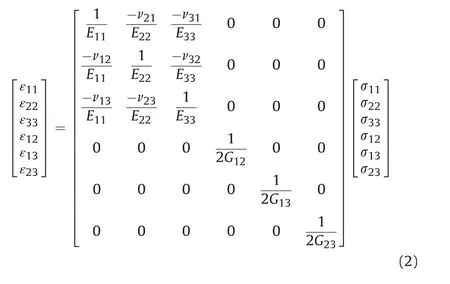
where 11 represents the yarn longitudinal axis(follows the undulating yarn centerline),22 and 33 represent the yarn transverse axes.
Based on the experimental test data(see Table 1 and Fig.5(a)),each warp and fill yarn in the fabric FE model is assigned a different tensile modulus(Et11).This process is further described in Section 2.2.2.The yarn transverse moduli(E22,E33)are set at 600 MPa,approximately two orders of magnitude smaller than the yarn longitudinal tensile modulus to represent the minimal stiffness of fered by the fiber bundle to transverse compression[10,24,46].The three Poisson ratios(ν12,ν13,ν23)are set to zero[46],which decouples the longitudinal and transverse direction responses and results in the of f-diagonal terms in Equation(2)becoming zero.During transverse yarn compression,the individual fibers initially simply redistribute themselves(i.e.spread apart)within the yarn without developing lateral strains.To capture a similar effect in a homogenized continua(i.e.yarn)that represents this bundle of fibers,it becomes essential to set the Poisson ratios to zero.The three shear moduli(G12,G23,G13)are set to 800MPa.Once again,the choice of a small stiffness approximately two orders of magnitude smaller than the yarn longitudinal tensile modulus is based on the minimal resistance offered by the fiber bundle to shear deformations[10,24,46].However from a numerical perspective,the shear moduli also need to be sufficiently large enough to prevent element hourglassing during yarn deformation.The particular selections made of the yarn transverse and shear moduli are applicable for the single-ply Kevlar fabric target in this study,however it should be noted that much work is still needed to determine appropriate values for multi-ply Kevlar fabric targets wherein non-linear yarn transverse compression and transverse shear effects become important determinants of the penetration response.This is the focus of future work.
Yarn failure is modeled using element erosion based on a maximum longitudinal tensile stress failure criterion(σ11≥σt11).Here,σt11represents the yarn tensile strength and is obtained from the experimental test data shown in Table 1 and Fig.5(b).Each warp and fill yarn in the fabric FE model is assigned a different tensile strength,this process is further described in Section 2.2.2.It should be noted that experimental yarn tensile strength data corresponding to 101.6 mm gage length warp and fill yarn specimens was utilized in the fabric FE model because the experimental and numerical fabric targets in this study are 101.6 mm×101.6 mm in size.This ensures a consistent set of input data keeping in mind that previous experimental testing has shown that the Kevlar KM2 yarn tensile strength is dependent on the gage length[32].

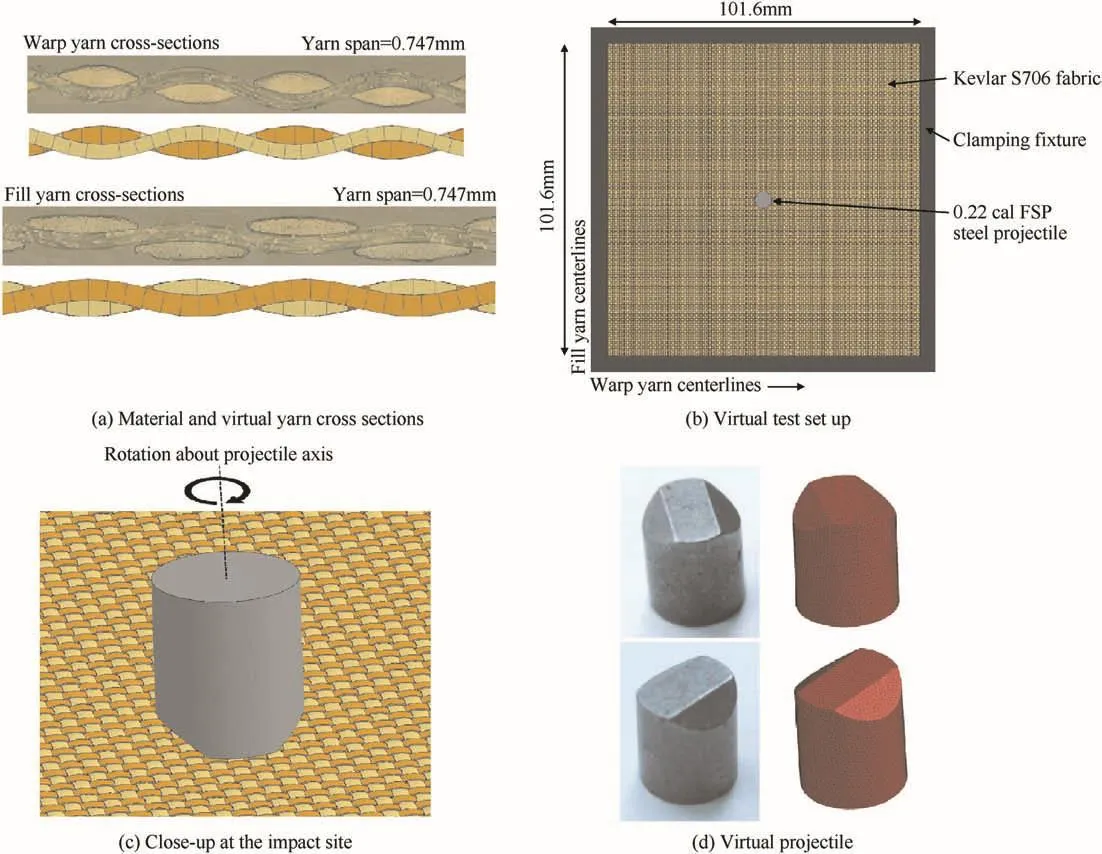
Fig.6.Finite element models(a)Material and virtual yarn cross sections(b)Virtual test set up(c)Close-up at the impact site(d)Virtual projectile.
A user-de fined material model(UMAT)was implemented as a Fortran sub-routine in LS-DYNA®(LSTC)for the homogenized Kevlar yarns.A key feature of this UMAT was the dynamic updating of the solid element's material density,tensile modulus,and tensile strength at each time-step of the impact simulation based on the instantaneous element fiber packing fraction(FPF),in turn related to the instantaneous element cross-sectional area.This ensures a consistently assigned set of material properties throughout the simulation.Previously,several studies[10,24,26,27]have used an inbuilt LS-DYNA material model(i.e.*MAT_ORTHOTROPIC_ELASTIC)along with zero Poisson ratios to represent homogenized yarns undergoing ballistic impact.A serious limitation of using this in-built material model with zero Poisson ratios is that when a homogenized yarn is transversely compressed at some region along its length,its cross-sectional area in that region is artificially reduced.That is,the cross-sectional area of the solid elements used to discretize the yarn are artificially reduced in that region.This consequently can result in premature tensile failure of the element during tensile loading unless the initially-assigned element'stensile strength(i.e.assigned at the start of the simulation)is correspondingly increased,based on the new or instantaneous FPF of the element(i.e.the FPF will increase as the element cross-sectional area is artificially decreased).Another consequence is the artificial increase in the initially-assigned element's material density.Then,if the element's tensile modulus is not correspondingly increased,again based on the new or instantaneous FPF of the element,the longitudinal stress wave velocity becomes affected which is an issue for wave-dominated impact physics.Note that in the actual yarn material(i.e.a bundle of fibers)subjected to transverse compression,the individual fibers within the yarn cross-section initially simply redistribute themselves to assume a new yarn cross-sectional shape(and possibly a new size too,i.e.a new area encompassed by the cross-sectional peripherywhich would then implya different overall FPF);however the inherent yarn material properties do not funda mentally change,i.e.the actual yarn retains the same tensile stiffness and will fail under the same tensile load.This real-world yarn behavior must be captured by the material model used for the homogenized yarns,and the UMAT used in this study ensures that is the case.This is especially important for the yarn solid elements at the impact site underneath the projectile that undergo larger transverse compressive deformations during impact.
Fig.6(b)displays the FE setup of the impact test scenario,with a 101.6 mm×101.6 mm fabric target.While a set of clamping fixtures is modeled for visualization,the boundary nodes of the fabric model are fully constrained across all degrees of freedom to simulate a ‘perfectly-clamped’boundary.Fig.6(c)displays a closeup of the impact site along with the projectile vertical axis of rotation used to indicate the extent of projectile rotation.The default projectile orientation is with the longer dimension of the flat impact face aligned with the fill yarn centerlines(i.e.0°rotation)as shown in Fig.6c.A 90°and 270°rotation corresponds to alignment with the warp yarn centerlines.All impacts are perfectly normal to the fabric surface.During the initial impact trajectory,no dynamic rolling,pitching,or yawing of the projectile is considered(i.e.the projectile rotational orientation is kept constant).Fig.6d compares the FSP projectile with the corresponding FE mesh.The projectile is discretized with tetrahedral elements and assigned to a rigid material model(ρ=7.864g/cm3,E=210GPa,ν=0.3)as no projectile deformation was observed during the experimental testing.The mass of the projectile is accurately captured 1.096g(experimental)and 1.096g(virtual).
2.2.2.Probabilistic computational framework
The sources of experimentally characterized variability need to be mapped into the FE model in order to enable probabilistic responses.In this study,for the first time, five sources of statistical variability have been simultaneously incorporated into the FE model.They are(a)statistical yarn tensile strength(b)statistical yarn tensile modulus(c)statistical inter-yarn friction(d)random projectile impact location(e)random projectile rotation.The sources(a-c)are considered as ‘intrinsic’sources of variability as they are inherent to the actual material being tested.The sources(d-e)are considered as ‘extrinsic’sources of variability as they are related to factors external to the actual material being tested such as the projectile and experimental test methodology.Note,that both intrinsic and extrinsic sources of variability must be considered in the probabilistic analysis as they relate to the actual material and its application.There are other ‘extraneous’sources of variability,such as fabric boundary slippage,that erroneously influence or bias the probabilistic response and therefore must be eliminated.In this study,we eliminated all fabric boundary slippage during experimental testing by using the special target construction described in Section 2.1.1,and consequently the fabric boundaries were modeled as perfectly-clamped in the FE model as described in Section 2.2.1.
The simultaneous incorporation of five sources of statistical variability is a major improvement over previous studies that only considered yarn tensile strength as the source of statistical variability along with constant(deterministic)values of yarn tensile modulus and inter-yarn friction coefficient[39,40].Fig.7(a)displays an exemplary mapping(based on 1 of the 39 generated fabric FE models)of the experimental statistical greige warp and fill yarn tensile strengths(see Fig.5(b)),after first being scaled by the respective FPFs,onto the individual warp and fill yarns of the fabric FE model.In this mapping process,random numbers are used to query the experimental statistical test data and determine the tensile strength assigned to eachyarn.That is,eachyarn is assigned a random number between 0 and 1 which is then compared with the median ranks for each set of statistical yarn strengths(see Fig.5(b))in order to determine the particular yarn tensile strength assigned to that yarn.A custom script coded in Matlab®(Math-Works)is used for this mapping process.To verify the mapping process,a histogram of assigned tensile warp and fill yarn strengths is generated for each fabric FE model,scaled back to its original value by eliminating the FPF factor,and then compared to the experimental yarn strength distributions.As shown in Fig.7(b),the mapping process has been correctly implemented for 3 randomly selected fabric FE models of the total 39 generated fabric FE models wherein each has a unique mapping.Once the strengths have been mapped,the corresponding greige warp and fill yarn tensile modulus is selected and mapped onto the yarns,since each experimental yarn tensile test provides one combination of yarn tensile strength and modulus.One such exemplary mapping of the greige warp and fill yarn tensile modulus(based on 1 of the 39 generated fabric FE models)is similarly shown in Fig.7(a).
Fig.8 displays an exemplary mapping(based on 1 of the 39 generated mappings)of the statistical inter-yarn friction coefficients(μyy),again using a custom Matlab-based script.Contact definitions are created between each of the 137 individual warp and 137 individual fill yarns in the fabric FE model.Each warp- fill yarn contact pair,of which there are 1372combinations,is associated with a unique friction coefficient.The choice of inter-yarn friction coefficient is made by randomly sampling numbers within a range of 0.18±0.0324.Here,0.18 represents the baseline inter-yarn friction coefficient for Kevlar KM2.The minimum and maximum bounds selected for the range result in a standard deviation of 0.0187 and a CV of 10.4%.This CV value,which represents the variability in the statistical inter-yarn friction coefficients used for the fabric FE model mappings,lies within the experimentally characterized CV values of 8.9%to 11.5%from the single yarn pullout tests of greige Kevlar S706 fabrics reported in Nilakantan et al.[43].Unlike yarn tensile strengths which typically follow a distribution such as the 3-parameter Weibull or generalized Gamma distributions resulting in the S-shaped mapping pro file seen in Fig.7b,the inter-yarn friction coefficients are assumed to be randomly scattered and therefore result in a linear mapping pro file(seecumulative%in Fig.8).In the event of warp-to-warp and fill-tofill yarn contact,that is,two neighboring yarns of the same type contacteach other which can only happenwhen an interlacing yarn fails,a constant friction coefficient of 0.18 is used.
Fig.9 displays the random projectile impact locations used in the 39 fabric FE models generated.For each random impact location,there is also a randomly assigned projectile rotation about its vertical axis,some of which have been shown in Fig.9 for illustration.It is impossible experimentally to precisely target the exact same spot at the fabric dead center for each test shot.Based on observations of post-tested experimental Kevlar fabric targets,a window of±4 yarn spans(i.e.±2.99 mm)around the dead center of the fabric FE model was considered as the zone of possible fabric impact locations.It is also very difficult to experimentally track the precise projectile rotation just prior to impact.For each of the 39 fabric FE models,random numbers are used to generate a set of precise projectile impact locations by sampling a range of±2.99mm around the fabric dead center in each direction,and to generate a set of projectile rotations by sampling a range of 0°to 360°.The process is implemented using a custom Matlab-based script.The precise projectile impact location relative to the fabric yarns,e.g.directly on a yarn or directly at the gap between yarns,has been previously shown by Nilakantan et al.[47,48]to have a significant effect on the deterministic impact performance of single-ply fabric targets.This effect is due to the spatial variation in local fabric weave architecture that repeats over the dimension of a unit cell.However there is also inherent variability in the fabric architecture itself,such as the yarn cross-sectional shapes,yarn centerlines trajectories,and filament packing patterns within each yarn cross-section.These sources have been presently excluded from consideration in this study.
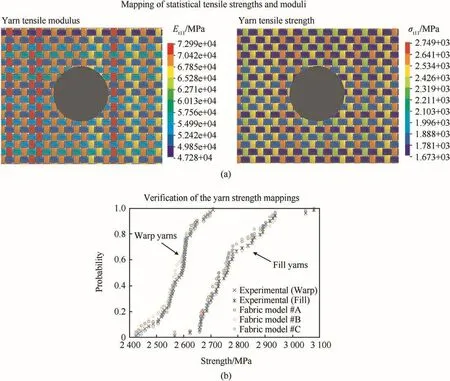
Fig.7.Mapping of statistical variability in the fabric finite element model(a)Yarn tensile moduli and strength(b)Verification of the strength mappings.
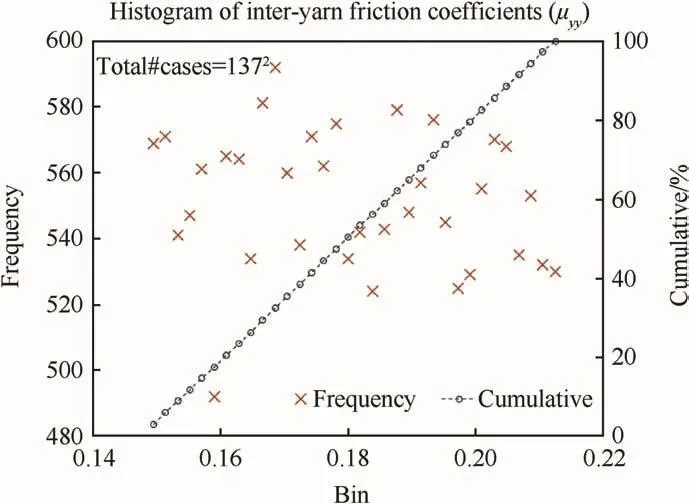
Fig.8.Histogram of inter-yarn friction coefficients during the mapping of statistical inter-yarn friction.
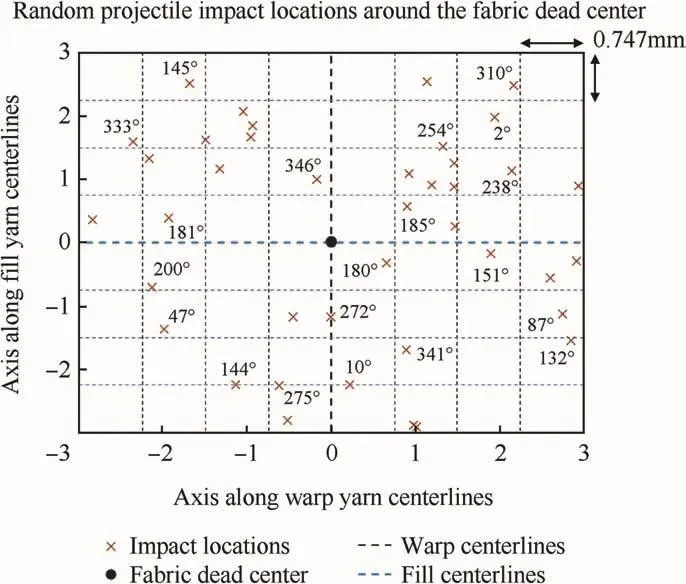
Fig.9.Random projectile rotations and impact locations around the fabric dead center.
With the mapping process completed,a FE simulation procedure very similar to the experimental procedure is adopted to generate the numerical fabricV0-V100curve for the given impact scenario.39 fabric FE models with unique mappings are created to compare against the 39 experimental fabric targets.Impact simulations are then executed on each model using LS-DYNA,with varying projectile impact velocities.Each fabric model is impacted once by the projectile around its dead center.The outcome of each test(penetration=1,non-penetration=0)along with the residual projectile velocity is used determine the next impact velocity,and finally to generate the numerical fabricV0-V100curve.During experimental testing with a single gas gun,test shots can only proceed one at a time.However computationally,multiple FE simulations representing several test shots can be executed in parallel,leading to a more efficient determination of theV0-V100curve.
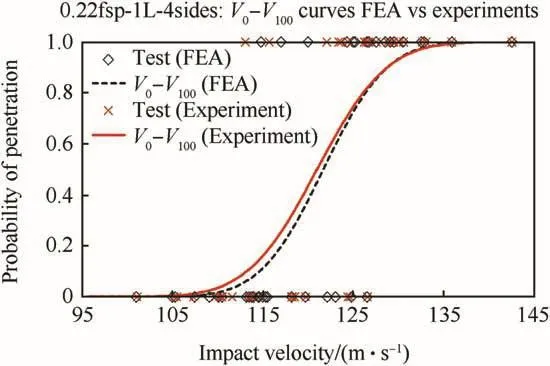
Fig.10.Comparison of experimental and numerical fabric V0-V100curves.
3.Results and discussion
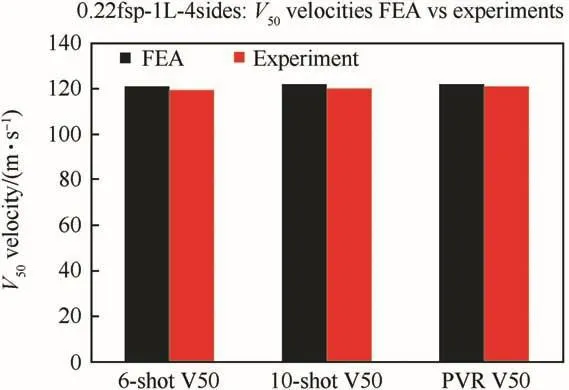
Fig.11.Comparison of experimental and numerical fabric V50velocities.
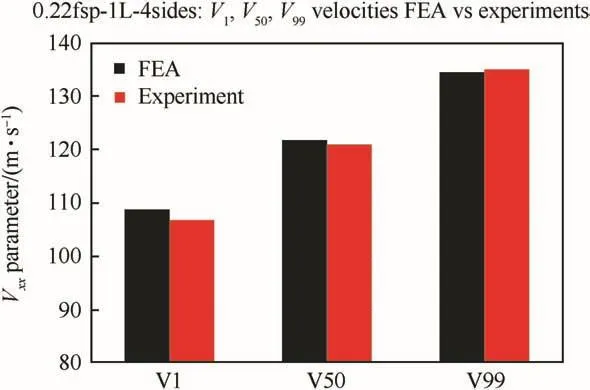
Fig.12.Comparison of experimental and numerical fabric V1,V50,and V99velocities.
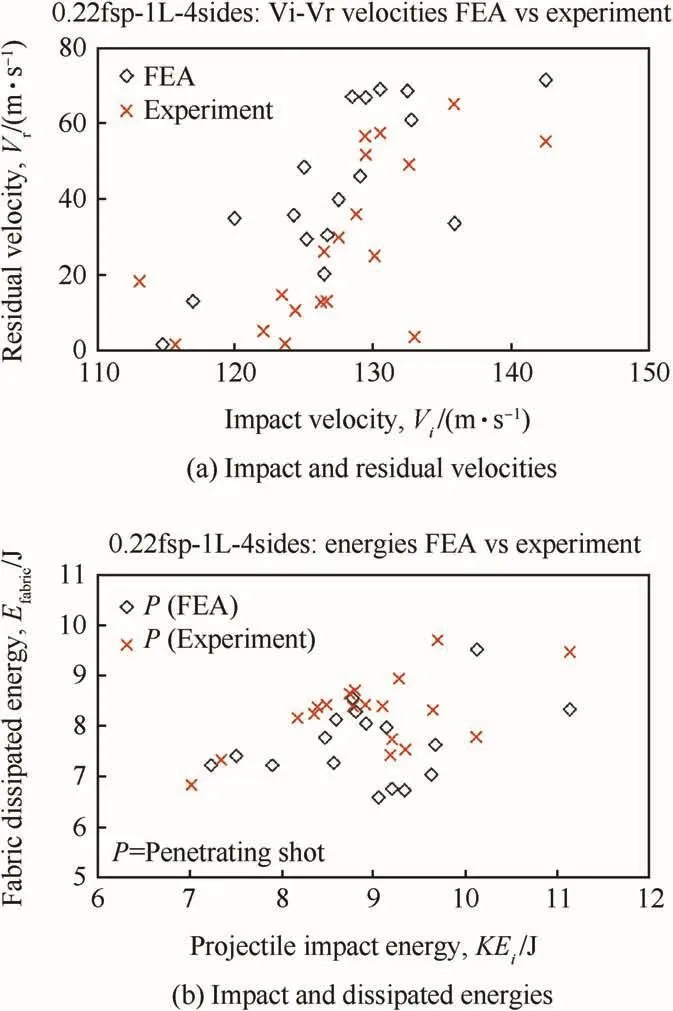
Fig.13.Comparison of experimental and numerical results(a)Impact and residual velocities(b)Impact and dissipated energies.
Fig.10 compares the experimental and numerical fabricV0-V100curves for the single-ply fully-clamped greige Kevlar S706 fabric targets impacted by a 0.22cal 17-gr FSP projectile.There is excellent agreement between both curves and this constitutes the key result or outcome of this work.Fig.10 also displays the individual test shot impact velocities used during experimental testing and FE simulations,with the non-penetrations located aty=0.0 and penetrations aty=1.0.There is excellent agreement between the highest non-penetrating impact velocity (experimentalVi=126.55 m/s,numericalVi=126.50 m/s)and between the lowest penetrating impact velocity(experimentalVi=113.09 m/s,numericalVi=114.80m/s),while the second lowest experimental penetratingViwas 115.70 m/s.Fig.11 compares the experimental and numericalV50velocities.The 6-shot and 10-shotV50velocities[49],which are two commonly used metrics,are computed from the raw experimental and numerical test data sets as follows.The 6-shotV50velocity is the average of the three highest nonpenetrating and the three lowest penetrating impact velocities.The 10-shot V50velocity is the average of the five highest nonpenetrating and the five lowest penetrating impact velocities.The‘PVRV50’corresponds to the mean(μ)of the Normal distribution that is used to generate theV0-V100curve,also called the Probabilistic Velocity Response(PVR)curve.For both the experiments and FE simulations,allV50velocities were in excellent agreement.Fig.12 compares theV1,V50,and V99velocities and once again there is excellent agreement between the experimental and FE simulation results.They are as follows in m/s(experimental,FEA):V1(106.89,108.82),V50(120.98,121.68),andV99(135.08,134.54).
Fig.13(a)compares the projectile residual velocities after complete fabric penetration as a function of the impact velocities,while Fig.13(b)displays the same set of penetrating test shots in the form of fabric dissipated energies as a function of the projectile impact kinetic energies.The fabric dissipated energy is the difference between the projectile impact and residual kinetic energies,i.e.½mp(Vi2-Vr2),wherempis the projectile mass.When interpreting and making comparisons between the experimental and FE simulation results of fig.13,whether in velocity-form(Fig.13(a))or energy-form(Fig.13(b)),the following must be carefully considered.In many previous deterministic ballistic impact modeling studies of composite armor,it is common to see researchers compare a single experimentalVrdata point to the corresponding FE simulationVrdata point for a singleVivalue,and then perhaps to repeat this comparison for a few varyingVivalues.However such comparisons are misleading.In reality,each experimental penetratingViwill result in a spread(or scatter)of experimentalVrvalues.That is,for example,the same penetratingVivelocity executed on 10 different impact targets while keeping all other parameters constant will result in 10 different experimentalVrvalues.This scatter is a consequence of the aforementioned intrinsic and extrinsic sources of material and testing variability.The extent of scatter in theVrspread typically depends on how close the penetratingViis to theV50velocity.The closer it is(e.g.within the ZMR)the greater the scatter,while cases withVi»V50andVi>V99will result in progressively lesser scatter in theVrvalues.Thus,making one-to-one comparisons of discrete(Vi-Vr)data points between experiments and FE simulation results is both misleading and inaccurate.The purpose of presenting the data shown in Fig.13 is simply to provide the reader with a sense of the overall spread in test data for both the experimental testing and the FE simulations,and to show that they are in general agreement(i.e.spatially overlapping on the plot).Furthermore,it should be noted that the FE simulations were able to capture the lowest recorded experimental projectile residual velocity from all the tests conducted,wherein the projectile barely penetrates through the fabric(lowest experimentalVr=1.93 m/s,lowest numericalVr=1.83,and note that each had differentVivalues as seen in Fig.13(a)).
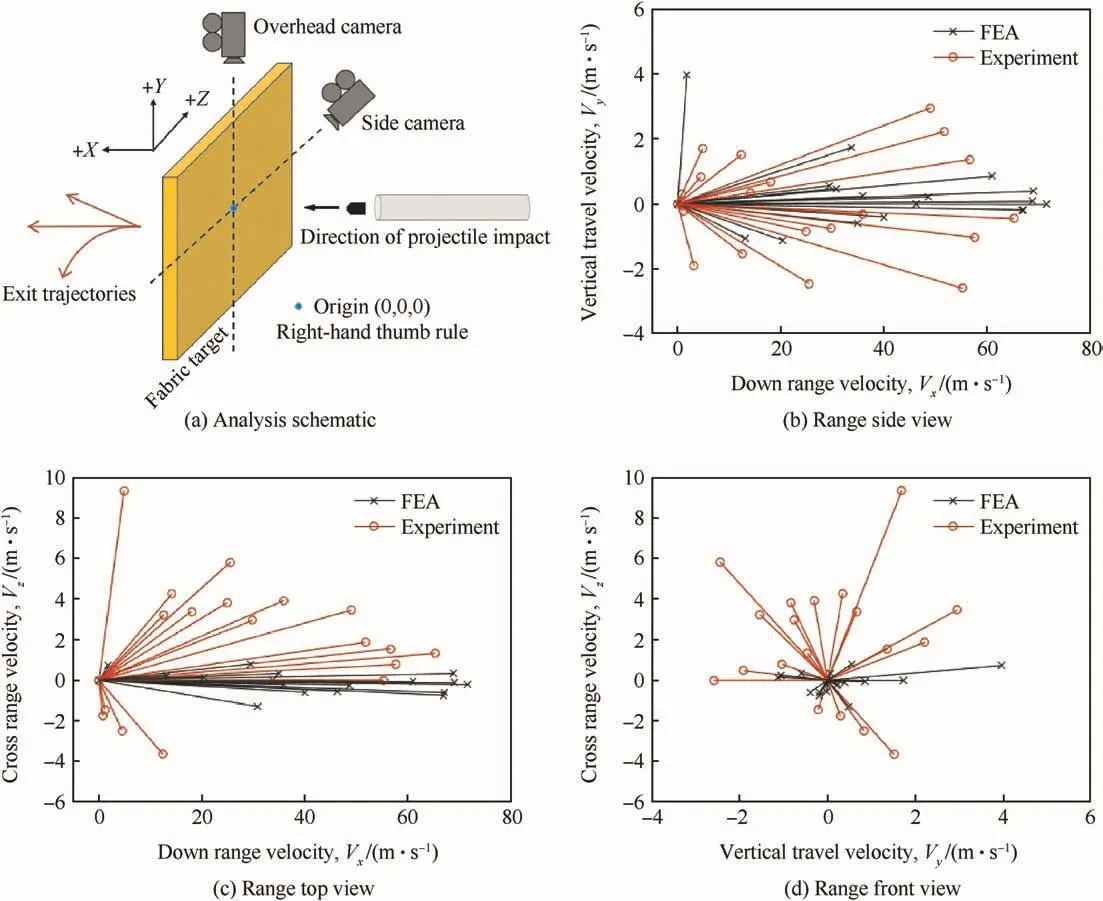
Fig.14.Comparison of experimental and numerical projectile exit trajectories(a)Analysis schematic(b)Range side view(c)Range top view(d)Range front view.
Fig.14 compares the projectile exit trajectories after complete fabric penetration.The down range velocity,Vxrepresents the direction along the gun barrel.The vertical-travel velocity,Vyand cross-range velocity,Vzrepresent the orthogonal directions on the surface of the fabric target,as schematically shown in Fig.14(a).TheVyandVzaxes in Fig.14(b-d)have been expanded for clarity,however it should be noted that the projectile exit trajectories are still relatively straight out the rear face of the fabric target.Interestingly,the FE simulations have been able to capture some variability in the projectile exit trajectories,and to our best knowledge,this is the first time that a yarn-level fabric FEA model has been shown to capture projectile exit trajectory variability as well as the first time that such direct comparisons have been made against similar experimental test data.However,the FE simulations did not capture the same extent as the more oblique exit trajectories observed experimentally,and we have identified two possible reasons.The first is the possible presence of very small projectile tilt angles or ‘yawing’(e.g.even a few degrees or less)just prior to impact.The sensitivity of this parameter could be parametrically investigated in the FE impact simulations whereas currently all impacts were assumed to be perfectly normal to the fabric surface with 0°projectile tilt.The second is the fidelity of the virtual microstructure which could affect the manner of interaction between the projectile and individual yarns at the impact site at a very local length scale,and therefore could affect how the projectile dynamically rotates,pitches,and/or yaws for the remainder of the impact event,and in turn how it exits out the back face of the fabric target.The fabric FEA model used here reasonably well represented the experimental Kevlar fabric microstructure,however not as precisely as the much higher fidelity Kevlar fabric virtual microstructure developed using the thermal growth method of Nilakantan et al.[44].These investigations are left to future work.
4.Conclusions
This work represents the world's first fully validated and predictive probabilistic penetration modeling(i.e.V0-V100response)of a woven fabric subjected to ballistic impact,utilizing a fabric finite element model with individually modeled yarns.A probabilistic computational framework and mapping methodology was defined along with the necessary critical experimental tests at appropriate length scales and the necessary statistical analyses.While the experimental validation of this probabilistic computational framework has been presented for one impact scenario(viz.fully clamped,single-ply fabric target impacted by a FSP projectile),this framework can readily be extended to other Kevlar fabric weave architectures as well as other continuous- filament woven fabrics comprised of materials such as UHMWPE(Spectra,Dyneema)and aramid(Twaron).It should be noted that a key ingredient to the success of this work stems from the generation of a comprehensive experimental test database(microstructure,material,performance)and a tightly-integrated set of experiments and models,ensuring a consistent and seamless flow of data and insights back and forth between models and experiments.
The development of predictive computational techniques that can explicitly account for the experimentally characterized sources of statistical variability and generate a validated probabilistic penetration response will be disruptive in the field of armor design and modeling.Such a virtual capability will enable the rapid exploration of a vast conceptual design space comprising fiber material and weave architecture,at a fraction of the cost of prototyping such designs and experimentally characterizing the ballistic impact response.The work presented here provides a strong step towards that direction.However there will undoubtedly lie much work ahead towards extending this framework to multi-layer fabric targets wherein several other mechanisms of deformation,energy dissipation,and failure come into play,thereby necessitating further key experiments,statistical analyses,and models;this is the focus of our future work.
Acknowledgements
This work was supported by Teledyne Scientific&Imaging(TS&I),Internal Research and Development(IR&D)and approved for public release under TSI-PP-17-08.GN gratefully acknowledges Dr.Bobby Brar(President,Teledyne Scientific Company)for his support of the IR&D and Mr.Robert Kinsler(HP White Laboratory Inc.)for his technical input on the high speed video analysis during ballistic testing.The authors declare no conflicts of interest.The views and opinions expressed herein are those of the authors and do not necessarily represent the views of TS&I or the US Government.
[1]Nilakantan G,Nutt S.State of the art in the deterministic and probabilistic ballistic impact modeling of soft body armor: filaments to fabrics.In:American society for composites 29th technical conference,San Diego,CA,USA;September 8-10,2014.
[2]Ballistic Resistance of Body Armor.National institute of justice.NIJ Standard-0101.06.2008.
[3]Wang Y,Miao Y,Swenson D,Cheeseman BA,Yen C,LaMattina B.Digital element approach for simulating impact and penetration of textiles.IntJImpact Eng 2010;37(5):552-60.5.
[4]Wang Y,Miao Y,Huang L,Swenson D,Yen C,Yu J,et al.Effect of the inter- fiber friction on fiber damage propagation and ballistic limit of 2-D woven fabrics under a fully confined boundary condition.IntJImpact Eng 2016;11(97):66-78.
[5]Grujicic M,Hariharan A,Pandurangan B,Yen CF,Cheeseman BA,Wang Y,et al.Fiber-level modeling of dynamic strength of Kevlar KM2 ballistic fabric.J Mater Eng Perform 2011.https://doi.org/10.1007/s11665-011-0006-1.
[6]Nilakantan G.Filament-level modeling of Kevlar KM2 yarns for ballistic impact studies.Compos Struct 2013;104:1-13.
[7]Sockalingam S,Gillespie JW,Keefe M.Modeling the fiber length-scale response of Kevlar KM2 yarn during transverse impact.Text.Res.J 2016.09/20;2017/08:0040517516669074.
[8]Shockey DA,Erlich DC,Simons JW.Improved barriers to turbine engine fragments.Interim report III.DOT/FAA/AR-99/8,III.2001.
[9]Duan Y,Keefe M,Bogetti TA,Powers B.Finite element modeling of transverse impact on a ballistic fabric.Int J Mech Sci 2006;48:33-43.
[10]Rao MP,Duan Y,Keefe M,Powers BM,Bogetti TA.Modeling the effects of yarn material properties and friction on the ballistic impact of a plain-weave fabric.Compos Struct 2009;89(4):556-66.
[11]Nilakantan G,Wetzel ED,Bogetti TA,Gillespie Jr JW.A deterministic finite element analysis of the effects of projectile characteristics on the impact response of fully clamped flexible woven fabrics.Compos Struct 2013;95:191-201.
[12]Ha-Minh C,Imad A,Boussu F,Kanit T,Crepin D.Numerical study on the effects of yarn mechanical transverse properties on the ballistic impact behaviour of textile fabric.J Strain Anal Eng Des 2012;47(7):524-34.
[13]Sun D,Chen X,Lewis E,Wells G.Finite element simulation of projectile perforation through a ballistic fabric.Textil Res J 2012;83(14):1489-99.
[14]Grujicic M,Bell W,Arakere G,He T,Xie X,Cheeseman B.Development of a meso-scale material model for ballistic fabric and its use in flexible-armor protection systems.J Mater Eng Perform 2010;19(1):22-39.
[15]Zeng XS,Tan VBC,Shim VPW.Modelling inter-yarn friction in woven fabric armour.Int J Numer Meth Eng 2006;66(8):1309-30.
[16]Eken S,Phoenix SL,Yavuz AK.Computational model for woven fabrics subjected to ballistic impact by a spherical projectile.In:American society for composites 31st technical conference,Williamsburg,VA,USA;September 19-22,2016.
[17]Tanov R,Tabiei A.Computationally efficient micromechanical woven fabric composite elastic constitutive models.J Appl Mech 2001:68.
[18]Ivanov I,Tabiei A.Flexible woven fabric micromechanical material model with fiber reorientation.Mech Adv Mater Struct 2002;9:37-51.
[19]Ivanov I,Tabiei A.Loosely woven fabric model with viscoelastic crimped fibers for ballistic impact simulations.Int J Numer Meth Eng 2004;61:1565-83.
[20]Cheeseman BA,Bogetti TA.Ballistic impact into fabric and compliant composite laminates.Compos Struct 2003;61:161-73.
[21]Tabiei A,Nilakantan G.Ballistic impact of dry woven fabric composites:a review.Appl Mech Rev 2008;61(1):010801-13.
[22]David NV,Gao XL,Zheng JQ.Ballistic resistant body armor:contemporary and prospective materials and related protection mechanisms.Appl Mech Rev 2009;62:1-20.
[23]Sockalingam S,Chowdhury SC,Gillespie JW,Keefe M.Recent advances in modeling and experiments of Kevlar ballistic fibrils, fibers,yarns and flexible woven textile fabrics- areview.Text.Res.J2016.05/02;2017/04:0040517516646039.
[24]Nilakantan G,Gillespie Jr JW.Ballistic impact modeling of woven fabrics considering yarn strength,friction,projectile impact location,and fabric boundary condition effects.Compos Struct 2012;94(12):3624-34.
[25]Nilakantan G,Merrill R,Keefe M,Gillespie Jr JW,Wetzel ED.Experimental investigation of the role of frictional yarn pull-out and windowing on the probabilistic impact response of Kevlar fabrics.Compos B Eng 2015;68:215-29.
[26]Chocron S,Figueroa E,King N,Kirchdoerfer T,Nicholls AE,Sagebiel E,et al.Modeling and validation of full fabric targets under ballistic impact.Composites Sci.Technol 2010;70(13):2012-22.11/15.
[27]Duan Y,Keefe M,Bogetti TA,Cheeseman BA,Powers B.A numerical investigation of the influence of friction on the energy absorption by a high-strength fabric subjected to ballistic impact.Int J Impact Eng 2006;32:1299-312.
[28]Shahkarami A.An efficient unit cell based numerical model for continuum representation of fabric systems.PhD Dissertation.Dept.of Civil Engineering,The University of British Columbia;July 2006.
[29]Raftenberg MN,Scheidler MJ,Moy P.Transverse compression response of a multi-ply Kevlar vest.Army Research Laboratory Report ARL-TR-3343.September 2004.
[30]Cheng M,Chen W,Weerasooriya T.Experimental investigation of the transverse mechanical properties of a single Kevlar KM2 fiber.Int J Solid Struct 2004;41:6215-32.
[31]Sanborn B,Weerasooriya T.Quantifying damage at multiple loading rates to Kevlar KM2 fibers due to weaving, finishing,and pre-twist.Int J Impact Eng 2014;71:50-9.
[32]Nilakantan G,Abu-Obaid A,Keefe M,Gillespie Jr JW.Experimental evaluation and statistical characterization of the strength and strain energy density distribution of Kevlar KM2 yarns:exploring length-scale and weaving effects.J Compos Mater 2011;45(17):1749-69.
[33]Nilakantan G,Wetzel ED,Merrill R,Bogetti TA,Adkinson R,Keefe M,et al.Experimental and numerical testing of the V50 impact response of flexible fabrics:addressing the effects of fabric boundary slippage.In:11th international LS-DYNA users conference,Dearborn,MI,USA;June 6-8,2010.
[34]Yu JH,Dehmer PG,Yen CF.High-speed photogrammetric analysis on the ballistic behavior of Kevlar fabrics impacted by various projectiles.Army Research Laboratory Report ARL-TR-5333.September 2010.
[35]Zhang GM,Batra RC,Zheng J.Effect of frame size,frame type,and clamping pressure on the ballistic performance of soft body armor.Composites Part B 2008;39:476-89.
[36]Cheng M,Chen W,Weerasooriya T.Mechanical properties of Kevlar KM2 single fiber.J Eng Mater Technol 2005;127:197-203.
[37]Weerasooriya T,Gunnarsson CA,Moy P.Measurement of full- field transient deformation of the back surface of a Kevlar KM2 fabric during impact for material model validation.In:Proceedings of the XIth international congress and exposition,society for experimental mechanics inc.,Orlando,FL,USA;June 2-5,2008.
[38]Schiffman BA,Wetzel ED.Low velocity ballistic characterization of high performance fabrics.Internal Report.Army Research Laboratory;2006.
[39]Nilakantan G,Keefe M,Wetzel ED,Bogetti TA,Gillespie Jr JW.Computational modeling of the probabilistic impact response of flexible fabrics.Compos Struct 2011;93:3163-74.
[40]Nilakantan G,Keefe M,Wetzel ED,Bogetti TA,Gillespie Jr JW.Effect of statistical yarn tensile strength on the probabilistic impact response of woven fabrics.Compos Sci Technol 2012;72(2):320-9.
[41]Nilakantan G,Wetzel ED,Bogetti TA,Gillespie Jr JW.Finite element analysis of projectile size and shape effects on the probabilistic penetration response of high strength fabrics.Compos Struct 2012;94(5):1846-54.
[42]Neyer BT.A D-optimality-based sensitivity test.Technometrics 1994;36(1):61-70.
[43]Nilakantan G,Gillespie Jr JW.Yarn pull-out behavior of plain woven Kevlar fabrics:effect of yarn sizing,pull-out rate,and fabric pre-tension.Compos Struct 2013;101:215-24.
[44]Nilakantan G,Cox B,Sudre O.Generation of realistic stochastic virtual microstructures using a novel thermal growth method for woven fabrics and textile composites.In:American society for composites 32nd technical conference,West Lafayette,IN,USA;October 22-25,2017.
[45]Lim J,Zheng JQ,Masters K,Chen WW.Effects of gage length,loading rates,and damage on the strength of PPTA fibers.Int J Impact Eng 2011;38:219-27.
[46]Gasser A,Boisee P,Hanklar S.Mechanical behavior of dry fabric reinforcements.3D simulations versus biaxial tests.Comput Mater Sci 2000;17:7-20.
[47]Nilakantan G,Nutt S.Effects of clamping design on the ballistic impact response of soft body armor.Compos Struct 2014;108:137-50.
[48]Nilakantan G,Nutt S.Effects of fabric target shape and size on the V50 ballistic impact response of soft body armor.Compos Struct 2014;116:661-9.
[49]Department of defense test method standard,V50 ballistic test for armor.Department of Defense MIL-STD-662F;1997.
杂志排行
Defence Technology的其它文章
- Effects of ply orientation and material on the ballistic impact behavior of multilayer plain-weave aramid fabric targets
- Effect of magnesium on FOX-7 and its tautomers-A DFT treatment
- Influence of welding consumables on tensile and impact properties of multi-pass SMAW Armox 500T steel joints vis-a-vis base metal
- Effect of functional composite coating developed via sulphate and chloride process parameter on the UNS G10150 steel for structural and wear mitigation in defence application
- Optimizing submerged arc welding using response surface methodology,regression analysis,and genetic algorithm
- Pitting and stress corrosion cracking studies on AISI type 316N stainless steel weldments
