18氟-氟代脱氧葡萄糖正电子发射断层显像/磁共振成像与头颈部鳞癌病理分化的相关性及诊断价值
2018-05-03党浩丹师晓华邢海群陈兴明张竹花薛华丹金征宇
党浩丹,陈 钰,师晓华,侯 波,邢海群,张 韬,陈兴明,张竹花,薛华丹,金征宇
中国医学科学院 北京协和医学院 北京协和医院 1放射科 2病理科 3核医学科 4口腔科 5耳鼻喉科,北京 100730
ActaAcadMedSin,2018,40(2):242-249
头颈部鳞癌(head and neck squamous cell carcinoma,HNSCC)是头颈部最常见的恶性肿瘤,占头颈部恶性肿瘤发病率90%以上,其在全球恶性肿瘤发病率位列第6[1- 2]。由于鳞状细胞癌容易浸润和广泛转移的特点,HNSCC的致死率较高[3]。目前研究表明,HNSCC的病理分化程度、TNM分期、人类乳头状瘤病毒(human papillomavirus,HPV)感染及表皮生长因子受体(epidermal growth factor receptor,EGFR)表达是影响预后的重要因素。因此,根据术前影像学诊断HNSCC的病理分化程度可以有效地辅助临床决策[4- 5]。18氟-氟代脱氧葡萄糖正电子发射断层显像(18-fluoro fluorodeoxyglucose positron emission tomography,18F-FDG PET)可以有效地显示恶性肿瘤细胞内葡萄糖的分布、浓度及代谢情况,在肿瘤的诊断、分期和预后方面价值较高。前期研究已经表明,18F-FDG的标准摄取值(standardized uptake value,SUV)可以定量反映组织的葡萄糖摄取水平,对HNSCC的诊断与预后评价有显著价值[3,6]。目前有关18F-FDG PET预测诊断HNSCC病理分化的研究很少。扩散加权成像(diffusion-weighted imaging,DWI)可以体现肿瘤组织的扩散受限、微循环和分子密度等信息,较多地应用于肿瘤诊断、疗效评估及预后等研究[7- 8]。但目前有关DWI和PET功能成像联合应用于HNSCC的病理分化诊断的研究报道较少。一体化正电子发射断层显像/磁共振成像(positron emission tomography/magnetic resonance imaging,PET/MR)可以进行 PET、常规MR及功能 MR的一站式成像,在临床应用日益广泛。前期研究表明,相比较PET/CT,PET/MR常规序列在HNSCC的原发灶诊断优势不明显,但该研究提示 PET/MR 在此方面没有发挥出MR功能成像的优势[9]。目前尚无PET/MR在HNSCC病理分化的诊断研究,尤其是联合MR功能成像评估。因此,有必要发掘结合 PET/MR的PET及MR功能成像联合诊断的潜力。本研究旨在探讨术前PET/MR参数SUV及表观扩散系数(apparent diffusion coefficient,ADC)与HNSCC的病理分化程度的相关性以及 PET/MR参数独立及联合诊断病理分化的效能。
对象和方法
对象连续性选取2015年2月至2017年9月行PET/MR检查并在随后4周内进行手术或活检的患者。所有纳入患者均需符合以下标准:(1)临床怀疑头颈部恶性肿瘤;(2)患者同意进行PET/MR检查并入组本研究;(3)在PET/MR检查后4周内获得HNSCC的组织病理学诊断。排除标准:(1)妊娠;(2)金属植入、幽闭恐惧症、肾功能受损等不适合进行 PET/MR 检查的情况;(3)组织病理学诊断为非头颈部鳞癌;(4)PET/MR 图像伪影较重,影响分析观察。本研究通过北京协和医院伦理委员会审核,所有入组患者均签署知情同意书。
PET/MR检查采用一体化PET/MR 成像仪[SIGNA PET/MR,通用(GE)医疗,美国]。所有患者检查前至少空腹6 h并进行空腹血糖检测。所有患者由静脉注射18F-FDG,注射剂量为3.7~7.4 mbq/kg。注射示踪剂和扫描开始时间间隔为119~151 min。采集时间为25 min。PET扫描为一个床位,包括从颅底至胸廓入口。衰减校正基于 Dixon 序列。所有的数据后处理及重建使用GE工作站Advantage Workstation 4.6。MR成像和PET成像同机同时进行,采用GE头颈联合线圈。MR序列及参数如下:(1)轴位三维脂肪抑制T2加权序列(T2 weighted imaging,T2WI):视野(field of vision,FOV)260 mm,162 层,3D 模式,层厚=1.1 mm,采集时间3 min 41 s,重复时间/回波时间=2.5 s/120 ms,矩阵=256×232;(2)轴位脂肪抑制T1加权序列(T1 weighted imaging,T1WI):FOV=290 mm,64层,层厚=4.0 mm,采集时间1 min 54 s,重复时间/回波时间=6.1 s/1.1 ms,矩阵=192×288;(3)轴位DWI序列采用双b值(b=0和 b=800 s/mm2),层厚=5 mm,FOV=240 mm,重复时间/回波时间=5025 ms/72 ms,矩阵=128×128,采集时间为5 min 8 s,ADC 值由GE Advantage工作站获得。采用TOF法重建PET图像,根据OSEM方法3次迭代重建,半高宽为400 ps。
图像分析均在GE Advantage Workstation 4.6工作站进行,由一位核医学科主治医师和一位放射科主治医师共同盲法分析 PET、T1WI、T2WI、DWI 及ADC各自独立图像和 PET/MR 融合图像。两名医师根据 T1WI及T2WI在病变最大层面手动描绘肿瘤感兴趣区(region of interest,ROI),选择病变内异常强化的实性部分,避免肿瘤周围的血管、气道以及肿瘤内较大的无强化坏死区域。根据 ROI 依次测量PET 及 ADC 的定量参数包括:SUV的最大值(maximum value of SUV,SUVmax)及平均值(mean value of SUV,SUVmean),ADC的平均值(mean value of ADC,ADCmean)。SUVmean的定义为以 ROI内 SUV 42%等高线的轮廓线内 SUV 的平均值,根据工作站软件自动获得。
统计学处理所有数据均用R软件(版本3.4.2,贝尔实验室,美国)。本研究采用t检验比较高分化、中及低分化组病例 T 分期分布的差异。SUVmax、SUVmean及 ADCmean的相关性由Spearman分析获得。P<0.05为差异有统计学意义。箱形图显示不同病理分化组的各参数分布情况。采用K-S检验SUVmax、SUVmean及 ADCmean各参数是否为正态分布,随后检验不同病理分化组间各参数分布的统计学差异。采用 Logistic 回归分析建立多参数联合对HNSCC分化程度的预测模型,并将其作为PET/MR多参数联合应用参数。受试者工作特征曲线(receiver operating characteristic,ROC)用于计算 PET/MR 各独立参数包括SUVmax、SUVmean及 ADCmean和PET/MR多参数联合应用对肿瘤病理分化程度预测的诊断效能。
结 果
临床资料共纳入27例患者进行 PET/MR 检查,排除2例由于假牙伪影较重而无法评估MR图像、1例未获得病理诊断以及1例诊断为非头颈部鳞癌(血管肉瘤)患者,最终共有23例被纳入分析统计。其中9例高分化、14例中-低分化(10例中分化及4例低分化)。高分化组和中-低分化组病例的年龄、病变位置及肿瘤T分期差异均无统计学意义(P均>0.05)(表1)。
PET/MR各参数的相关性根据Spearman相关矩阵,在23例患者PET/MR参数中,SUVmax和SUVmean二者之间具有强相关性(相关系数=0.74,P<0.001),ADCmean和SUVmax、SUVmean之间无相关性,相关系数分别为0.19(P=0.42)和0.35(P=0.13)。
PET/MR参数与病理相关性SUVmax、SUVmean及ADCmean在不同病理分化组间的分布情况见图1。根据K-S正态分布检验,SUVmax、SUVmean及 ADCmean不符合正态分布,对各参数进行独立样本Mann-WhitneyU非参数检验,结果显示SUVmean及ADCmean在两组间的分布差异均有统计学意义(P=0.007,P=0.005)(表2)。
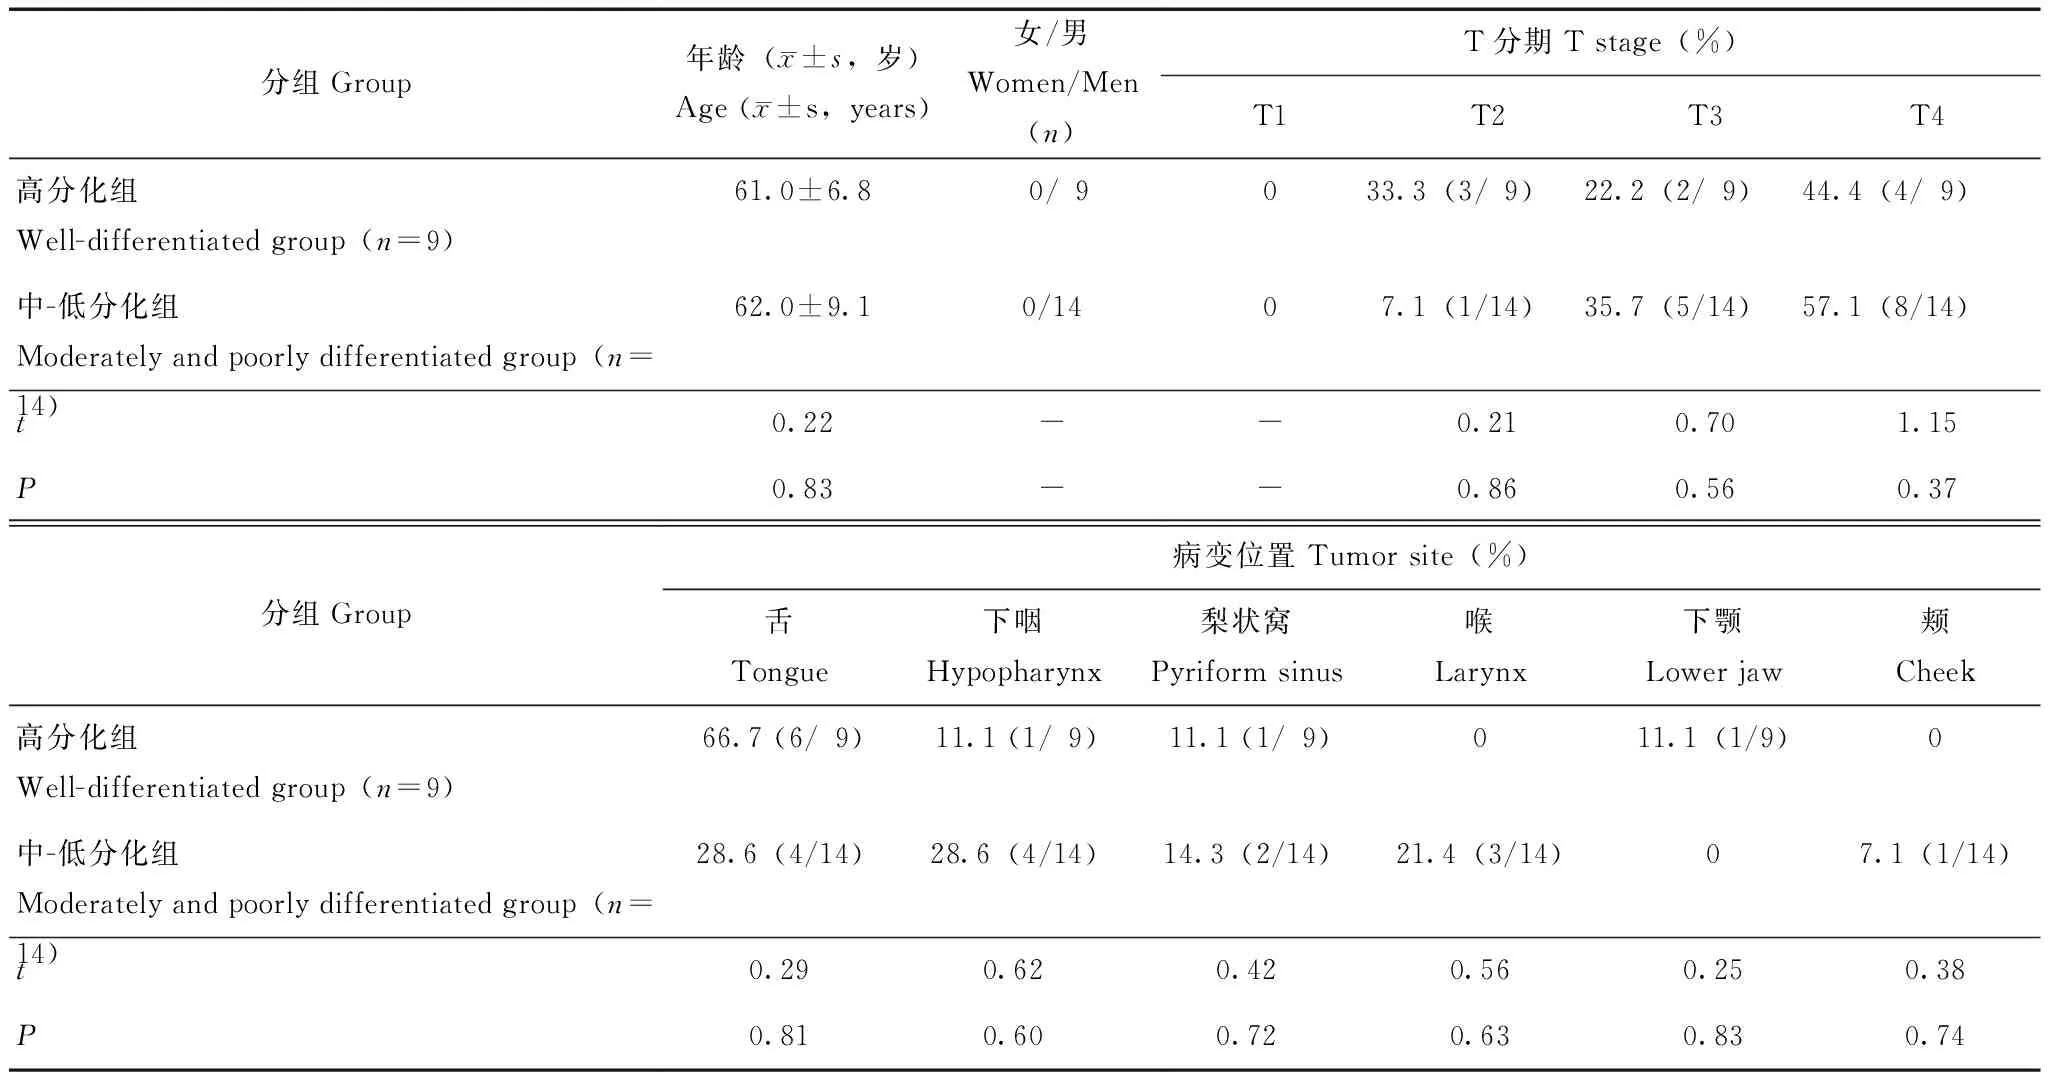
表 1 23例患者的临床资料Table 1 Clinical data of 23 patients
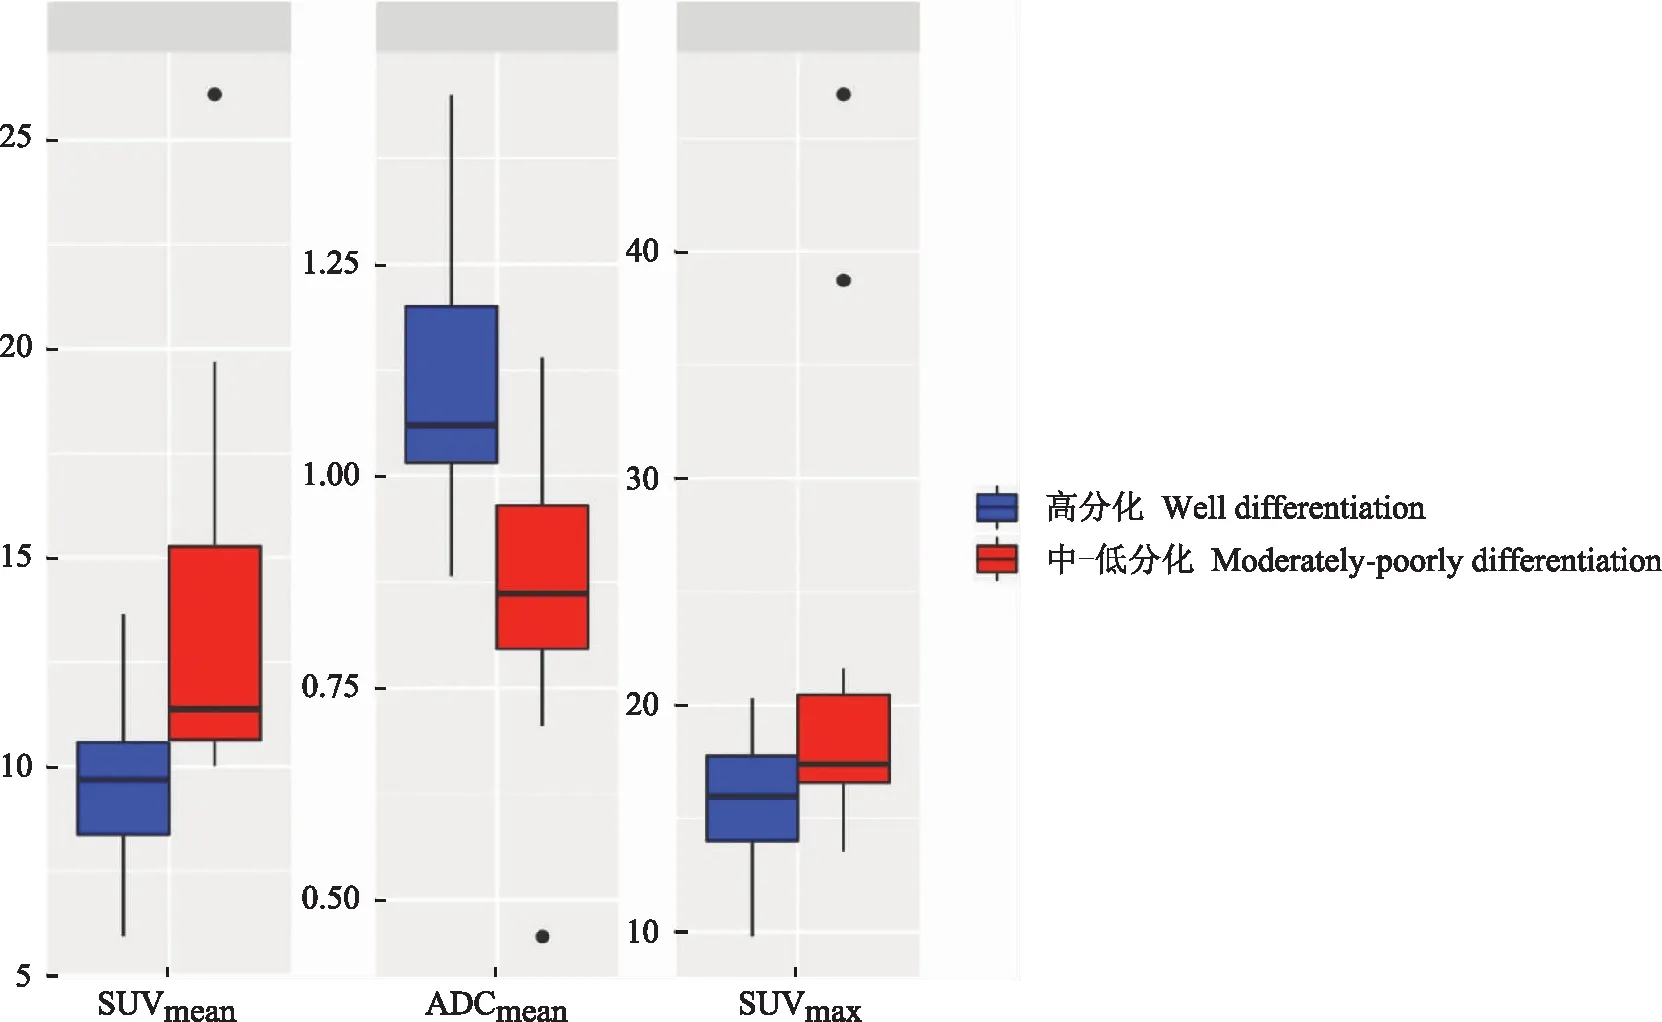
PET/MR:正电子发射断层显像/磁共振成像;SUVmean:标准化摄取值平均值;ADCmean:表观扩散系数平均值;SUVmax:标准化摄取值最大值
PET/MR:positron emission tomography/magnetic resonance;SUVmean:mean value of standardized uptake value;ADCmean:mean value of apparent diffusion coefficient;SUVmax:maximum value of standardized upake value
图1PET/MR 各参数在高分化及中-低分化组间的箱型图
Fig1Boxplot diagram of the PET/MR imaging parameters between well differentiated group and moderately-poorly differentiated group

表 2 SUVmax、SUVmean 及 ADCmean在高分化及中-低分化组的分布差异(- ±s)Table 2 Distribution of SUVmax,SUVmean and ADCmean in the well differentiated group and the moderately/poorly differentiated group (- ±s)
PET/MR多参数预测模型采用Logistic回归分析建立多参数对头颈部鳞癌分化程度的预测模型(16.47×ADCmean-4.64-1.1×SUVmean),并将其计算结果作为PET/MR多参数联合应用参数。根据SUVmean、ADCmean以及PET/MR多参数联合应用对病理分化预测的ROC曲线结果,SUVmean、ADCmean诊断的曲线下面积(area under curve,AUC)分别为0.64和0.68,相比较各参数单独预测HNSCC的病理分化,PET/MR多参数联合应用对分化程度的预测效能更好,AUC为0.84,其与SUVmean和ADCmean的AUC差异有统计学意义(P=0.01,P=0.008)(图2、表3)。高分化病变放射性摄取程度低于低分化,高分化ADC图信号高于低分化(图3、图4)。
讨 论
最近的研究表明HNSCC的病理分化程度和EGFR有显著相关性,后者已被证实为明确的HNSCC的预后因素之一[10- 11]。根据Santos等[5]和Helsen 等[12]的研究,对于首选手术或放射治疗的患者,高分化组病例的无转移生存率显著高于中、低分化组。因此,HNSCC原发灶病理分化程度可以提示肿瘤的复发和预后情况,有助于优化临床治疗决策。目前临床上需要寻找有效的术前预测病理分化的手段辅助个体化治疗。
本研究探讨一体化PET/MR多参数独立及组合在HNSCC病理分化程度的预测价值,根据同时同机采集的 PET及MR数据分析统计,结果准确性较好。
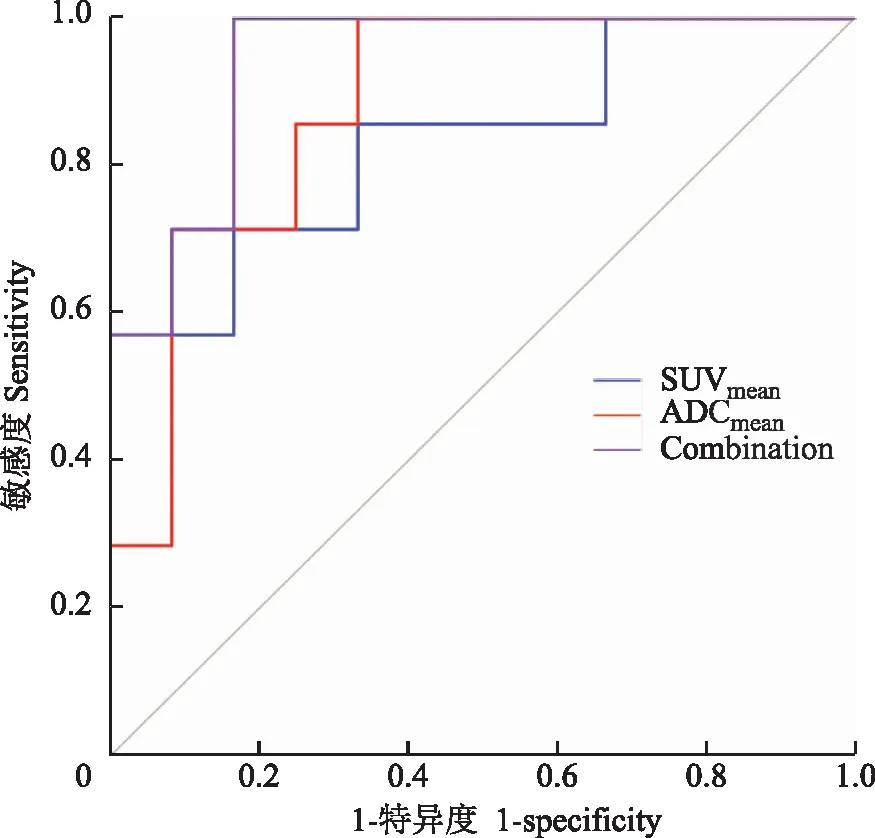
Combination:根据Logistic预测模型计算的PET/MR多参数联合应用参数
Combination:the combination of PET/MR multiparameters in prediction with Logistics
图2PET/MR各参数及多参数联合预测病理分化的受试者工作特征曲线
Fig2Receiver operating characteristic curves of individual parameters and combination of PET/MR imaging in predicting pathological differentiation

表 3 PET/MR各参数及多参数联合应用对病理分化的诊断效能Table 3 Diagnostic efficacy of individual parameters and combination of PET/MR imaging for pathological differentiation
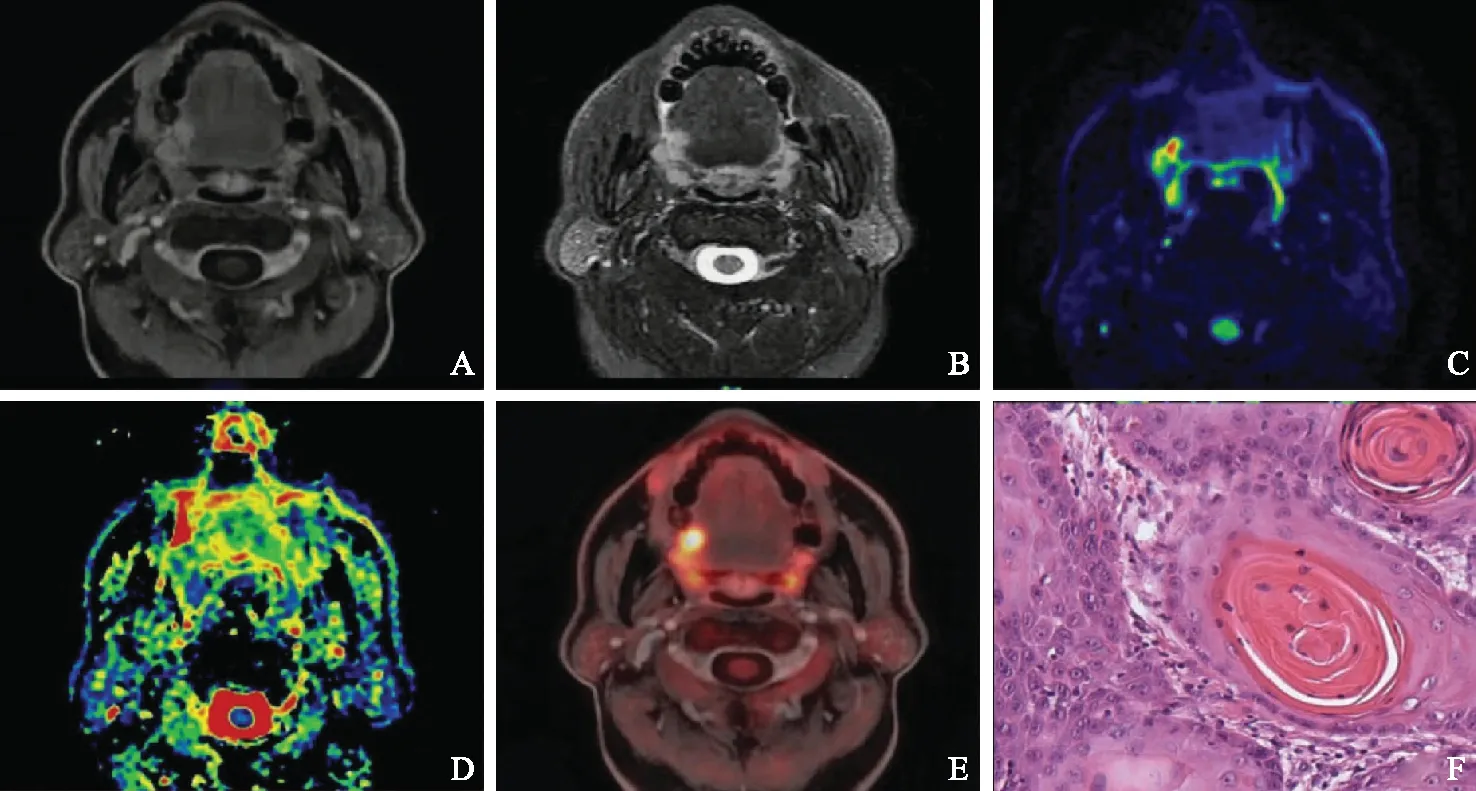
A.增强T1加权横轴位,显示右侧舌根部异常强化灶;B.T2加权横轴位,显示病变呈高信号改变,信号不均,边缘不清;C.扩散加权成像,显示病变区域信号异常增高;D.表观扩散系数图,显示病变区域表观扩散系数值减低,为1.16×10⁻³mm2/s;E.正电子发射断层显像与增强T1加权融合图像,显示病变放射性浓聚,标准化摄取最大值及平均值分别为11.3及9.8;F. 病理图片,显示细胞分化较好,可见角化珠形成
A. axial enhanced T1-weighted imaging shows the abnormally enhanced lesion on the right side of the tongue; B. the lesion was hyper-intense and heterogeneous with an unclear edge on axial T2-weighted imaging; C. the lesion was abnormally increased on diffusion-weighted imaging; D.the decreased signal with the value of apparent diffusion coefficient equal to 1.16×10⁻³mm2/s on apparent diffusion coefficient map; E. the lesion had abnormal uptake,with the mean and maximum values of standardized uptake equal to 11.3 and 9.8 on positron emission tomography fused with enhanced T1-weighted imaging; F.the pathological result showed the tumor cell was well differentiated with the keratin
图357岁男性,病理为右侧高分化舌癌
Fig3A 57-year-old male patient with a pathologically confirmed well-differentiated squamous cell carcinoma in right tongue
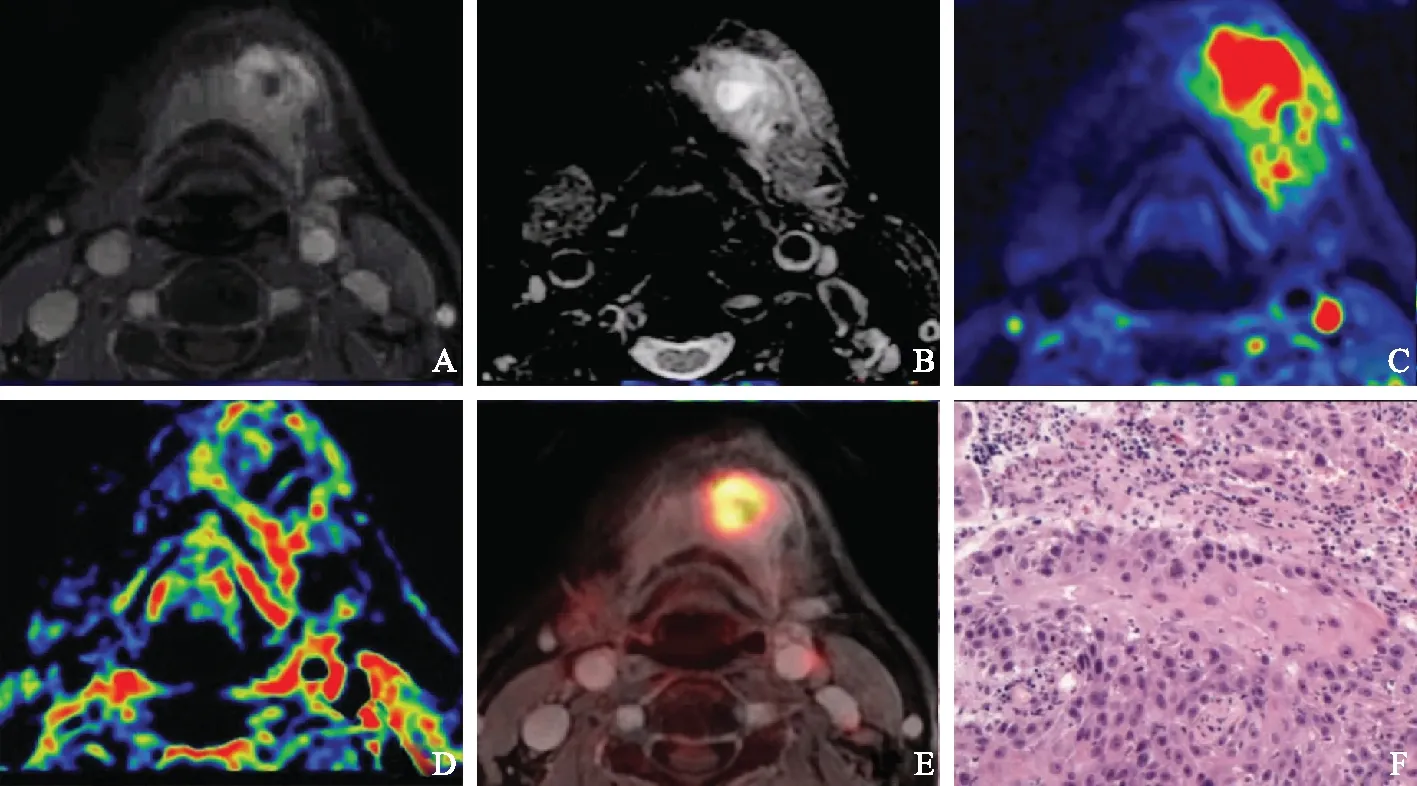
A. 增强T1加权横轴位,显示左侧颏部异常强化灶,灶内可见液化坏死;B.T2加权横轴位,显示病变呈不均匀高信号改变;C.扩散加权成像,显示病变区域信号显著增高;D.表观扩散系数图,显示病变区域表观扩散系数减低,为0.81×10⁻³mm2/s;E. 正电子发射断层显像与增强T1加权成像融合图像,显示病变放射性浓聚,标准化摄取最大值和平均值为17.5及16.7;F.病理图片,显示细胞异型性较显著,可见核分裂相
A.axial enhanced T1 weighted imaging shows the lesion was abnormally enhanced with liguefactive necrosis on lefr chin; B.the lesion was inhomogeneous and hypertense on axial T2-weighted imaging; C. the signal was significantly increased on diffusion-weighted imaging; D. the signal decreased with the value of apparent diffusion coefficient equal to 0.81 × 10⁻³mm2/s on apparent diffusion coefficient map; E. the high uptake with the mean and maximum values of standardized uptake equal to 17.5 and 16.7 on positron emission tomography fused with enhanced T1-weighted imaging; F. pathologyshowed that the tumor cells had obvious atypia and were in mitotic phase
图464岁男性,病理为左侧颏部低分化癌
Fig4A 64-year-old male patient with pathologically confirmed poorly-differentiated squamous cell carcinoma on left chin
本研究在23例 PET/MR 病例中,ADCmean与 SUVmax以及SUVmean相关系数为-0.19及-0.35,P值为0.42及0.13,无相关性,这点和Han等[13]的研究相似,根据其报道,SUV 和 ADC 的相关系数为-0.229,P值为0.192,但其研究基于独立的PET和 MR 成像在分机分时段测量获得数据。头颈部鳞癌细胞增殖异常活跃,其分裂数增加,肿瘤细胞密度也有所增加,同时增殖活跃带来的葡萄糖代谢也有所升高,因此ADC和SUV的变化可能有相似趋势[14]。根据本研究相关性分析,ADC和SUV无相关性,两者可以相互补充,更好地提示肿瘤的分化特征。统计结果表明,由Logistic回归预测模型计算的PET/MR多参数联合应用参数预测肿瘤的病理分化的曲线下面积为0.84,高于PET和ADC 的独立诊断,提示PET/MR联合应用预测效能更好,可以更有效地辅助临床治疗决策并提示预后。
本研究包括两个SUV测量值:(1)SUVmax:为ROI所有体素中 SUV最大值。SUVmax不受测量方法和ROI形状的影响,可重复性较好,但其很容易受到放射性计数噪声的干扰[15]。(2)SUVmean:根据后处理软件自动获得,定义为整个 ROI 中 SUV 分布的42%等高线轮廓线范围内的 SUV 平均值。目前研究多数认为SUVmean可以避免放射性计数噪声[15]。本研究比较 SUVmax、SUVmean在不同分化程度的肿瘤组之间分布差异更有统计学意义。根据既往文献的分析,肿瘤的快速生长和活跃增殖可以引起葡萄糖摄入增加,因此,高分化组病例放射性摄取下降,随着肿瘤分化程度的降低,中-低分化组病例放射性摄取增加[16]。
DWI及ADC值可以反映生物体内水分子运动并间接体现组织的细胞密度[17]。目前有关ADC对头颈部鳞癌病理分化的诊断和预后的研究结果并不一致[18]。Yun等[19]的研究表明,ADC 值在高分化组和低分化组间分布差异有统计学意义,但是该研究也显示 ADC 在不同分化组间分布的重叠较大,中分化和低分化组间的 ADC 分布无差异。另一项研究则表明在ADC界值为0.95×10⁻³mm2/s时,可以很好地区分头颈部鳞癌的高分化与低分化组[20]。本研究ADC 值在高分化及中低分化肿瘤组间分布差异有统计学意义,高分化组的ADCmean值相比较中-低分化组显著增高。ROC曲线显示依据ADC值对高分化及中-低分化肿瘤诊断有一定价值,但重叠范围较大,其诊断敏感性和特异性分别为0.8和0.8。笔者推测,本研究以及既往文献报道的不一致可能与鳞癌的异质性有关。鳞癌组织内易产生不同程度液化坏死,坏死组织具有容积效应,可干扰肿瘤的ADC测量,这个推测在De等[21]的研究中也有讨论。
本研究的局限性:(1)入组样本量较小,因此无法对肿瘤体积、病变位置及不同 T 分期病例进行分层分析讨论。(2)本研究仅对病理诊断进行高分化及中低分化的分类,没有定量的病理学分级指标与PET/MR参数做相关性分析。
综上,本研究显示基于18F FDG PET/MR获得的参数ADCmean、SUVmax和SUVmean在HNSCC高分化及中-低分化组间分布差异有统计学意义。相比较PET和MR的各参数独立预测病理分化程度,多参数联合应用可以更有效地提高头颈部鳞癌病理分化程度的预测效能。
[1] Chute DJ,Stelow EB. Cytology of head and neck squamous cell carcinoma variants[J]. Diagn Cytopathol,2010,38(1):65- 80. DOI:10.1002/dc.21134.
[2] Argiris A,Karamouzis MV,Raben D,et al. Head and neck cancer[J]. Lancet,2008,371(9625):1695- 1709. DOI:10.1016/S0140- 6736(08)60728-X.
[3] Cho JK,Hyun SH,Choi JY,et al. Prognostic significance of clinical and 18F-FDG PET/CT parameters for post-distant metastasis survival in head and neck squamous cell carcinoma patients[J]. J Surg Oncol,2016,114(7):888- 894. DOI:10.1002/jso.24412.
[4] 崔力方,刘红刚. 人乳头状瘤病毒相关头颈部鳞状细胞癌研究进展[J]. 中华病理学杂志,2016,45(10):734- 737. DOI:10.3760/cma.j.issn.0529- 5807.2016.10.019.
[5] Santos TS,Estêvão R,Antunes L,et al. Clinical and histopathological prognostic factors in locoregional advanced laryngeal cancer[J]. J Laryngol Otol,2016,130(10):948- 953. DOI:10.1017/s002221511600880x.
[6] Castaldi P,Leccisotti L,Bussu F,et al. Role of 18F-FDG PET-CT in head and neck squamous cell carcinoma[J]. Acta Otorhinolaryngol Ital,2013,33(1):1- 8.
[7] Preda L,Conte G,Bonello L,et al. Combining standardized uptake value of FDG-PET and apparent diffusion coefficient of DW-MRI improves risk stratification in head and neck squamous cell carcinoma[J]. Eur Radiol,2016,26(12):4432- 4441. DOI:10.1007/s00330- 016- 4284- 8.
[8] Jansen JFA,Parra C,Lu Y,et al. Evaluation of head and neck tumors with functional MR imaging[J]. Magn Reson Imaging Clin N Am,2016,24(1):123- 133. DOI:10.1016/j.mric.2015.08.011.
[9] Varoquaux A,Rager O,Poncet A,et al. Detection and quantification of focal uptake in head and neck tumours:18F-FDG PET/MR versus PET/CT[J]. Eur J Nucl Med Mol Imaging,2014,41(3):462- 475. DOI:10.1007/s00259- 013- 2580- y.
[10] Bossi P,Resteghini C,Paielli N,et al. Prognostic and predictive value of EGFR in head and neck squamous cell carcinoma[J]. Oncotarget,2016,7(45):74362- 74379. DOI:10.18632/oncotarget.11413.
[11] Xu QS,Wang C,Li B,et al. Prognostic value of pathologic grade for patients with oral squamous cell carcinoma[J]. Oral Dis,2018,24(3):335- 346. DOI:10.1111/odi.12727.
[12] Helsen N,Van den Wyngaert T,Carp L,et al. FDG-PET/CT for treatment response assessment in head and neck squamous cell carcinoma:a systematic review and meta-analysis of diagnostic performance[J]. Eur J Nucl Med Mol Imaging,2018,45(1):613- 621. DOI:10.1007/s00259- 018- 3978- 3.
[13] Han M,Kim SY,Lee SJ,et al. The correlations between MRI perfusion,diffusion parameters,and 18F-FDG PET metabolic parameters in primary head-and-neck cancer:a cross-sectional analysis in single institute[J]. Medicine (Baltimore),2015,94(47):e2141. DOI:10.1097/MD.0000000000002141.
[14] Varoquaux A,Rager O,Lovblad KO,et al. Functional imaging of head and neck squamous cell carcinoma with diffusion-weighted MRI and FDG PET/CT:quantitative analysis of ADC and SUV[J]. Eur J Nucl Med Mol Imaging,2013,40(6):842- 852. DOI:10.1007/s00259- 013- 2351- 9.
[15] Brendle C,Kupferschläger J,Nikolaou K,et al. Is the standard uptake value (SUV) appropriate for quantification in clinical PET imaging? Variability induced by different SUV measurements and varying reconstruction methods[J]. Eur J Radiol,2015,84(1):158-162. DOI:10.1016/j.ejrad.2014.10.018.
[16] Pleitz JL,Sinha P,Dressler EV,et al. Correlation of positron emission tomography/computed tomography scan with smoking,tumor size,stage and differentiation in head and neck cancer patients[J]. World J Nucl Med,2017,16(1):51- 55. DOI:10.4103/1450- 1147.181156.
[17] Padhani AR,Liu G,Koh DM,et al. Diffusion-weighted magnetic resonance imaging as a cancer biomarker:consensus and recommendations[J]. Neoplasia,2009,11(2):102- 125. DOI:10.1593/neo.81328.
[18] Driessen JP,van Kempen PM,van der Heijden GJ,et al. Diffusion-weighted imaging in head and neck squamous cell carcinomas:a systematic review[J]. Head Neck,2015,37(3):440- 448. DOI:10.1002/hed.23575.
[19] Yun TJ,Kim JH,Kim KH,et al. Head and neck squamous cell carcinoma:differentiation of histologic grade with standard- and high-b-value diffusion-weighted MRI[J]. Head Neck,2013,35(5):626- 631. DOI:10.1002/hed.23008.
[20] Razek AA,Nada N. Correlation of choline/creatine and apparent diffusion coefficient values with the prognostic parameters of head and neck squamous cell carcinoma[J]. NMR Biomed,2016,29(4):483- 489. DOI:10.1002/nbm.3472.
[21] De Perrot T,Lenoir V,Domingo Ayllón M,et al. Apparent diffusion coefficient histograms of human papillomavirus-positive and human papillomavirus-negative head and neck squamous cell carcinoma:assessment of tumor heterogeneity and comparison with histopathology[J]. AJNR Am J Neuroradiol,2017,38(11):2153- 2160. DOI:10.3174/ajnr.A5370.
