Correlation analysis of combined and separated eあects of wing deformation and support system in the CAE-AVM study
2018-04-19MinZHONGSuiZHENGGnglinWANGJunHUARoyGEBBINK
Min ZHONG,Sui ZHENG,Gnglin WANG,Jun HUA,Roy GEBBINK
aChinese Aeronautical Establishment,Beijing 100012,China
bGerman-Dutch Wind Tunnels,Marknesse 8316 PR,The Netherlands
1.Introduction
With the extensive development and application of CFD,solver and software validation attracts increased attentions worldwide.For example,AIAA has held six Drag Prediction Workshops(DPWs)since 2001,which aimed to assess the performances of CFD tools for predictions of aircraft aerodynamics characteristics by comparing numerical results with wind tunnel test data of typical research models.In the first three DPWs,the DLR-F4 and F6 models were studied.1–4Designed for a Mach number Ma=0.75,both models are wing-body combinations with wing mounted nacelles in F6.Starting from the fourth DPW held in 2009,a new model was introduced named the NASA Common Research Model(CRM).5–7The CRM represents a wide-body aircraft for Ma=0.85,with the option of wing mounted nacelles and/or a horizontal tail.
It was found that the gap between CFD results and wind tunnel test data becomes more obvious at Ma=0.85.This could be attributed partly to the increasing aero-elastic effects at a higher subsonic Mach number.During the fifth DPW,8a Pseudo experimental dataset was provided by adding the CFD predicted effect of the wing deformation to the wind tunnel test data.From the latest sixth DPW held in June 2016,9participants were able to use a deformed wing shape in their CFD.In fact,the interferences from model deformation,support system,wind tunnel walls,etc.should be considered in the aerodynamic design practice.10–13For CFD validation purpose,these interferences are not negligible either.
The Aerodynamic Validation Model(AVM)by the Chinese Aeronautical Establishment(CAE)has a high-aspect-ratio supercritical wing,rear-fuselage mounted engines,and a T-tail.14–16It is a dual-purpose model for the verification of a CAE conceptual study of long-haul business jets and for the validation of the in-house CFD software AVICFD.17Numerical simulations with AVICFD were conducted before and after a wind tunnel test,using geometries of the aircraft model with a nominal wing shape,a deformed wing shape,and with the model support system presented.The wind tunnel test was conducted in the High-Speed Tunnel(HST)of the German-Dutch Wind-tunnels(DNW),which is one of the major transonic wind tunnels in the world and has expertise accumulated for civil aircraft tests.18,19The test of the CAE-AVM featured parallel measurements of aerodynamic loads and pressure distributions,along with transition detection and wing deformation measurement.The aerodynamic performances of the AVM and CFD analysis were verified.It was demonstrated that by considering the wing deformation and support interference effects,the coincidence of CFD results with wind tunnel test data was improved significantly.
The CAE-AVM was therefore used as a common study object for a CFD-wind tunnel correlation study in the first CAE-DNW workshop,which was held in March 2016 in Beijing.The objective of this workshop was to analyze the combined effect of wing deformation and model support system interference on aerodynamic characteristics.Workshop participants conducted CFD for both the free- flying AVM and the AVM with a deformed wing shape and a sting system,in order to investigate the interferences by comparing the results between four CFD cases and test data.
This paper describes the study for the workshop and features the analysis of the combined and individual effects and attributions of the wing deformation and model support system.
2.Geometry and computational meshs
2.1.Geometry
Besides the common practice to conduct CFD analysis on solely one aircraft design shape,three shapes are used in this investigation.The first is the AVM(designed free- flight geometry),the second is the AVM-D(designed geometry with a deformed wing shape),and the third AVM-DZ(designed geometry with a deformed wing shape and a ventral z-sting support system),as shown in Fig.1,and the model combinations are listed in Table 1.

Fig.1 Model configurations for CFD analysis(AVM,AVM-D,and AVM-DZ).
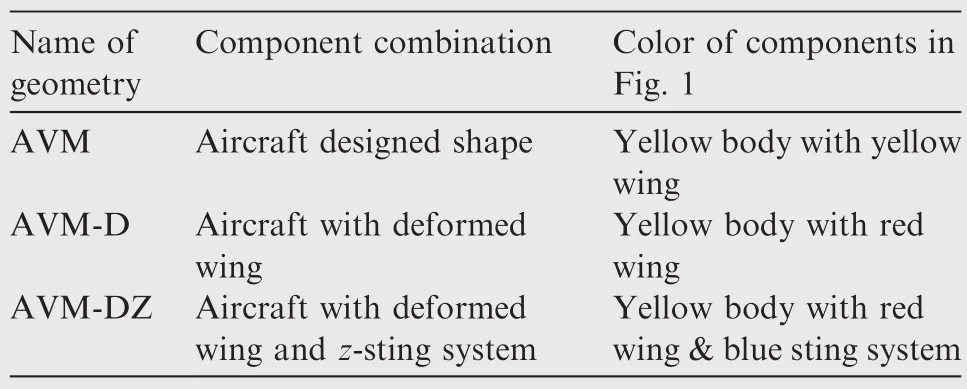
Table 1 Model combinations for CFD analysis.
Before the wind tunnel test,the aero-elastic wing deformation was pre-evaluated using the Finite Element Method(FEM)with aerodynamic loads from CFD.The wing deformation of the model was also measured in the wind tunnel test,and it is found that both FEM and test measured deformations feature similar tendencies and close values.For the present study,as well as for the CAE-DNW workshop,the measured deformation results were used to create an adapted wing shape for analysis with CFD in comparison to the experimental data.Similarly,the geometry of the z-support system was provided by the DNW before the wind tunnel test for pre-test CFD estimations.
2.2.Mesh generation
During aerodynamic design and component optimization,meshes of different topologies and sizes are generated and applied.Discussed below are the meshes of the geometric models used for the detailed CFD analysis in the workshop.Multiblock structured grids are generated with the ICEM CFD software.The boundary layer mesh contains 45 levels with a growth rate of 1.2.The first mesh layer has a height of 1.13×10⁻⁶m,which results in a unit y+in average.The mesh extent is about 100 Mean-Aerodynamic Chord(MAC)from the origin of the model coordinate system in the fuselage axis and normal directions,and 50 MAC on one side of the aircraft symmetric plane.The mesh of the CAE-AVM model shown in Fig.2 has 28965948 nodes in size,and the grid of the AVMDZ in Fig.3 has 40170636 nodes in total.Fig.4 shows close-up views of the surface meshes around the engine nacelle and the wing root.

Fig.2 Mesh of the AVM.
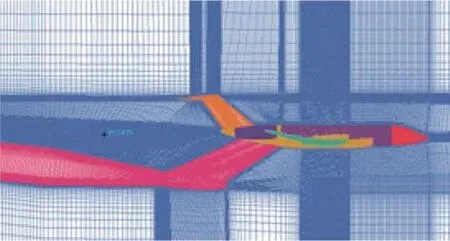
Fig.3 Mesh of the AVM-DZ.

Fig.4 Surface meshes around engine nacelle and the wing root.
3.CFD approach
3.1.Flow solver
CAE in-house code AVICFD-Y is adopted through the progress of design and CFD analysis.AVICFD-Y is a Reynolds Averaged Navier-Stokes(RANS)solver capable of reading structured meshes.The spatial discretization involves a semidiscrete finite-volume approach.Time advancement is implicit with the ability to solve steady or unsteady flows.The multigrid technique is used to accelerate the convergence and improve the computational efficiency.The convergence criteria are set until the fluxes are stable enough to observe a lift variation less than±0.001 and a drag variation less than 0.0001 in the last thousand iterations for attached flow conditions.The code contains several turbulence models(e.g.,the oneequation Spalart-Allmaras(S-A)model,20the two-equationk-ω model,etc.)which can be used to calculate the viscous flow fields of different configurations.The turbulence model used in this study is the Menter k-ω Shear Stress Transport(SST)model,21while other models such as the S-A model are used for comparison purpose.Table 2 shows an example of the difference between the S-A model and the SST model for the same lift coefficient CLat a design Mach number,where the difference in the drag coefficient CDis 0.0002,and the other parameters like the pitching moment coefficient Cmand the angle of attack α are also within a reasonable difference between the turbulence models.
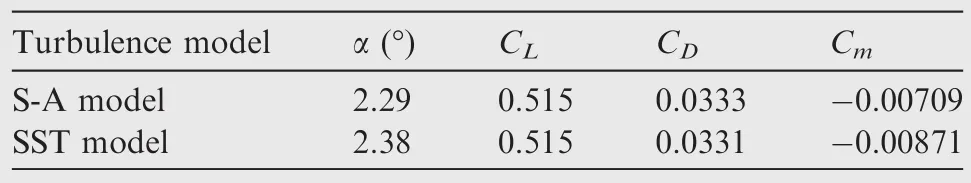
Table 2 Computational results of S-A model and SST model.
3.2.Boundary conditions
The outer boundaries of the computational domain are treated as characteristic in flow/out flow surfaces with free-stream conditions specified by velocity, flow angle,and static temperature.Aircraft surfaces are treated as non-slip walls,and a symmetric condition is applied to the aircraft symmetric plane.
4.Wind tunnel test and CFD verification
4.1.Wind tunnel test
A 1:22 scaled wind tunnel model was fabricated by the National Aerospace Centre of the Netherlands(NLR),based on the design geometry of the CAE-AVM.The model set-up in the DNW-HST comprised of a ventral z-sting support,as shown in Fig.5.The model was tested at Mach numbers between 0.4 and 0.9,and a constant Reynolds number of either Re=2.0×10⁶or 4.7×10⁶(i.e.,Re based on the MAC of the test model).The test featured a simultaneous deployment of various techniques to allow for measurements of the overall lift,drag,and pitching moment,wing pressure distributions at 180 points located in six span-wise wing stations(η=0.20,0.35,0.45,0.55,0.65,and 0.75),wing transition detection by infrared cameras,and wing deformation measurements using the Stereo Pattern Recognition(SPR)technique.
4.2.Test results and CFD verification
Fig.6 shows calculated pressure coefficients Cpand experimental data,for a mid-board wing section η=55%and an outboard section η=75%,c is the chord.It can be seen that by considering wing deformation and model support,the CFD results of the AVM-DZ coincide with test data in both wing sections,much improved from those of the AVM.
Fig.7 is a plot of the lift coefficient against the angle of attack.It could be seen that the CFD estimation of CLfor the AVM-DZ is in a closer agreement with the test data than that of the AVM.
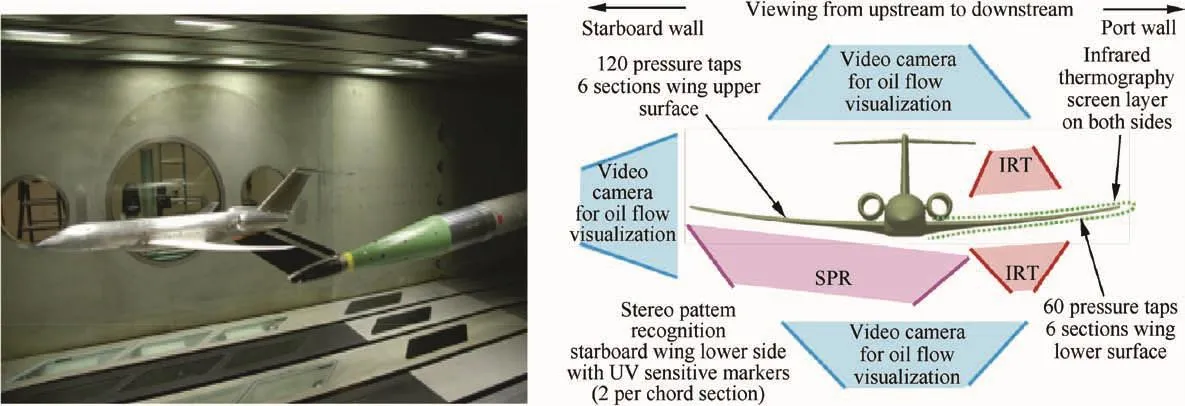
Fig.5 Wind tunnel test setup of the CAE-AVM in the DNW-HST.

Fig.6 Pressure coefficient comparisons of the AVM and the AVM-DZ with test data(Ma=0.85,Re=4.7×10⁶,CL=0.515).

Fig.7 Lift coefficient comparisons with test data(Ma=0.85,Re=4.7×10⁶).
In addition,surface limited lines are also compared with the results from a colored oil flow visualization test.Fig.8 shows the surface flow of the wing upper side at Ma=0.85,and it can be seen that the wing surface flows of both the wind tunnel test and CFD follow the same pattern.
With the good agreement of either pre-test CFD results used in the onsite assessment or after-test comparisons,accurate implementations of both CFD computation and the wind tunnel test are verified.

Fig.8 Surface flow patterns over the wing.
From the different coincidence levels of the CFD results with test data for the AVM and the AVM-DZ respectively,the wing deformation effect and z-sting system interference have been clearly released.In line with the preparation of the workshop,these interferences are further studied with an analysis of individual attributions from the combined influences observed above.
5.Effect of wing deformation on aerodynamic performance
During the wind tunnel experiment,wing deformation varied from one test condition(e.g.,one angle of attack at a Mach number)to the next.To account for wing deformation in CFD,three deformed wing meshes are created based on the measured wing shapes of three specific angles of attack at Ma=0.85 and Re=4.7×10⁶.The angles of attack considered are 0.01°,2.45°,and 5.5°as shown in Fig.9.Three different CFD meshes with different wing shapes are generated and used to replace the original wing for a detailed CFD analysis.Fig.10 shows the computed CLby using a deformed wing at α=2.45°for all the angles of attack from 0°to 5°,and compared with the results by using the individual deformation at that certain α.As expected,a deformed wing at α=2.45°will under-estimate CLby 0.02 at α =0°compared with a deformed wing at α =0.01°,because of the over twist.It will also change the lift curve slope at a smaller α.At α =5°,the difference of CLbetween using a deformed wing at α =2.45°and using one at α =5.5°is not very distinguishable,partly due to the limitations of the RANS solver and the turbulence model for this flow condition with a large area of detached flow over the wing.For the purpose of being aware of the major effect of wing deformation on aerodynamic characteristics,only the as-measured wing shape at Ma=0.85 and α=2.45°is used for AVM-D and AVM-DZ geometries in the first CAE-DNW workshop based on the above analysis to save the workload of participants.

Fig.9 Non-deformed(the lowest wing tip)and three deformed wing shapes.

Fig.10 Comparison of CLby using the three deformed wings at different α.
In order to investigate the individual effect of wing deformation alone on aerodynamic characteristics,CFD simulations are conducted for both the original AVM and the AVM-D.
5.1.Deformation effect on pressure coefficients
The influence of wing deformation on the Cpdistribution is analyzed for a fixed CL=0.515,at Ma=0.85 and Re=4.7×10⁶.Fig.11 shows the Cpdistributions of both the AVM and the AVM-D,for wing sections of η=35%,55%,and 75%.As the diagram shows,due to an increased wing twist caused by the aero-elastic deformation,the AVM-D would have a lower sectional lift at the out-board wing,for example,in the Cpdistribution of η=75%,the supersonic area is reduced and the shock moves forward in about 4%local chord length.
5.2.Deformation effect on lift coefficients
The lift coefficient is shown in Fig.12,where CLagainst α is compared for both the AVM and the AVM-D with different angles of attack from-4°to 8.02°,at Ma=0.85 and Re=4.7 × 10⁶.The lift curves yield a near-linear trend before α=3°,followed by a near-linear lift increase with a reduced slope up to α =5.5°.It can also be seen that while the wing deformation is included in CFD,the lift coefficient is decreased at the same angle of attack.At α =2.45°,CLof the AVM-D is 0.04 lower than that of the AVM.
5.3.Deformation effect on drag coefficients

Fig.11 Pressure coefficients comparisons of the AVM and the AVM-D.
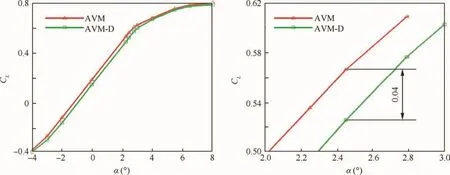
Fig.12 Lift coefficients comparisons between the AVM and the AVM-D.

Fig.13 Drag coefficients comparisons between the CAE-AVM and the AVM-D.
Fig.13 shows the CFD estimated drag coefficients against α for both the AVM and the AVM-D.The two curves yield a near-parabolic polar shape.The drag of the deformed wing is higher at low lift,for example,30 drag counts at α =-4°.For an angle of attack greater than 0°,the drag of the deformed wing is decreased at the same angle of attack.At α =2.45°,the CDvalue of the AVM-D is about 0.0027 lower than that of the AVM.
5.4.Deformation effect on pitching moment coefficients
The curves of the pitching moment coefficient Cmagainst α from CFD results of both the AVM and the AVM-D are visualized in Fig.14.As in the CLcase,the curves show a nearlinear trend up to α=3°,followed by a second change in the slope at α =5.5°.The pitching moment coefficient of the AVM-D is increased(nose up)with the deformed wing in the linear portion of the curve,because the wing lift is reduced at the same angle of attack as discussed in Section 5.2.At α=2.45°,the pitching moment of the AVM-D is increased by 0.0155 with respect to that of the AVM.
6.Interference of model support system on aerodynamic performance
In this section,the influence of the model support system is analyzed.The wind tunnel model support consists of a ventral z-sting and a straight boom,also called z-support(see Figs.1 and 5).The influence of the z-support is analyzed using the AVM-DZ geometry,which includes both the z-support system and the deformed wing shape.The CFD results of the AVMDZ are therefore compared with those of the AVM-D,in order to analyze the individual interference of the z-support.
6.1.Support interference on pressure coefficients
The influence of the model support system on the Cpdistribution is studied at fixed CL=0.515.Fig.15 shows the Cpdistributions of both the AVM-D and the AVM-DZ at three wing sections:η=35%,55%,and 75%.The results indicate that the sting interference to the Cpdistribution is similar in all the wing sections,which reduces supersonic areas and shifts the shock up-stream.At the η=75%wing section,the support system causes the shock shifting forward another 5%chord from the AVM-D.
6.2.Support interference on lift coefficients
For the performance analysis of CL,CD,and Cm,the flow conditions are again Ma=0.85,Re=4.7×10⁶,and the angle of attack from-4°to 8.02°.Fig.16 is the lift coefficients through different angles of attack for both the AVM-D and the AVM-DZ,which shows that the support system has no obvious effect on the lift coefficient of the full aircraft configuration,especially in the range from α=0°to 3°where an aircraft would typically fly.

Fig.14 Pitching moment coefficients comparisons between the AVM and the AVM-D.

Fig.15 Pressure coefficients comparisons between the AVM-D and the AVM-DZ.
6.3.Support interference on drag coefficients

Fig.16 Lift coefficients comparisons between the AVM-D and the AVM-DZ.
The drag coefficient curves against α for both the AVM-D and the AVM-DZ are plotted in Fig.17,from which it can be seen that the drag coefficient is reduced from-3°to 6°when the support system is included in CFD.At α=2.45°near the design condition,the CDreduction due to the support system is about 0.0011.
6.4.Support interference on pitching moment coefficients
Fig.18 presents the pithing moments of both the AVM-D and the AVM-DZ with respect to α.It can be seen that the slopes of Cmcurves are almost constant in the α-region from 0°to 2.8°.The support system reduces the value of the pithing moment coefficient(i.e.,nose-down direction)with an amount of-0.0036 at α =2.45°.As discussed above in Section 6.1 and Fig.15,the support system seems to slightly reduce the sectional lifts at the mid-and out-board wings which will further increase the nose-up moment;therefore,this nose-down increment of Cmmore likely comes from the Horizontal Tail(HT),where the negative balancing lift is somehow decreased.This is also supported by the discussion in Section 6.2 and Fig.16,that the lift of the complete aircraft has not been obviously influenced by the support system.Detailed flow analysis from CFD releases a continuous reduction of the Mach number from the mid-fuselage up to the tail planes as shown in Fig.19,probably due to the blockage effect of the ventral zsting system.This plot shows the surface Cpcontours over both the AVM and AVM-DZ models,and over the lower surfaces of the HT,where the Cpcontours are colored by the same scale in comparable figures.The velocity reduction over the wing could be seen by comparing the Cpcontour over the fuselage near the wing root,while the suction loss over the tails could be recognized by comparing the Cpvalues of the vertical and horizontal tails.This observation may provide an explanation to both the loss of the balancing lift from the HT and the reduction of the supersonic region over the wing,when the support system is included in the analysis.This phenomenon is also observed by a separate wind tunnel measurement of the pressure gradient along the test section afterwards,and will be mentioned in a parallel paper containing a CFD analysis of the z-sting geometry only.
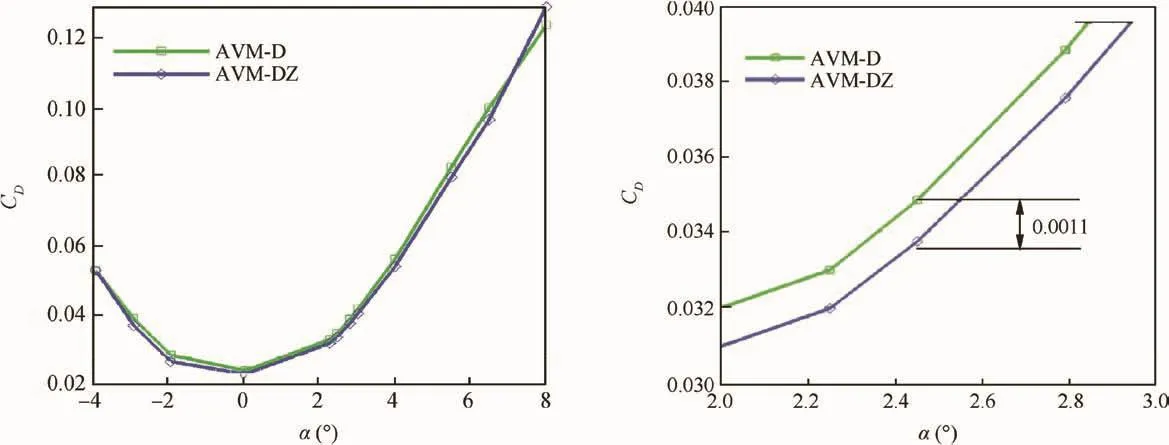
Fig.17 Drag coefficients comparisons between the AVM-D and the AVM-DZ.

Fig.18 Pitching moment coefficient comparisons between the AVM-D and the AVM-DZ.
7.Interferences between CFD and test results
In this section,the CFD results from the previous two sections are compared with wind tunnel test data.
7.1.Comparison of pressure coefficients
Fig.20 shows a comparison between computed and measured Cpresults at wing sections of η=35%,55%,and 75%,for the three geometries of the AVM,the AVM-D,and the AVM-DZ.The flow condition is at Ma=0.85 and Re=4.7×10⁶,for fixed CL=0.515.
From the discussion for this fixed-lift case,it is understood that wing deformation is responsible for the decrease of the sectional lift in the outboard wing due to an additional twist,while the blockage effect of the support system further shifts the shock forward at all the wing sections due to the reduced local Mach number.After considering both wing deformation and the model support system,the CFD results of the AVMDZ coincide very well with the wind tunnel data.
7.2.Comparisons of lift,drag,and pitching moment coefficients
The CFD estimated CL,CD,and Cmof the AVM,the AVM-D,and the AVM-DZ are plotted in Fig.21 along with wind tunnel data.It can be seen that by inclusions of the deformed wing shape and the support system in CFD,the coincidence of the AVM-DZ results with the experimental data is significantly improved in the α range around the cruise condition.
For the lift coefficient,the CFD results of the AVM-D and the AVM-DZ move closer to the test data with a reduced lift at a given α,and it is mostly due to the wing deformation which reduces the sectional lift particularly towards out-board wings,while the model support system has much less interference to the total lift,as discussed in Sections 5.2 and 6.2,respectively.The lower estimation of lift in the AVM-DZ model for α<0°is due to the fact that only a deformed wing at α =2.45°is used in this model,which has over twist at small α values.It is noticed that both CFD and wind tunnel data indicate a change of the slope at α =3°,which is found to be caused by the initiation of shock-induced separation over the wing upper surface.
In the CDcomparisons of Fig.21,the agreements of CFD results with test data for the AVM-D and the AVM-DZ are much improved from α =-2°to 3°,where the AVM-DZ has the best coincidence.The CDvalues of the AVM-D are over estimated at α < 0°because the deformed wing is over twisted at a small α which leads to an appearance of weak shocks over the lower side of the wing,while the AVM-DZ postpones the tendency to α< -2°due to a reduction of the local Mach number.The under-estimation of the drag at α>3°is partly due to the limitations of the solver and turbulence models at flow with extended wing separation or postbuffeting conditions.
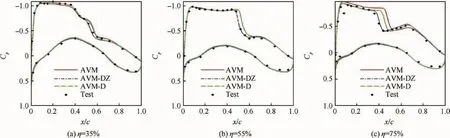
Fig.20 Comparisons between computational and test pressure coefficients results.

Fig.21 CL,CD,Cmcomparison of computational and test results.
For the Cmvalues shown in Fig.21,it is noticed that the slope of the AVM-DZ curve is improved when compared with test data.The curve is in a positive direction due to the lift loss of the wing by deformation,while a decrease of the negative force from the HT due to a local flow Mach number reduction tends to shift the curve in the negative direction,as discussed in Sections 5.4 and 6.4,respectively.
By comparing CFD results with wind tunnel test data,the validity of CFD calculation is further demonstrated,and it provides support for the previous analysis for the effects of wing deformation and interference from the ventral zsupport system,both separated and combined.
8.Conclusions
Based on numerical and experimental investigations of the CAE-AVM,this paper studies the individual and combined interferences of wing deformation and a model support system in a wind tunnel test with the aerodynamic performance of an aircraft model and CFD validation by using wind tunnel data.The main conclusions are as follows:
(1)Wing deformation decreases the sectional lift due to an aero-elastic twist along the wing span at a given Mach number and angle of attack.The lift and drag of the test modelare consequently reduced,whilst the nose-up pitching moment increases.At the design point,the lift coefficient is decreased by 0.04,the drag coefficient by 0.0027,and the pitch moment coefficient is increased by 0.015.
(2)The ventral z-support system causes a progressive Mach number reduction from the middle fuselage downstream.This moves the shock wave of the wing upper surface forward,by about 5%local chord at the design condition,and decreases the efficiency of the HT.At the design point,the support inference is practically small in terms of the total lift,but not in terms of the drag and pitching moment.The drag coefficient is found to be decreased by 0.0011,and the pitching moment coefficient reduced by 0.0036.
(3)Comparisons between CFD results and wind tunnel test data have verified that the inclusions of a deformed wing shape and a model support system improve the coincidence of the numerical results with the test data significantly.It is also observed that taking into account the wing deformation and model support system is necessary in the CFD-wind tunnel correlation study at high subsonic Mach numbers.Such a CFD estimation with wind tunnel effects before a test is suggested as well so as to improve the efficiency of on-site data interpretation during a wind tunnel test.
1.Levy DW,Zickuhr T,Vassberg J,Agrawal S,Wahls RA,Pirzadeh S,et al.Data summary from the First AIAA computational fluid dynamics drag prediction workshop.J Aircraft 2003;4(5):875–82.
2.La flin KR,Klausmeyer SM,Zickuhr T,Vassberg JC,Wahls RA,Morrison JH,et al.Data summary from Second AIAA computational fluid dynamics drag prediction workshop.J Aircraft 2005;42(5):1165–78.
3.Vassberg JC,Tinoco EN,Mani M,Brodersen OP,Eisfeld B,Wahls RA,et al.Summary of the Third AIAA CFD Drag Prediction Workshop.Reston:AIAA;2007.Report No.:AIAA-2007-0260.
4.Vassberg JC,Sclafani AJ,DeHaan MA.A wing-body fairing design for the DLR-F6 model:A DPW-III case study.Reston:AIAA;2005.Report No.:AIAA-2005-4730.
5.Vassberg J,Tinoco E,Mani M,Rider B,Zickuhr T,Levy d,et al.Summary of the Fourth AIAA CFD Drag Prediction Workshop.Reston:AIAA;2010.Report No.:AIAA-2010-4547.
6.Temmerman L,Hirsch C,Simulations of the CRM configuration on unstructured hexahedral grids:Lessons learned from the DPW-4 Workshop.Reston:AIAA;2010.Report No.:AIAA-2010-4670.
7.Vassberg JC,DeHaan MA,Rivers MB,Wahls RA.Development of a common research model for applied cfd validation studies.Reston:AIAA;2008.Report No.:AIAA-2008-6919.
8.David H.Fifth drag prediction workshop:computational fluid dynamics studies carried out at ONERA.J Aircraft 2014;51(5):1295–309.
9.Tinoco E,Brodersen O.DPW-6 summary of participant data CRM Cases 2-5.6th CFD drag prediction workshop.Reston:AIAA;2016.
10.Kohzai M,Sudani N,Yamamoto K,Ueno M,Hashimoto A.Experimental and numerical studies of support interference in the JAXA 2 m´2 m transonic wind Tunnel.Reston:AIAA;2010.Report No.:AIAA-2010-4200.
11.Hashimoto A,Kohzai M.Wall interference analysis by whole wind tunnel CFD.5th symposium on integrating CFD and experiments in aerodynamics.2012.
12.Eberhardt S,Benedict K,Hedges L,Robinson A Tinoco EN.Inclusion of aeroelastic twist into the CFD analysis of the twinengine NASA common research model.Reston:AIAA;2014.Report No.:AIAA-2014-0251.
13.Keye S,Brodersen O,Rivers MB.Investigation of aero-elastic effects on the nasa common research model.J Aircraft 2011;51(4):1323–30.
14.Hua J,Kong FM,Wang JJ,Zhan H,Sun RZ,Qiu D,et al.Recent examples on design aerodynamics for transport aircraft.23rd international congress of aeronautical science.2002.
15.Hua J,Zhang ZY.Transonic wing design for transport aircraft.17th international congress of aeronautical science.1990.
16.Hua J,Zheng S,Zhong M,Wang GL,Chu L,Liu FL,et al.Design and verification study of an aerodynamic validation model.7th Asia-Pacific international symposium on aerospace technology;2015.
17.Hua J.On the progress of civil aviation.Bruxelles:Von Karman Institute;2011.Report No.:VKI-GRAIN.
18.Maseland JE,Laban M,Ven H,van der Kool JW.Development of CFD-based interference models for the DNW-HST transonic wind-tunnel.Reston:AIAA;2006.Report No.:AIAA-2006-3639.
19.Wubben F,Takara E.Wind tunnel model support and wall interference corrections in DNW_HST-ensuring high data quality standards.5th CEAS air&space conference,Delft,the Netherlands,August 2015.
20.Spalart PR,Allmaras SR.A one-equation turbulence model for aerodynamic flows.Reston:AIAA;1992.Report No.:AIAA-1922-0439.
21.Menter F,Runsey C.Assessment of two-equation turbulence models for transonic flows.Reston:AIAA;1994.Report No.:AIAA-1994-2343.
杂志排行

CHINESE JOURNAL OF AERONAUTICS的其它文章
- Recent development of a CFD-wind tunnel correlation study based on CAE-AVM investigation
- High-speed wind tunnel test of the CAE aerodynamic validation model
- Multi-infill strategy for kriging models used in variable fidelity optimization
- Experimental research in rotating wedge-shaped cooling channel with multiple non-equant holes lateral inlet
- Numerical evaluation of acoustic characteristics and their damping of a thrust chamber using a constant-volume bomb model
- Scaling procedures of cabin noise generated by turbulent boundary layer excitation