Recent development of a CFD-wind tunnel correlation study based on CAE-AVM investigation
2018-04-19JunHUASuiZHENGMinZHONGGnglinWANGGeorgEITELBERGSinusHEGENRoyGEBBINK
Jun HUA,Sui ZHENG,Min ZHONG,Gnglin WANG,Georg EITELBERG,Sinus HEGEN,Roy GEBBINK
aChinese Aeronautical Establishment,Beijing 100012,China
bGerman-Dutch Wind Tunnels,Marknesse 8316 PR,The Netherlands
1.Introduction
For the aerodynamic design and research of modern aircraft,CFD,wind tunnel tests and flight verifications are three major tools.1–7To estimate the flight performance of the aircraft,wind tunnel data need to be adjusted for scaling effect such as Reynolds numbers,and corrected for interference from the tunnel wall,model support system and other effects;CFD software,on the other hand,can calculate full size configurations without interference from wind tunnel test equipment.However,in most of the cases,the CFD results are verified by wind tunnel data because flight measurements are usually limited and not available during the design phase.Therefore,the correlation of the results from the three major tools remains an open topic.Efforts to address the data correlation problems have been made in the aeronautical community for decades.In the area of wind tunnel data correction,research continues with the help of new experimental methods,measuring techniques and even CFD analysis.8–10In the CFD community,extensive verification and validation studies have been carried out at different levels11–13,including the wellknown AIAA Drag Prediction Workshops(DPW)where CFD scientists and code developers are verifying their results with wind tunnel data from a number of research models.14–17But,in most of the validation studies,wind tunnel interferences such as the model deformation and model support system are not provided for the CFD analysts to really‘compare apple to apple”.Because the ultimate users of the numerical tools and experimental results are the design experts and engineers,the correlation study should therefore be led or at least be strongly involved by aerodynamic designers,together with both CFD scientists and wind tunnel/ flight test experts.This becomes one of the guidelines of the present investigation.
While initiating a conceptual study of a small greener longhaul commercial jet aircraft in 2010,Chinese Aeronautical Establishment(CAE)noticed that both the aerodynamic design of the greener jet and the in-house CFD tools should be verified and validated with a reliable wind tunnel test dataset.The conceptual design of the aircraft was then combined with the CFD validation purpose to develop a CAE Aerodynamic Validation Model(CAE-AVM).Considering the high subsonic cruise Mach number Ma>0.85 of the aircraft and the pressurized wind tunnels used for verification,the aeroelastic deformation of the model and wind tunnel equipment interference must be taken into account.Therefore,the wing of the dual purpose model AVM was re-designed to increase the relative thickness.Meticulous design optimization with CFD tools was also followed when the aircraft was scaled down from the full size to the wind tunnel test model where Reynolds number Re is reduced.
After the theoretical design was carried out at CAE Flight Physics Research Center(FPRC)in Beijing,a 1:22 full metal model was fabricated at the National Aerospace Centre of the Netherlands(NLR)and tested in the High Speed Tunnel(HST)of the German-Dutch Wind Tunnels(DNW)in Amsterdam.Specific considerations and test features for the database of CFD validation purpose were implemented.CFD analysis before and after the wind tunnel test for the models of both free- flying geometry and geometry with aeroelastically deformed wings and the model support system provided very comprehensive comparisons with the experimental data.The importance of including the model deformation and the support system in the numerical study at Ma=0.85 level is confirmed,which is particularly necessary nowadays because the new long-haul wide-body aircraft and business jet are targeting this cruise speed.
To disseminate this well-accomplished investigation and invite the international participation,CAE,together with DNW,decided in 2014 to use CAE-AVM as a common aerodynamic validation model to organize the first CAE-DNW open workshop for CFD-wind tunnel correlation study.The objective of the workshop was to analyze the interference of the aero-elastic wing deformation of the aircraft wind tunnel model and the model sting geometry to the aerodynamic performance via CFD computations of the participants.Four study cases were designed with two model geometries and meshes provided,one is the baseline CAE-AVM geometry(called AVM in short in this paper)and the other is the CAE-AVM-DZ geometry(AVM-DZinshort)witha deformed wing and the representation of the z-sting system.
The workshop website was opened in 2015 to include introduction,objectives,study cases,CFD and experimental approaches,publications and registration.Registered participants could download the AVM and AVM-DZ geometries with workshop standard meshes,and submit their CFD results after individual computations of the cases.In total 20 organizations from aircraft enterprises,research institutes and universities of 9 countries registered to the workshop and 19 CFD result datasets were submitted.The workshop was held in Beijing in March 2016 with the participation of 50 scientists and engineers from 6 countries.The agenda included introductory and summary presentations from the organizers,the presentations from the participants,and a plenary discussion addressing the major observations from this CFD-wind tunnel correlation study.The results demonstrated that the workshop objectives were fulfilled.
The overview of the AVM design investigation and its application to this CFD-wind tunnel correlation study are given in the following sections of this paper.More concentrated CFD and wind tunnel approaches and analysis are prepared by parallel papers from the organizers and participants in this Chinese Journal of Aeronautics special column.
2.Aerodynamic design of CAE-AVM model
2.1.Conceptual study of baseline configuration
The design condition of the CAE small greener commercial jet aircraft is at Ma=0.87,ranging from 11000 to 13000 km with cruise altitude 13000 m.The aircraft length is 33 m and the wing span 33.5 m including the wing tip devices.The focus of the aerodynamic design is on the new large aspect ratio supercritical wing.CATIA V5 is used for the geometry definition,including the airframe structures,major systems,and the interior design of cockpit and cabin layout.The exterior configuration of the conceptual aircraft is shown in Fig.1.
CAE in-house code AVICFD-Y18is used for the flow analysis and aerodynamic performance estimation.It is a Reynolds-Averaged Navier-Stokes(RANS)solver based on multi-block structured mesh capable of large scale flow analysis on parallel computer clusters.Typical grid sizes of 20–40 million nodes and the Shear Stress Transport(SST)turbulence model are used in this investigation,while other turbulence models and codes are also applied for comparison in some design stages.
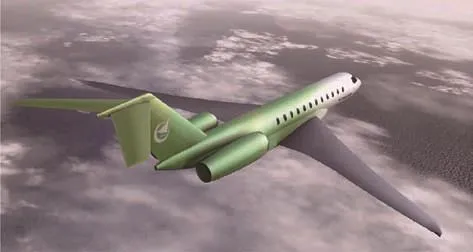
Fig.1 Configuration of CAE greener jet aircraft.

Fig.2 Wing optimization with FFD approach.
The basic pro file for the wing design is NPU-SP6,which is a 13%thick supercritical airfoil with front loading to reduce the pitching moment and improve the off design performance.19Both inverse method20and numerical optimization21are applied to the wing design.Fig.2 illustrates the Free Form Deformation(FFD)approach for the wing optimization.Flow details of the high-speed winglets,wing-body fairing,fuselage contour,engine nacelles are also elaborately optimized and integrated.The CFD estimated maximum lift to drag ratio L/D around cruise condition reaches 20.22
2.2.Specific considerations for validation model
Most of the high-speed wind tunnels apply pressurized and even cryogenic flow conditions to reach higher test Reynolds numbers.Examples are DNW-HST and ETW in Europe,T-128 in Russia and NTF in the United States.Test models with large aspect ratio swept wings for Ma≈0.85 in such tunnels will suffer severe aero-elastic deformation so that CFD results of the un-deformed shape could not match the experimental data.To obtain a high-quality wind tunnel database for CFD validation,the wing elastic deformation of the model would have to be minimized via design and fabrication,and to be measured during the test as well.
2.3.Revised wing design for CAE-AVM
In order to increase the rigidity of the wing of the aerodynamic validation model,the relative thickness is to be increased by 0.5%to 1%and the sweep angle reduced by 1°.For aerodynamic performance,the design Mach number is reduced from Ma=0.87 to Ma=0.85.

Fig.3 Span-wise distribution of relative thickness.

Fig.4 Elimination of shock induced separation over pylon.
Inverse method is used to re-design the wing for a quick convergence.Fig.3 is the comparison of the span-wise distribution of the wing relative thickness.Finite element analysis verified that the model wing twist of the new design caused by the aerodynamic loads at design point is reduced by 0.5°at the wing tip.
2.4.Detailed optimization at wind tunnel test Reynolds number
Besides the flight Reynolds number of 20 million,CFD analysis of the CAE-AVM is also conducted at wind tunnel test Reynolds number Re=4.7 million based on the mean aerodynamic chord of the 1:22 model.Some typical flow phenomena occurred at lower Reynolds number as estimated,such as a small trailing edge separation at the wing upper surface and shock induced separation over the pylon between engine nacelles and fuselage.Design optimization is performed to eliminate the unexpected flow problems,because good flow quality and accurate test data are important for the CFD validation purpose.Fig.4 shows the comparison of the supersonic zones over the pylon before and after the optimization.
3.Experimental investigation and numerical verification of CAE-AVM
3.1.Wind tunnel test model

Fig.5 Theoretical geometry and wind tunnel model of CAE-AVM.(Balance and model support shown in the middle figure).
Based on the numerically optimized geometry of AVM,the wind tunnel test model was designed and fabricated at NLR.This 1:22 full metal structure features 180 pressure taps in 6 wing span sections.Temperature isolation painting is applied over the left wing for transition detection with infrared cameras.Internal balance is connected with a z-sting mounted to the boom of the model support system.Fig.5 shows the theoretical geometry,the initial design sketch and the fabricated wind tunnel model of AVM.Model structure is modified from the initial design,such as the strengthened wing root connection,the un-split rear body and steel tail planes.
3.2.Wind tunnel test of CAE-AVM
The CAE-AVM wind tunnel test was conducted in the DNWHST in December 2013.HST is a continuous closed circle pressurized transonic wind tunnel for the Mach number from 0.2 up to 1.3.The test section is set up at 2.0 m×1.8 m for the AVM test while the test matrix includes Mach numbers from 0.4 to 0.9,Reynolds numbers at 2.0 and 4.7 million.The innovative feature of this test campaign is the simultaneous measurements of the forces,moments,pressure distributions,transition detection by infrared camera and wing aero-elastic deformation with Stereo Pattern Recognition(SPR)technique,all at the same test point in the sweep of angle of attack,as shown in Fig.6.
3.3.Numerical analysis and wind tunnel data processing
CFD analysis for the wind tunnel test matrix is performed with four configurations shown in Table 1.Before the wind tunnel test,an estimate of the wing deformation was obtained via finite element analysis with the load input from CFD.The geometry of the z-sting was provided by DNW.The CFD analysis of AVM with the deformed wing and/or sting has been found very useful during the wind tunnel test while thedata on site are compared to ensure the smooth progress of the test.
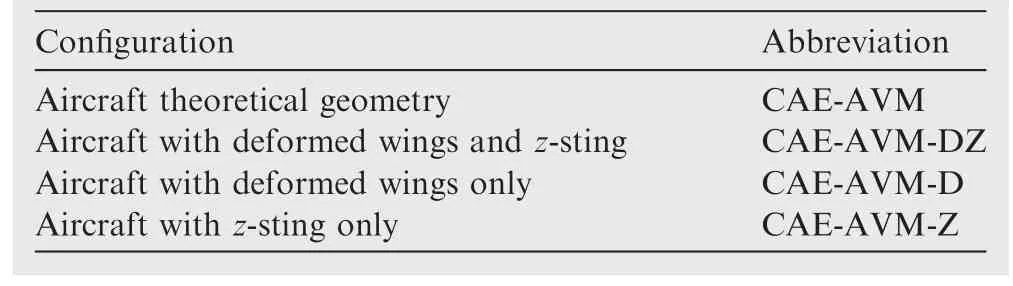
Table 1 Configuration analysed with CFD.
Besides the different sets of CFD results,two sets of test data,un-corrected(UNC)and corrected for the sting effect(SIC),are provided by DNW.Wing deformation values at different test Mach numbers and angle of attack α are processed from SPR measurements for more detailed CFD comparisons after the test.
3.4.Comparison of numerical and test results
Pressure distribution Cpis the most direct measure of the surface flow and is also the initial parameter for the integration of forces and moments inside CFD.Fig.7 illustrates the comparison of CFD results of AVM and AVM-DZ with measured data neardesign condition (Ma=0.85,liftcoefficient CL=0.5),in mid-and out-board wing span sections.It is noticed that when the wing aero-elastic deformation and model sting are included,the coincidence of Cpbetween CFD and test is much improved.It may be noticed that measured Cpnear 7%chord of the upper side at the outboard section η=75%is affected by the nearby transition tripping dots,which are applied at 7%chord on the upper surface and at 5%on the lower surface of the wing.

Fig.6 Model installation with SPR markers and infrared thermograph of AVM in HST.
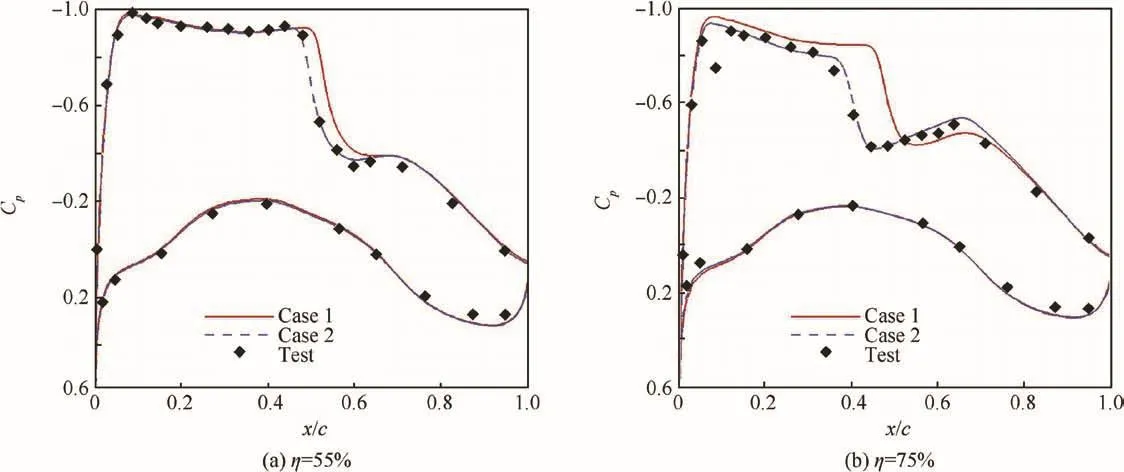
Fig.7 Pressure coefficient comparison between AVM(Case 1)and AVM-DZ(Case 2)with test data at 55%and 75%semi-span sections.

Fig.8 CLand CDcomparison between AVM(Case 3)and AVM-DZ(Case 4)with test data at Ma=0.85.
Fig.8 shows the comparison of lift and drag coefficients CLand CDagainst angle of attack α(in degree)at Mach number Ma=0.85 and Re=4.7 million.Again the CFD results with the wing deformation and model sting are in much better agreement with the test data,especially in the area of α=2.45°where the deformed wing is used for the AVM-DZ mesh.In general,the aerodynamic design,CFD analysis and the wind tunnel tests of AVM are fulfilled with satisfaction.
4.CAE-DNW workshop on CFD-wind tunnel correlation study
4.1.Objective of the 1st CAE-DNW workshop on CFD-wind tunnel correlation study
As outlined in the introduction,CAE,together with DNW,decided to use CAE-AVM as a common aerodynamic validation model to organize an international workshop in order to attract attention to the correlation topic.The workshop was announced at the 10th China International Airshow in November 2014.Theobjectives ofthis workshop are asfollows:
(1)Study wing deformation effect of the wind tunnel model at transonic Mach number on the aerodynamic performance via RANS simulation and compare with wind tunnel test data.
(2)Study sting interference in the model test to the aerodynamic performance via RANS simulation and compare with wind tunnel test data.
(3)Exchange results,observations and suggestions of the CFD-wind tunnel correlation during a two-day meeting.
(4)Disseminate the outcomes via publications with summarized and individual results and conclusions from the organizers and participants.
4.2.Cases,geometries and meshes
Four study cases of CFD computation were designed for this workshop.
The purpose of Case 1 and Case 2 is to analyze the combined effect of model wing deformation and sting interference on the aircraft flow and performance at Ma=0.85,α =2.45°,Re=4.7 million,CL=0.515,which is the nearest test condition to the design point of Ma=0.85 and CL=0.5,by applying the following two geometries:
(1)CAE-AVM,free flying model with nominal wing shape is used for Case 1 as shown in Fig.9(a).
(2)CAE-AVM-DZ,model on Z-sting with deformed wing at Ma=0.85 and α =2.45°is used for Case 2 as shown in Fig.9(b).Under this test condition,the twist of the wing is increased by about 1°due to aero-elastic deformation.
The purpose of Case 3 and Case 4 is to analyze the combined effect of wing deformation and sting interference on the forces and pitching moment through different angles of attack at design Mach number 0.85,and compare the CFD results with the test data.Again,as to the above two geometries,CAE-AVM is used for Case 3 and CAE-AVM-DZ used for Case 4.
Workshop standard meshes are generated by the organizer at CAE-FPRC and made available to the participants.The standard meshes are multi-block structured grids,with 28965948 nodes for AVM and 40170636 nodes for AVM-DZ,as shown in Fig.10.The mesh sizes are determined with respect to the grid convergence study and experience of the AVM design at CAE-FPRC.The additional grid nodes of AVM-DZ are mostly due to the inclusion of the z-sting system,while the mesh of the aircraft remains similar density as AVM.Besides the standard grids,participants are encouraged to generate their own meshes to best fit their CFD solvers.
5.Summary of results
5.1.CFD results from participants and comparison with wind tunnel data
In this section,the CFD results submitted by the workshop participants and the organizer are discussed by cases and compared with wind tunnel results.Most participants used their in-house CFD codes besides 2 applying commercial solvers;among the datasets submitted,16 CFD results were based on the workshop standard meshes while 3 customer meshes were also generated;concerning the turbulence models,16 participants used SST model,2 applied S-A and 1 used k-ω EARSM.
Wing Cpdistributions at 6 wing semi-span sections,given as η=20%,35%,45%,55%,65%and 75%,are plotted and compared with wind tunnel data.
Among the 19 CFD datasets from the organizer and participants,16 of them contain calculated Cpresults for Case 1,which are shown in Fig.11 and compared with wind tunnel data at the middle and outboard wing sections η=55%and 75%.In this and the following three figures,CFD result labeled 1 is from the organizer at CAE-FPRC,while the other curves are numbered in the order of the participant’s registration list.It is noticed that all of the 16 CFD distributions are in very close coincidence with each other as a single line,except one curve with slight difference at the front pressure side.It is also seen that at the outboard wingspan sections,CFD results deviate from the wind tunnel measurement concerning the minimum pressure and shock locations,because the wing deformation and sting effect are not included in this case.

Fig.9 CFD model of CAE-AVM and CAE-AVM-DZ.
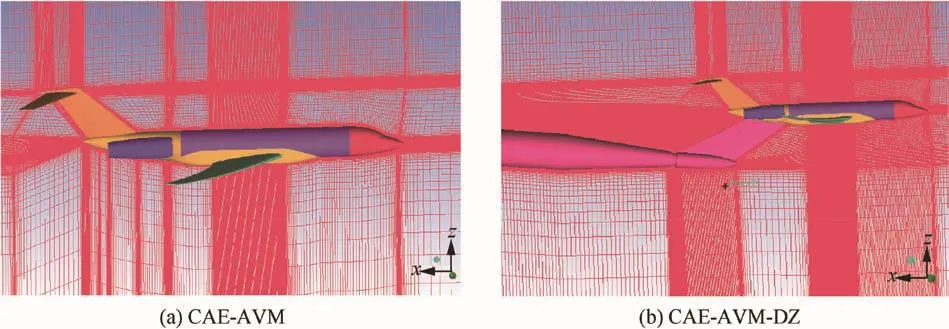
Fig.10 Workshop standard meshes of CAE-AVM and CAE-AVM-DZ.

Fig.11 Comparison of Cpdistributions at 55%and 75%wing sections in Case 1(Curves are numbered in the order of the participant list).
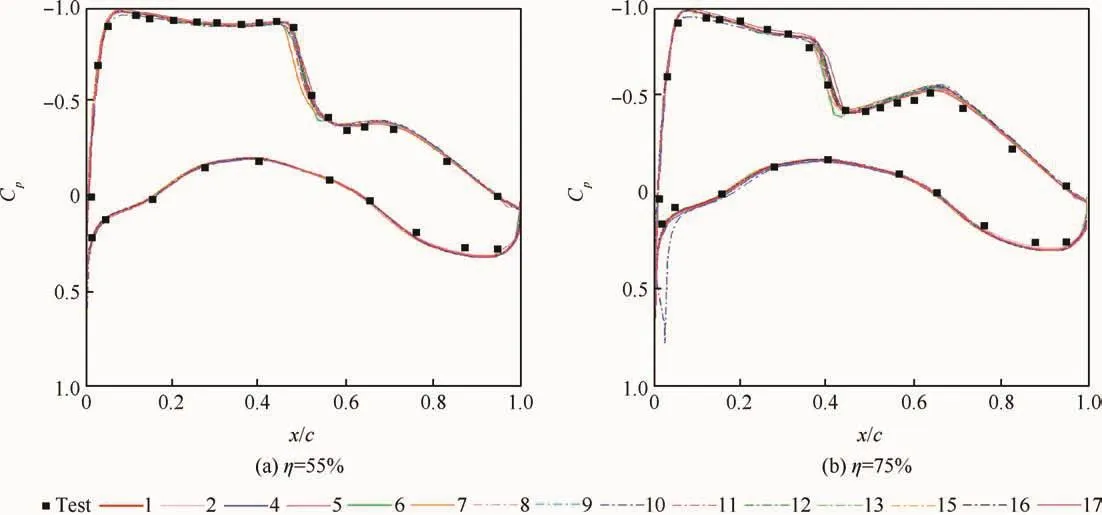
Fig.12 Comparison of Cpdistributions at 55%and 75%wing sections in Case 2(Curves are numbered in the order of the participant list).
For Case 2,15 CFD results collected are plotted in Fig.12 at wing sections η=55%and 75%,and again they are in very close coincidence with each other except one curve.In this case,the CFD Cpdistributions get much closer to the wind tunnel measurement even in the outboard section,because the wing deformation and sting effect are included in the AVM-DZ mesh.
Case 3 and Case 4 concentrate to analyze the effect of wing deformation and sting interference on the forces and moment through 10 different angles of attack(α=-1.99°,-0.01°,2.25°,2.45°,2.79°,3.00°,4.00°,5.50°,6.50°and 8.02°)at design Mach number 0.85,and compare the CFD results with the wind tunnel test data(corrected test data mostly for Case 3 and un-corrected for Case 4).The AVM geometry is used for Case 3 while AVM-DZ for Case 4.
Fig.13 shows the CFD CL,CDand Cmcurves against α and compares with test data for Case 3.As in the previous cases,the submitted 17 CFD results of Case 3 are in close gathering with each other in the α range from-2°to 4°where the flow is mostly attached,except one out lier.From the CLvs α curve,it is noticed that both the CLvalues and the lift line slope of the CFD results are larger than those of the wind tunnel test in the same α range mentioned.One reason of that is due to the increased wing twist in the wind tunnel model with the increase of α,which is not included in the Case 3 geometry.Even though CFD results get somehow diverged after flow separation at higher angle of attack,most of them are still able to indicate the shock induced separation at α ≈ 3°and large scale wing stall at α ≈ 5.5°,as shown in CLand Cmcurves.
Fig.14 shows the CFD CL,CDand Cmcurves against α and compares with test data for Case 4.Most of the 15 CFD results of this case are in close gathering in the α range from-2°to 4°.Different from Case 3,the CFD results of CLand CDmove much closer to the un-corrected wind tunnel test data as expected,because deformed wing and sting are included in the CFD mesh of AVM-DZ.The Cmcurves of the CFD still have a small gap to the test data,but the slope in the liner portion is very close to the test.

Fig.13 Comparison of CL,CDand Cmagainst α in Case 3(Curves are numbered in the order of the participant list).

Fig.14 Comparison of CL,CDand Cmagainst α in Case 4(Curves are numbered in the order of the participant list).
5.2.Summary in general
In the study of Case 1 and Case 2,CFD results of the participants are in good agreement with each other in Cpdistributions,and in good coincidence with wind tunnel test data in Case 2 by applying AVM-DZ geometry.
For Case 3 and Case 4,CFD results of participants are in good agreement with each other in lift coefficient up to CL=0.6.The ΔCLbetween CFD results and wind tunnel test is 0.01 in the linear part of Case 4 where AVM-DZ is used.
CFD results of participants are in good agreement with each other in drag coefficient,and most are within 10 drag counts near design point in Case 4.ΔCDbetween the mean value of the CFD results and the wind tunnel test data is around 10 drag counts as well in this case near design point.
CFD results of participants are in good agreement with each other in moment coefficient in the linear part.The two points of slope change due to separation are also estimated by some of the results.ΔCmbetween CFD results and test is around 0.015 near design point in Case 4.
The CFD results of the participants get diverged after α>4°when flow separation develops over the wing,which indicates the limitations of the steady RANS simulation with current turbulence models.
6.Major observations from the workshop
6.1.Observations from Case 1 and Case 2
In order to have more clear plots for the analysis between cases,the organizer’s CFD data by CAE-FPRC are used in this section because this dataset represents the average values of the participants in most of the flow conditions.
Fig.15 is the plot of the Cpcontours over the wing upper surface in Case 1 and Case 2,at Ma=0.85,CL=0.515 and Re=4.7 million for AVM and AVM-DZ geometries.It could be seen that at the same lift coefficient,the AVM-DZ has more lift in the inboard wing and less lift in the outboard wing,due to the increased wing aero-elastic twist and the presence of the sting system.The Cpdistributions of the wing sections plotted with test data could give the same observation as shown in Fig.7 of Section 3.Compared with AVM,the AVM-DZ result has smaller supersonic area and forward shifted shock in the upper surface of the middle and outboard wing,which coincide with wind tunnel test data very well.
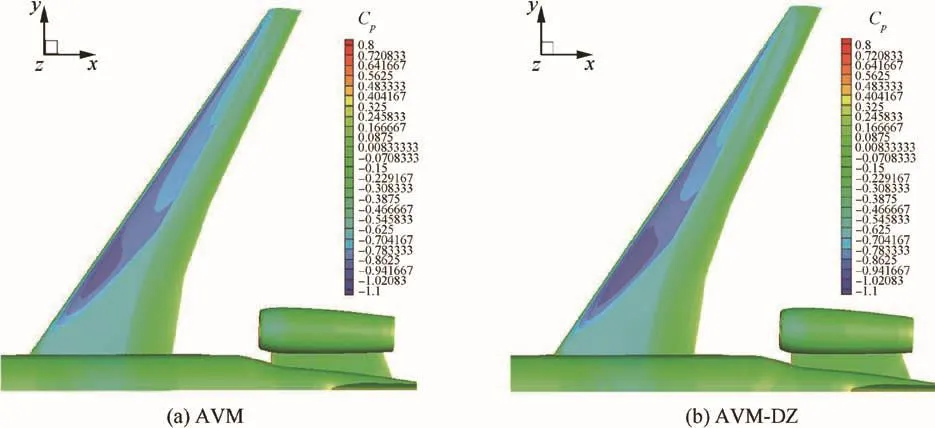
Fig.15 Cpcontours over wing upper surface in Case 1 and Case 2.
6.2.Observations from Case 3 and Case 4
The organizer’s CFD results of Case 3 and Case 4 for CLand CDhave already been shown in Fig.8 of Section 3.4.Please notice that only the deformed wing at Ma=0.85 and α=2.45°is used in Case 4 throughout the 10 incidence angles,in order to save the workload of the participants.Therefore,the CFD results in the range of α from 0°to 4.0°would be more reasonable for analysis.
From Fig.8,it is very clear that when wing deformation and model support system are included as in Case 4,both CLand CDresults get much closer to the test data,especially in the area around α =2.45°near the design condition.
Fig.16 presents the Cmvs α curves of Case 3 and Case 4,where the two Cmlines are well in between of the uncorrected(UNC)and corrected(SIC)test data.The curve of AVM-DZ in Case 4 is in the positive(nose-up)direction of AVM in Case 3,with the slope improved in the area around α =2°.It is observed that the wing deformation alone will increase the pitching moment due to the loss of sectional lift in the outboard wing,but it is meanwhile noticed in the simulation that the presence of the z-sting system will reduce the Cmvalue and move the curve in the nose-down direction.The reason is found from further CFD analysis that the flow speed from the mid-fuselage up to the tail planes is steadily decreasing,likely due to the blockage effect of the model support system of the wind tunnel,which reduces the negative lift of the Horizontal Tail(HT).Detailed analysis about the blockage effect will be given in a parallel paper of the organizer in this Chinese Journal of Aeronautics special column.

Fig.16 Cmcomparison between AVM(Case 3)and AVM-DZ(Case 4).
6.3.Observations in summary
Aircraft models tested in the transonic wind tunnels will suffer model deformation,especially for the large aspect ratio wings at high subsonic Mach number 0.85.In the present case of CAE-AVM,the additional wing twist due to aero-elastic deformation could reach one degree at the wing tip near design point.
The presence of the model support will cause interference to the aircraft flow in the wind tunnel to different levels according to the shape,size and position of the sting system,for example,the ventral z-sting support system used in the AVM test setup.
Therefore,it should be noticed that the test body in the wind tunnel is different from the theoretical shape of the aircraft for the CFD analysis during the design,either in geometry or in flow fields.The test data could not be compared directly to the CFD results of free flight geometry and flow conditions at this transonic Mach number.
It is observed from the present correlation study that the consideration and inclusion of the model deformation and sting system to the CFD model is necessary in the verification of the CFD analysis.
The combined influence of the wing deformation and model support system will reduce the lift and drag coefficient of the full aircraft configuration at certain angle of attack near design conditions.Such effect will reduce the supersonic zones over the upper surface of the wing and the wing loads as well.
On the other hand,CFD with the wing deformation and sting(AVM-DZ)will improve the lift estimation and drag prediction if compared with wind tunnel test data,for example,around α =0°to 4°in the cases of the present investigation.
Sting interference intends to change the loads of the HT,due to the reduction of the local Mach number from the mid-fuselage to the tail planes,for the model configurations like AVM with a ventral z-sting system.
7.Conclusions
(1)It is verified that the aerodynamic design of the CAEAVM fulfils the dual purpose of high-performance jet aircraft at Mach number 0.85 as well as a common aerodynamic model for CFD/wind tunnel validation applications.
(2)The test matrix and pre-test CFD simulations with estimated wing deformation and sting system are proven to be very effective in the interpretation of the wind tunnel results during the test.
(3)The wind tunnel model is well structured and of high quality,and the DNW-HST test data are accurate and complete.
(4)The workshop cases,geometry,CFD configurations and meshes are reasonably prepared and verified to be accurate for the CFD-wind tunnel correlation study.The participants are well experienced with their CFD tools.
(5)CFD with both wing deformation and sting like AVMDZ will significantly improve the coincidence with the wind tunnel data,especially on wingCpdistributions.
(6)CFD analysis with and without wing deformation and sting(AVM and AVM-DZ)will effectively enhance the understanding of the CFD-wind tunnel correlation problems concerning the CFD validation with wind tunnel test data and the application of the numerical and test data to the aircraft design.
This investigation was supported by the Innovation Funds of AVIC and other Chinese Research Projects.The participants were well dedicated to the workshop study and submitted their CFD results with high quality.The authors are grateful to Mr.Henri Vos of DNW,Mr.Ruben Nahuis of NLR,Mr.Weijia Huang and Dr.Xinyuan Li of CAE,to all the team members of this investigation,to participants of the workshop,and to those who have ever contributed to this study.
1.Kundu AK.Aircraft design.1st ed.Cambridge:Cambridge University Press;2010.
2.Soebester A,Forrester AIJ.Aircraft aerodynamic design—geometry and optimization.1st ed.UK:Wiley;2015.
3.Chen S,Bai JQ,Shi YY,Qiao L.Aerodynamic shape optimization design of civil jet wing-body-tail configuration.Acta Aeronaut Astron Sin 2015;36(10):3195–207[Chinese].
4.Deng Y,Zhang Y,Chen HX.CFD analysis of wing-nacelle interference based on far- field method.In:15th China-Russian conference on fundamental problems of aerodynamics and structure;2017.
5.Ma BF,Deng XY,Wang B.Effects of wing locations on wing rock induced by fore-body vortices.Chinese J Aeronaut 2016;29(5):1226–36.
6.Li YC,Wang JJ,Hua J.Experimental investigations on the effects of divergent trailing edge and Gurney flaps on a supercritical airfoil.Aerospace Sci Technol 2007;11(2):91–9.
7.Hua J,Kong FM,Liu HT.Unsteady thermodynamic CFD simulation of aircraft wing anti-icing operation.J Aircraft 2007;44(4):1113–7.
8.Coleman HW,Steel WG.Experimentation and uncertainty analysis for engineers.2nd ed.New York:Wiley&Sons;1989.
9.Wubben FJM,Takara E.Wind tunnel model support and wall interference corrections in DNW-HST—Ensuring high data quality standards.5th CEAS air&space conference;2015.
10.Maseland JEJ,Laban M,Ven H,van der Kooi JW.Development of CFD-based interference models for the DNW-HST transonic wind-tunnel.Reston:AIAA;2006.Report No.:AIAA-2006-3639.
11.Lyu FX,Xiao TH,Yu XQ.A fast and automatic full-potential finite volume solver on Cartesian grids for unconventional configurations.Chinese J Aeronaut 2017;30(3):951–63.
12.Wang YT,Meng DH,Sun Y,Zhang YL,Li W.High-order accuracy numerical simulation of DLR-F6/FX2B wing-body configuration.Acta Aeronaut Astronaut Sin 2016;37(2):484–90[Chinese].
13.Kong FM,Hua J,Xiang JW,Zhang ZY.Investigation of high-lift mild-stall wings.In:23rd international congress of aeronautical science;2002.Report No.:ICAS-2002-2.4.2.
14.Rakowitz M.DLR-F6 geometry&issues.In:21st applied aerodynamic conference.Reston:AIAA;2003.
15.Vassberg JC,DeHaan MA,Rivers SM,Wahls RA.Development of a common research model for applied CFD validation studies.Reston:AIAA;2008.Report No.:AIAA-2008-6919.
16.Levy DW,La flin KR,Vassberg JC,Tinoco EN,Mani M,Rider B,et al.Summary of data from the fifth AIAA CFD Drag Prediction Workshop.Reston:AIAA;2013.Report No.:AIAA-2013-0046.
17.Brodersen O,La flin K.DPW-6 summary of participant data CRM Cases 2–5.In:6th CFD drag prediction workshop.Washington,D.C.:NASA;2016.
18.Hua J.On the progress of civil aviation.Bruxelles:Von Karman Institute;2011.Report No.:VKI-GRAIN.
19.Hua J,Kong FM,Wang JJ,Zhan H,Sun RZ,Qiu D,et al.Recent examples on design aerodynamics for transport aircraft.In:23rd international congress of aeronautical science;2002.
20.Hua J,Zhang ZY.Transonic wing design for transport aircraft.In:17th international congress of aeronautical science;1990.p.1316–22.
21.Yang T,Bai JQ,Wang D,Chen S,Xu JK,Chen YY.Aerodynamic optimization design for after-body of tail-mounted engine layout considering interference of engines.Acta Aeronaut Astronaut Sin 2014;35(7):1836–44[Chinese].
22.Hua J,Zheng S,Zhong M,Wang GL,Chu L,Liu FL,et al.Design and verification study of an aerodynamic validation model.In:7th Asia-Pacific international symposium on aerospace technology;2015.
杂志排行

CHINESE JOURNAL OF AERONAUTICS的其它文章
- Correlation analysis of combined and separated eあects of wing deformation and support system in the CAE-AVM study
- High-speed wind tunnel test of the CAE aerodynamic validation model
- Multi-infill strategy for kriging models used in variable fidelity optimization
- Experimental research in rotating wedge-shaped cooling channel with multiple non-equant holes lateral inlet
- Numerical evaluation of acoustic characteristics and their damping of a thrust chamber using a constant-volume bomb model
- Scaling procedures of cabin noise generated by turbulent boundary layer excitation