Novel degradation products of argatroban:Isolation,synthesis and extensive characterization using NMR and LC-PDA-MS/Q-TOF
2018-04-17VinodhGuvvlVenktesnChidmbrmSubrmninJyShreeAnireddyMheshKond
Vinodh Guvvl,Venktesn Chidmbrm Subrmnin,Jy Shree Anireddy,Mhesh Kond
aCentre for Chemical Science&Technology,Institute of Science&Technology,JNTUH,Kukatpally,Hyderabad 500085,India
bGland Pharma Ltd.,Research and Development,D.P.Pally,Hyderabad 500043,India
1.Introduction
Argatroban,a derivative of L-arginine(Fig.1),is a competitive inhibitor[1]of thrombin and only interacts with active site of thrombin.It directly prevents the activity of thrombin(factor IIa)and has no direct effect on the generation of thrombin.The function of argatroban is independent of the antithrombin in the body.Argatroban inactivates not only thrombin in free state in blood,but also inactivates the thrombin combined with fibrin thrombus.Argatroban has a small molecular weight and thus it enters into thrombus and directly inactivates the thrombin already combined with fibrin thrombus,and even exhibits an anti thrombotic effect against an early formed thrombosis.Argatroban is given intravenously and the drug plasma concentration reaches steady state in 1–3 h[2].
ICH Q3A(R2)and Q3B(R2)recommend the characterization of impurities/degradation products that are present at a level greater than the identification threshold in a drug substance or drug product[3–9].The study of formation of impurities/degradants in the drug substance,their isolation and characterization is very important since it can help to understand the degradation pattern of the drug substance.This gives precious information about the drug stability under various conditions,so such information is significant for determining storage and other conditions of the bulk and formulated drug substance.In addition,improvements in the manufacturing process of bulk drug substance are difficult to achieve without understanding the possible degradation pathways.
The present investigation deals with all degradation studies including acid,base,thermal and photo stability on the drug substance as per the above prescribed guidelines.The formed degradation products were identified through LC–MS-Ion trap and Q-TOF NMR spectral analysis and the proposed structures were confirmed by comparing with individually synthesized compounds.Even though there is no report on the degradants identified in the present study,recently Secretan et al.[10]reported photo degradation study of argatroban in aqueous solution based on the LC–MS.Nevertheless,the present study deals with the behaviour of argatroban drug substance in acid,base,peroxide and thermal stress.The formed degradation products were characterized completely by using advanced analytical techniques such as LC–MS/MS,IR and NMR.
2.Experimental
2.1.Chemicals and reagents
Argatroban drug substance was prepared by Gland Pharma Ltd.(Hyderabad,India).Analytical reagent grade sodium hydroxide(NaOH)was purchased from S.D.Fine-Chem Ltd.(Mumbai,India),hydrochloric acid(HCl),HPLC grade methanol(MeOH)and acetonitrile(ACN)from Merck Specialities Pvt.Ltd.(Mumbai,India)and hydrogen peroxide(H2O2)from Qualigens Fine Chemicals Pvt.Ltd.(Mumbai,India).Ammonium formate(HCOONH4)and formic acid were purchased from Merck.Ultra pure water obtained from Millipore water purification system(Bangalore,India)was used throughout the studies.
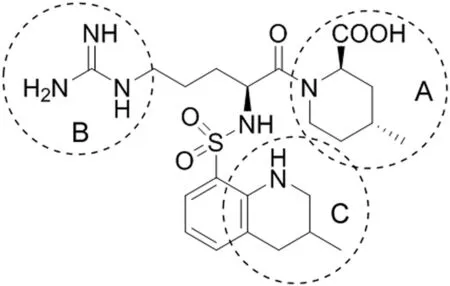
Fig.1.Argatroban and its structural elements(A–C)susceptible to chemical changes.
2.2.Instrumentation
The forced degradation samples were analyzed on an Agilent HPLC(series 1200)equipped with a vacuum degasser,binary pump,auto injector,diode array detector(DAD),and coupled to an Agilent Ion-trap(6310)/Q-TOF 6530(Agilent technologies,USA,location Gland Pharma R&D,Hyderabad,India)operating in+ESIMS and –ESI-MS modes.Chromatographicseparation was achieved on Inertsil ODS 3 V(250 mm × 4.6 mm,3μm)column.Mobile phase was degassed using transonic sonicator bath(570/HELMA,Germany).The LC–MS system operation was controlled using Chemstation and Mass hunter software.
The IR spectra of the compounds were taken from Shimadzu FTIR Spectrophotometer(Model No:IR PRESTIGE-21,location Gland Pharma R&D,Hyderabad,India)by using KBr disc technique.The1H,13C NMR,and 2D NMR spectral analysis were carried out on Bruker(400 MHz,Location ALR fine chemical Pvt.limited,Hyderabad,India).The samples were dissolved in DMSO-d6and CD3OD by using tetramethylsilane(TMS)as an internal standard.Melting points in°C were recorded on DSC-60 Shimadzu instrument.
Hydrolytic and thermal forced degradations were carried out using autoclave and hot air oven equipped with digital temperature control capable of controlling temperature within the range of±1 and±2°C,respectively(Cintex precision hot air oven,Mumbai,location Gland Pharma R&D,Hyderabad,India).Photo degradation was carried out in photo stability chamber(Thermo lab Scientific equipments,Vasai,location Gland Pharma R&D,Hyderabad,India)equipped with fluorescent lamp for 1.2 million lux hours and UV light for 200 W h/m2and capable of controlling temperature and humidity in the range of±2 °C and±3%RH,respectively.The chamber was set at a temperature of 25°C and at relative humidity(RH)of 60%.The light system complies with option 2 of the ICH guideline Q1B.The autoclave studies were carried out in Fedegari instrument(USA).
2.3.Forced degradation study
Argatroban drug substance sample was subjected to stress under different conditions individually as well as in combination as per ICH guidelines.All stress samples were diluted with water prior to the injection to obtain a final concentration of 1 mg/mL.Acidic and alkaline hydrolysis of argatroban was conducted in 0.1 M HCl and 0.1 M NaOH,respectively.The drug substance was diluted with acidic and alkaline solutions to obtain a concentration of 1 mg/mL and hydrolytic studies were carried out at 80°C for 2 h.For oxidative stress study,the sample was diluted with 0.3%peroxide solution to obtain a concentration of 1 mg/mL subsequently and the drug was exposed to autoclave at 120°C for 30 min.Photo degradation studies were carried out by exposing the drug substance to a light energy of 1.2 million lux hours and an integrated UV energy of 200 W h/m2.A parallel set of the drug solutions were stored in dark at the same temperature to serve as a control.Thermal studies were conducted on the solid drug substance by heating at 80°C for 7 days in a hot air oven.All the reaction solutions were diluted with the mobile phase before HPLC analysis.
2.4.HPLC method and sample preparation
The forced degradation samples were analyzed on Agilent HPLC(series 1200)equipped with a vacuum degasser,binary pump,auto injector,DAD.The drug and its degradation products were optimally resolved on Inertsil ODS 3 V,C18(250 mm × 4.6 mm,3 μm)column and eluted with mobile phases A(20 mM of ammonium formate at pH 3.5 adjusted with formic acid)and B(acetonitrile).The gradient pro file is as follows:linear gradient 10%–35%of B in 25 min,65%B in 40 min,70%B in 55 min and re-equilibration of the column from 58 to 65 min with 10%of B.The flow rate was 0.8 mL/min;UV detection atλmax259 nm was used for monitoring.All the stress study samples(acid and base hydrolytic,oxidative,thermal and photolytic stress)were neutralized and diluted with the mobile phase and filtered through a 0.22 μm membrane filter before injection.
2.5.LC-MS-Ion trap and Q-TOF-MSnparameters
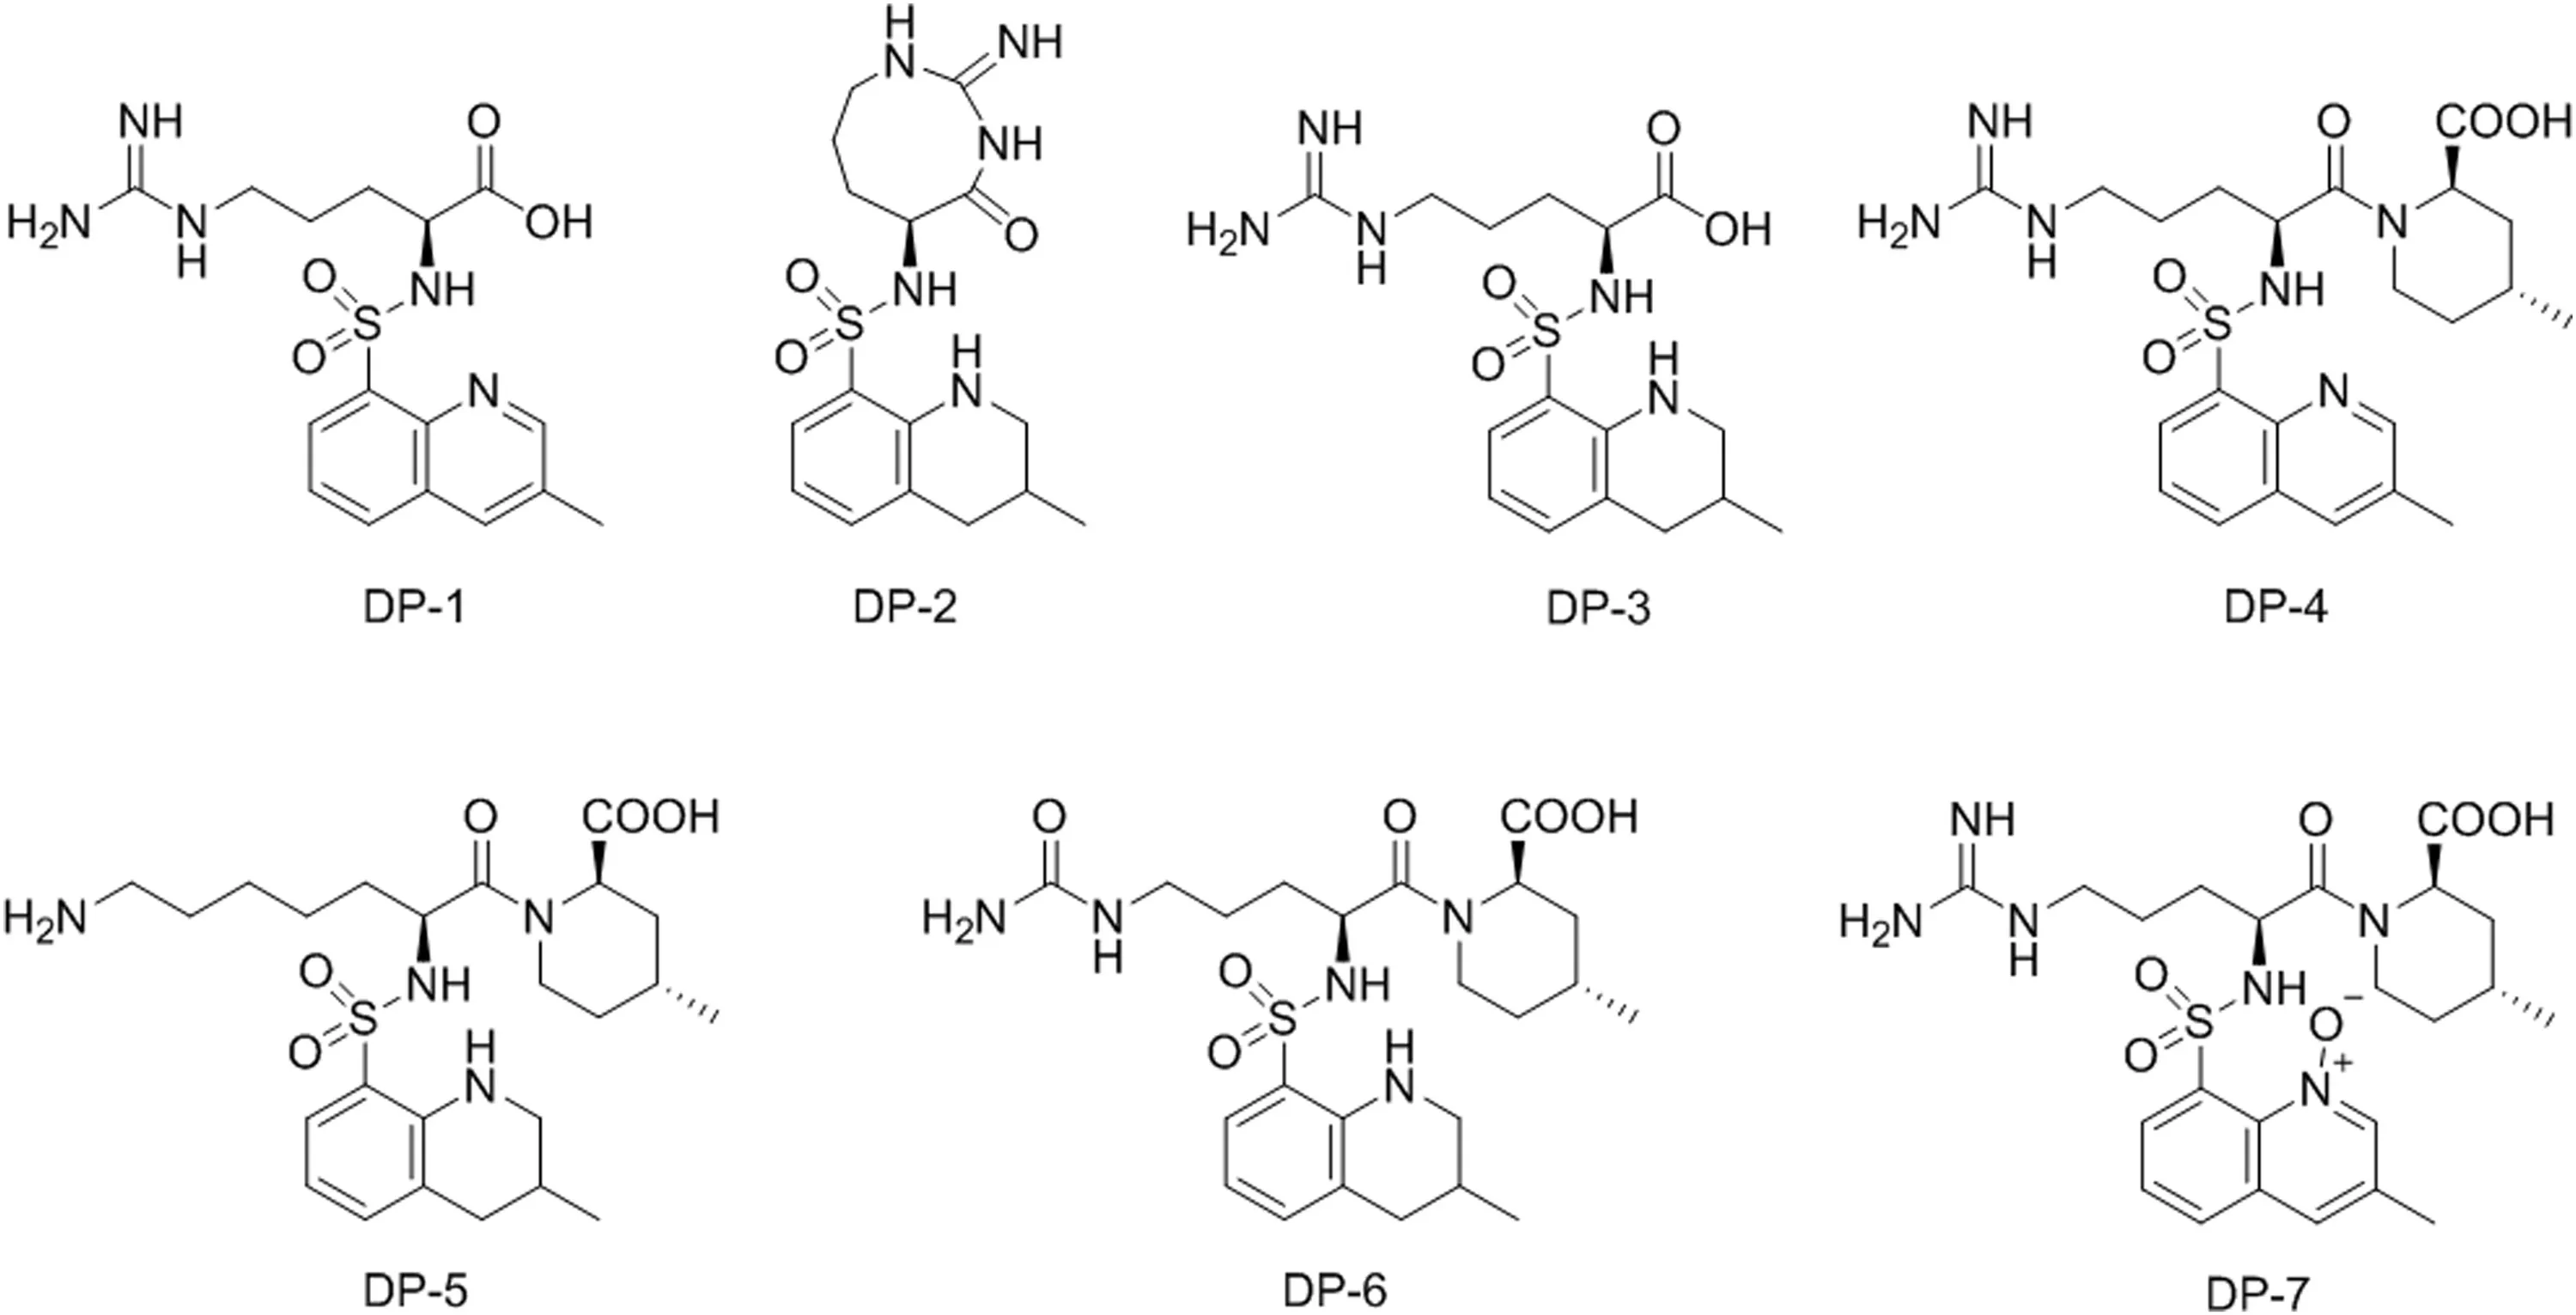
Fig.2.Argatroban degradation products(DP-1 to DP-7).
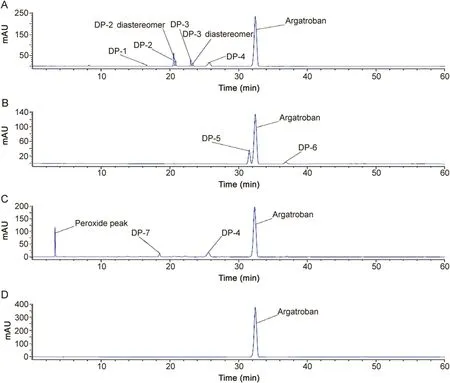
Fig.3.HPLC chromatogram of force degradation products(DP-1 to DP-7)and standard solution of argatroban.(A)acid hydrolysis,(B)alkaline hydrolysis,(C)peroxide hydrolysis,and(D)argatroban API.
The chromatographic conditions for LC–MS-Ion trap and Q-TOF-MSnstudies were the same as those for the HPLC method.The LC–MS-Ion trap and Q-TOF-MSnstudies were carried out using positive as well as negative electro spray ionization.The operating conditions for LC–MS-Ion trap 6310 scan of argatroban and degradation products in+ESI mode were optimized as follows:Octopole RF amplitude,187.1 Vpp;capillary exit,128.5 V;capillary,3500 V;skimmer,40.0 V;Octopole,1 DC 12.0 V;Octopole,1 DC 1.7 V;nebulizer,65.0 psi;dry gas,9.0 L/min,and dry temperature,350°C;vaporizer temperature,250 °C;and the mass scan range,120–1000 m/z.
The operating conditions for QTOF 6530 model Agilent scan of argatroban and degradation products in+ESI mode were optimized and the source parameters are as follows:gas temp,290°C;gas f l ow,8 L/min;nebulizer,40 psig;sheath gas temp,290°C;sheath gas f l ow,11 L/min;and scan segment,positive polarity.The scan source parameters were as follows:VCap,3500;nozzle voltage,1000 V;fragmentor,150;skimmer1,65 and Octopole RF peak,750.The operating conditions for MSnscan of all the degradation products of the drug were in+ESI mode and the mass spectra were recorded across the range of 100-1000 m/z.
2.6.Isolation of degradation products(DP-2&DP-7)by preparative HPLC
A Shimadzu preparative HPLC equipped with UV–visible detector was employed for the isolation of DP-2 using Sun fire C18(250 mm × 19 mm,10 μm)column.The flow rate was 15 mL/min and the detection was carried out at 259 nm.The mobile phase consisted part A(0.1%formic acid)and part B(acetonitrile).A gradient elution of T(min)/%of B:0.01/10,15/30,21/60,22/10,and 26/10 was followed for linear gradient.
3.Results and discussion
3.1.Stress decomposition behavior
The UV absorption spectrum of argatroban showed an absorption maximumλmaxat 259 nm and hence,it was chosen as detection wavelength in HPLC.Numerous variations in mobile phase compositions and columns led to the optimized chromatographic conditions that resolved argatroban and all degradation products formed under different conditions in a single run.These chromatographic conditions were used to study degradation behavior of argatroban as well as for LC–MS-Ion trap/Q-TOF-MSnstudies.There was no degradation observed in LC–PDA chromatogram of the standard solution of argatroban.
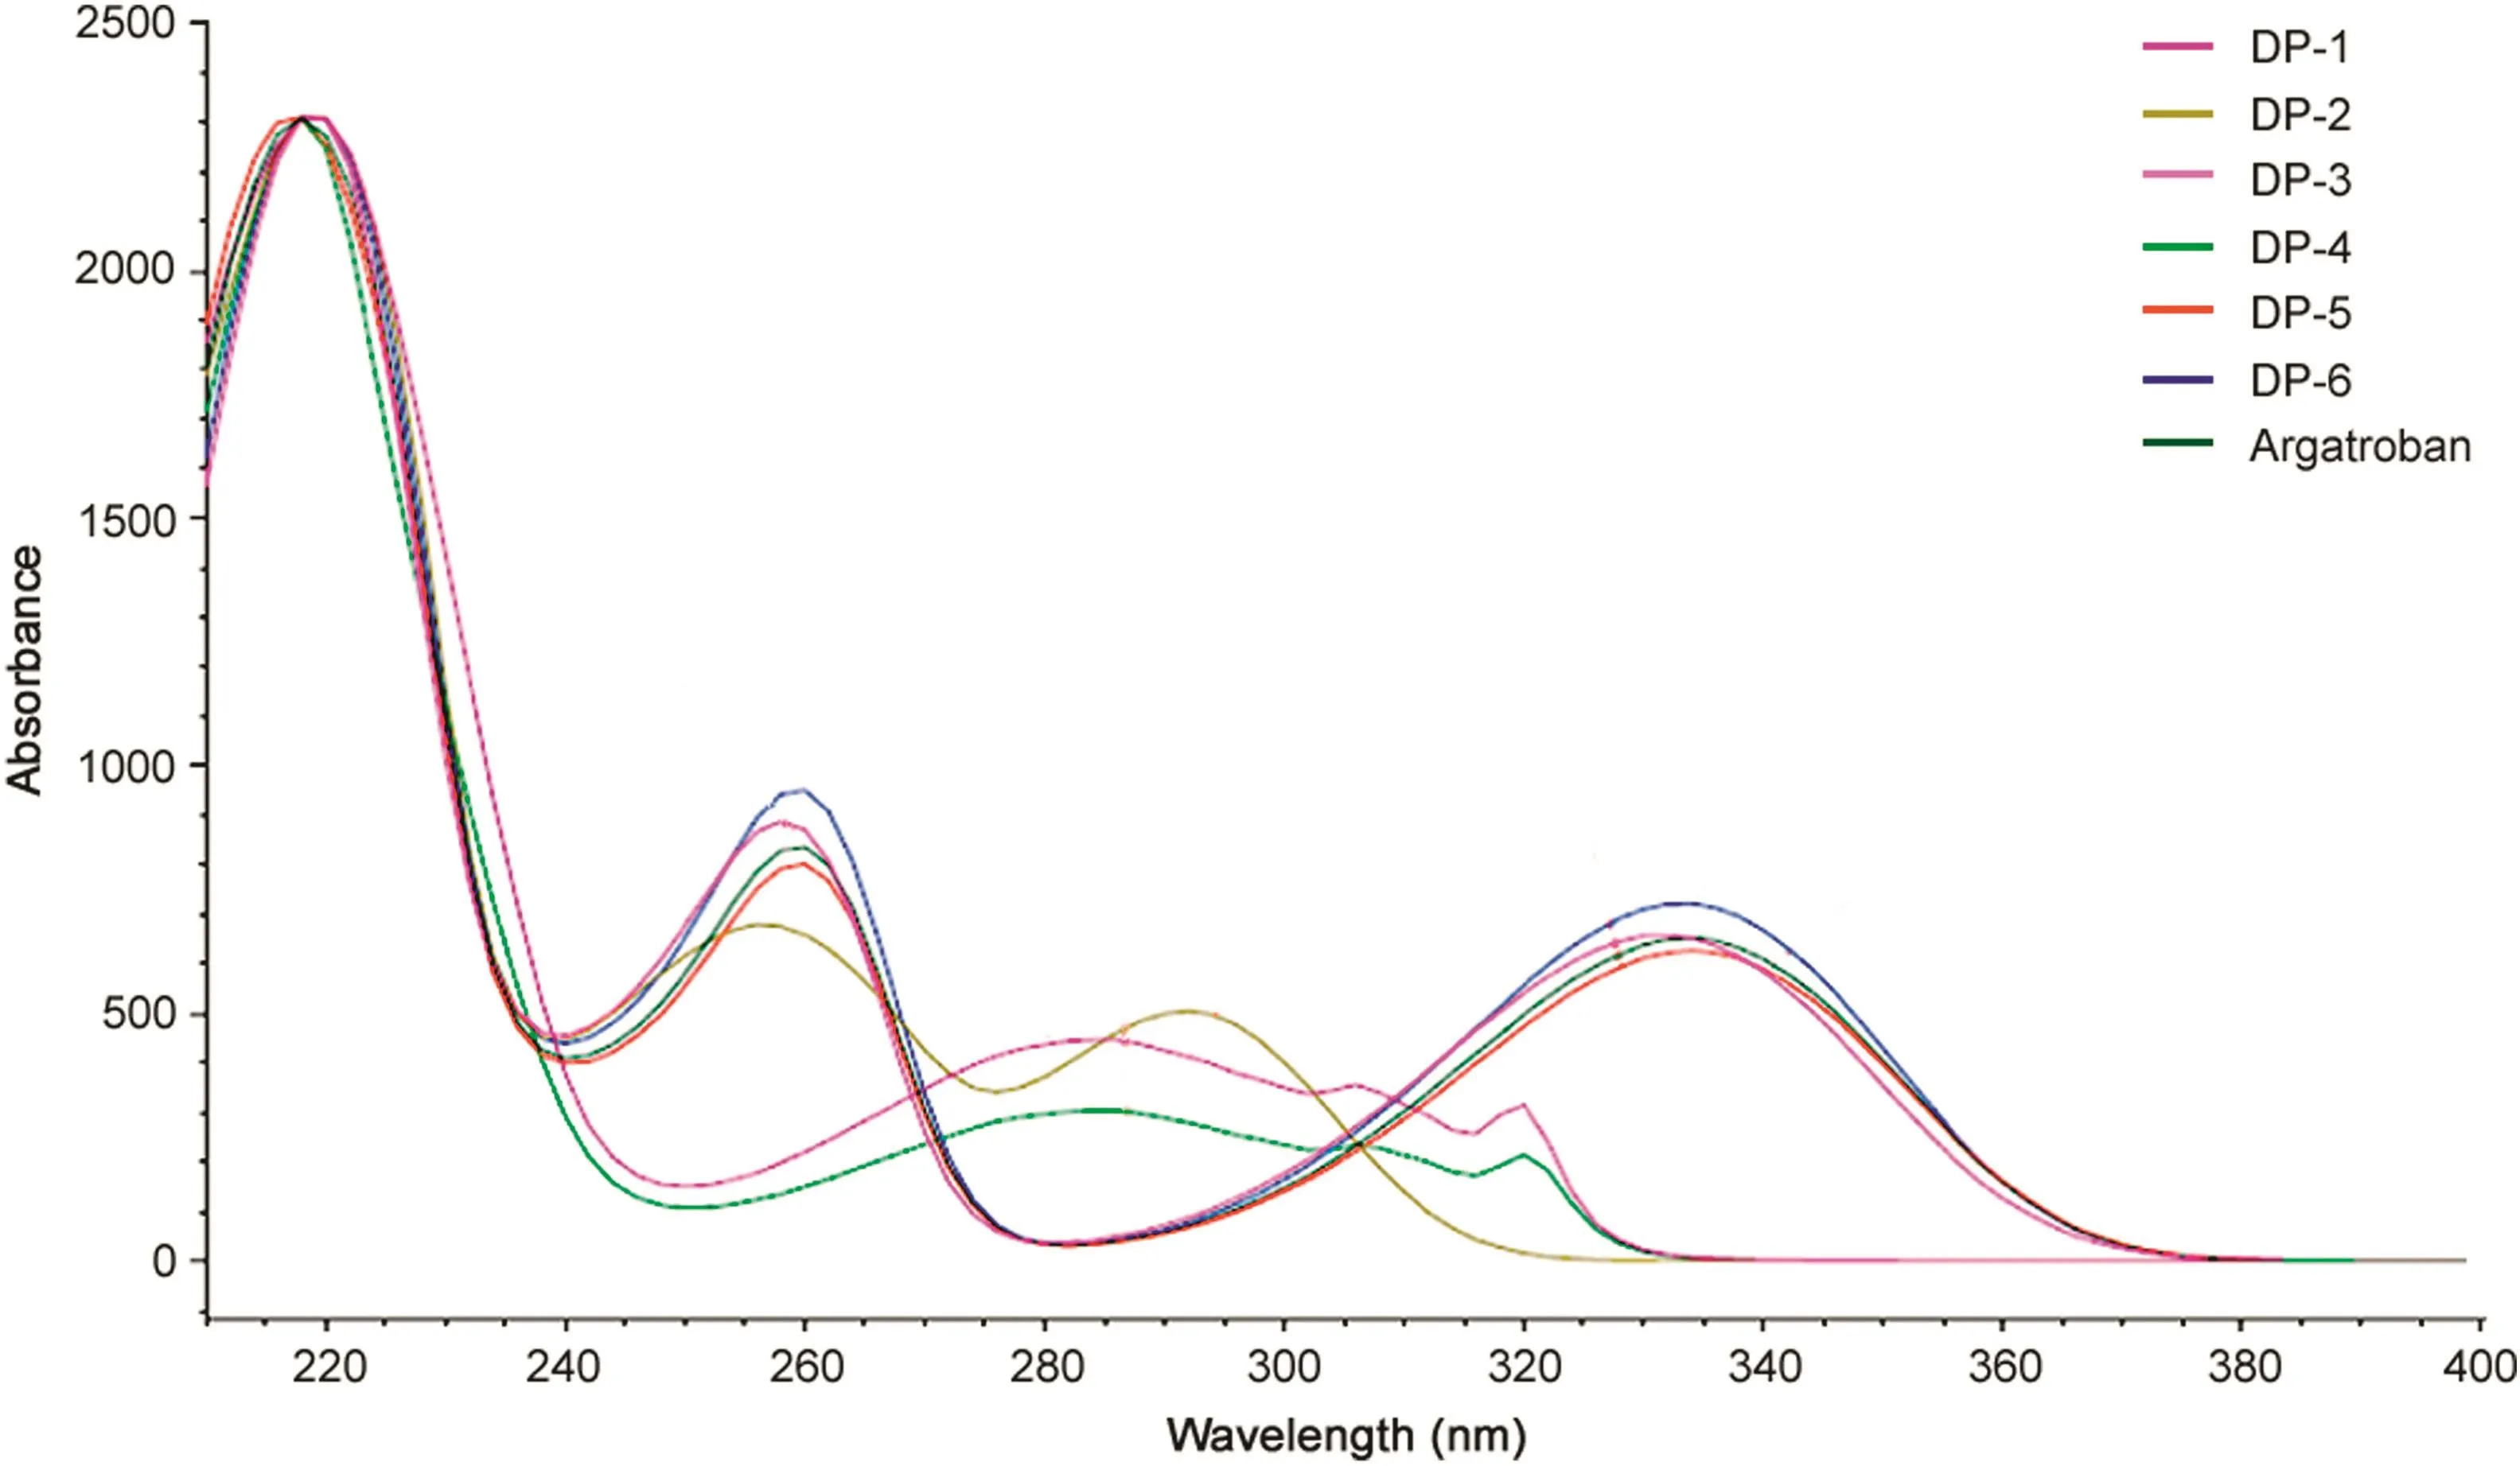
Fig.4.UV spectra of argatroban and its degradation products(DP-1 to DP-6).

Fig.5.Proposed mass fragmentation pattern of argatroban in+ESI mode.
In total,argatroban drug substance was degraded into seven major degradants which were denoted as DP-1 to DP-7(Fig.2)in accordance with the sequence in which the peak appeared from left to right in the chromatogram under various stress conditions.However,DP-4(6.5%)was observed in both acid and peroxide stress.Besides,DP-4 further converted into corresponding N-oxide product(DP-7)in peroxide stress.Subsequently,DP-4 further degraded into DP-1(0.5%)by hydrolysis of the amide functionality under acid stress.Similarly,DP-2(8.8%)was also one of the major degradants in acid stress and formed through internal cyclization of DP-3(4.4%),which in turn degraded from argatroban under acid stress.The chemical structure of DP-2 was confirmed by high resolution mass spectrometry(HRMS),NMR and heteronuclear multiple bond correlation(HMBC)studies.Apart from these,two major degradants were also observed in base stress,DP-5(15.0%)and DP-6(3.0%).There was no degradation observed under thermal and photolytic conditions and hence argatroban drug substance was found to be stable in thermal and photolytic conditions.
3.2.LC-PDA study
LC-PDA chromatogram showing separation of all the degradation products of argatroban using a PDA detector is shown in Fig.3.The UV absorption behavior of degradation products(DP-1,DP-2,DP-3,DP-4,DP-5 and DP-6)was similar to that of argatroban(λmax259 nm)and the UV absorption spectra is shown in Fig.4.However,DP-1,DP-4 and DP-7 showed maximum absorbance at 280 nm,which indicates that these degradant products have different chromophoric nature with respect to argatroban,which indirectly gave evidence that these three degradants have an extended conjugation in their structural motif.
3.3.Fragmentation pathway of argatroban
Seven stages mass spectra(MS7)of argatroban were performed to outline its mass fragmentation pattern for supplementary characterization of the degradation products(Fig.5).The drug was detected as parent ion(M1)at m/z 509.2478 corresponding to its molecular mass of 508.2467 Da.Fragmentation of M1in MS2spectrum produced product ion of m/z 384.1700 possibly due to the loss of 4-methylpiperidine-2-carboxylic acid(143.0946 Da).The MS2fragmented ions,further fragmented in MS3at m/z 237.0652 and m/z 146.0970,were proposed to be formed by the loss of N-sulfo-5-guanidinopentanoic acid(237.0652 Da)and loss of 3-methyl-1,2,3,4-tetrahydroquinoline(146.0970 Da),from MS2moiety,respectively.The MS3which was employed as precursor ion to record MS4spectrum showed a daughter ion of m/z 193.0759.This is due to elimination of CO2(44 Da)from COOH group and N-sulfo-5-guanidinopentanoic acid moiety,respectively.The MS5,MS6,and MS7were further fragmented to three fragmented ions of m/z 162.0939,m/z 129.1135 and m/z 112.0869,respectively.In order to facilitate characterization of the degradation products,the chemical structure of argatroban has been viewed as two components i.e.,4-methylpiperidine-2-carboxylic acid and 3-methyl-1,2,3,4-tetrahydroquinoline-8-sulfinic acid connected through a C-N bond linkage.
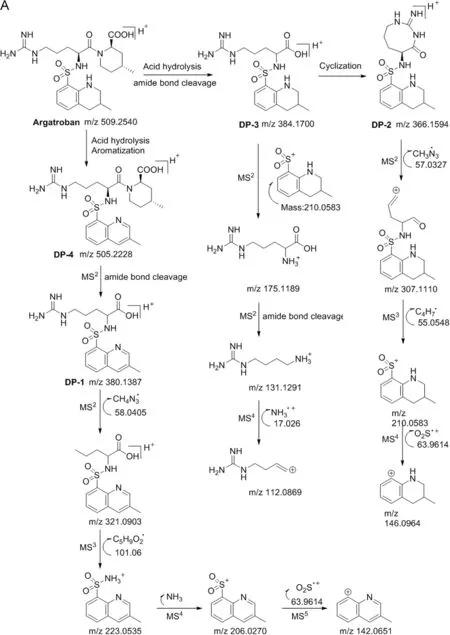
Fig.6.Fragmentation patterns of(A)DP-2,DP-3 and DP-4;(B)DP-1 and DP-7;and(C)DP-5 and DP-6.
3.4.Characterization of degradation products
3.4.1.Characterization of DP-1
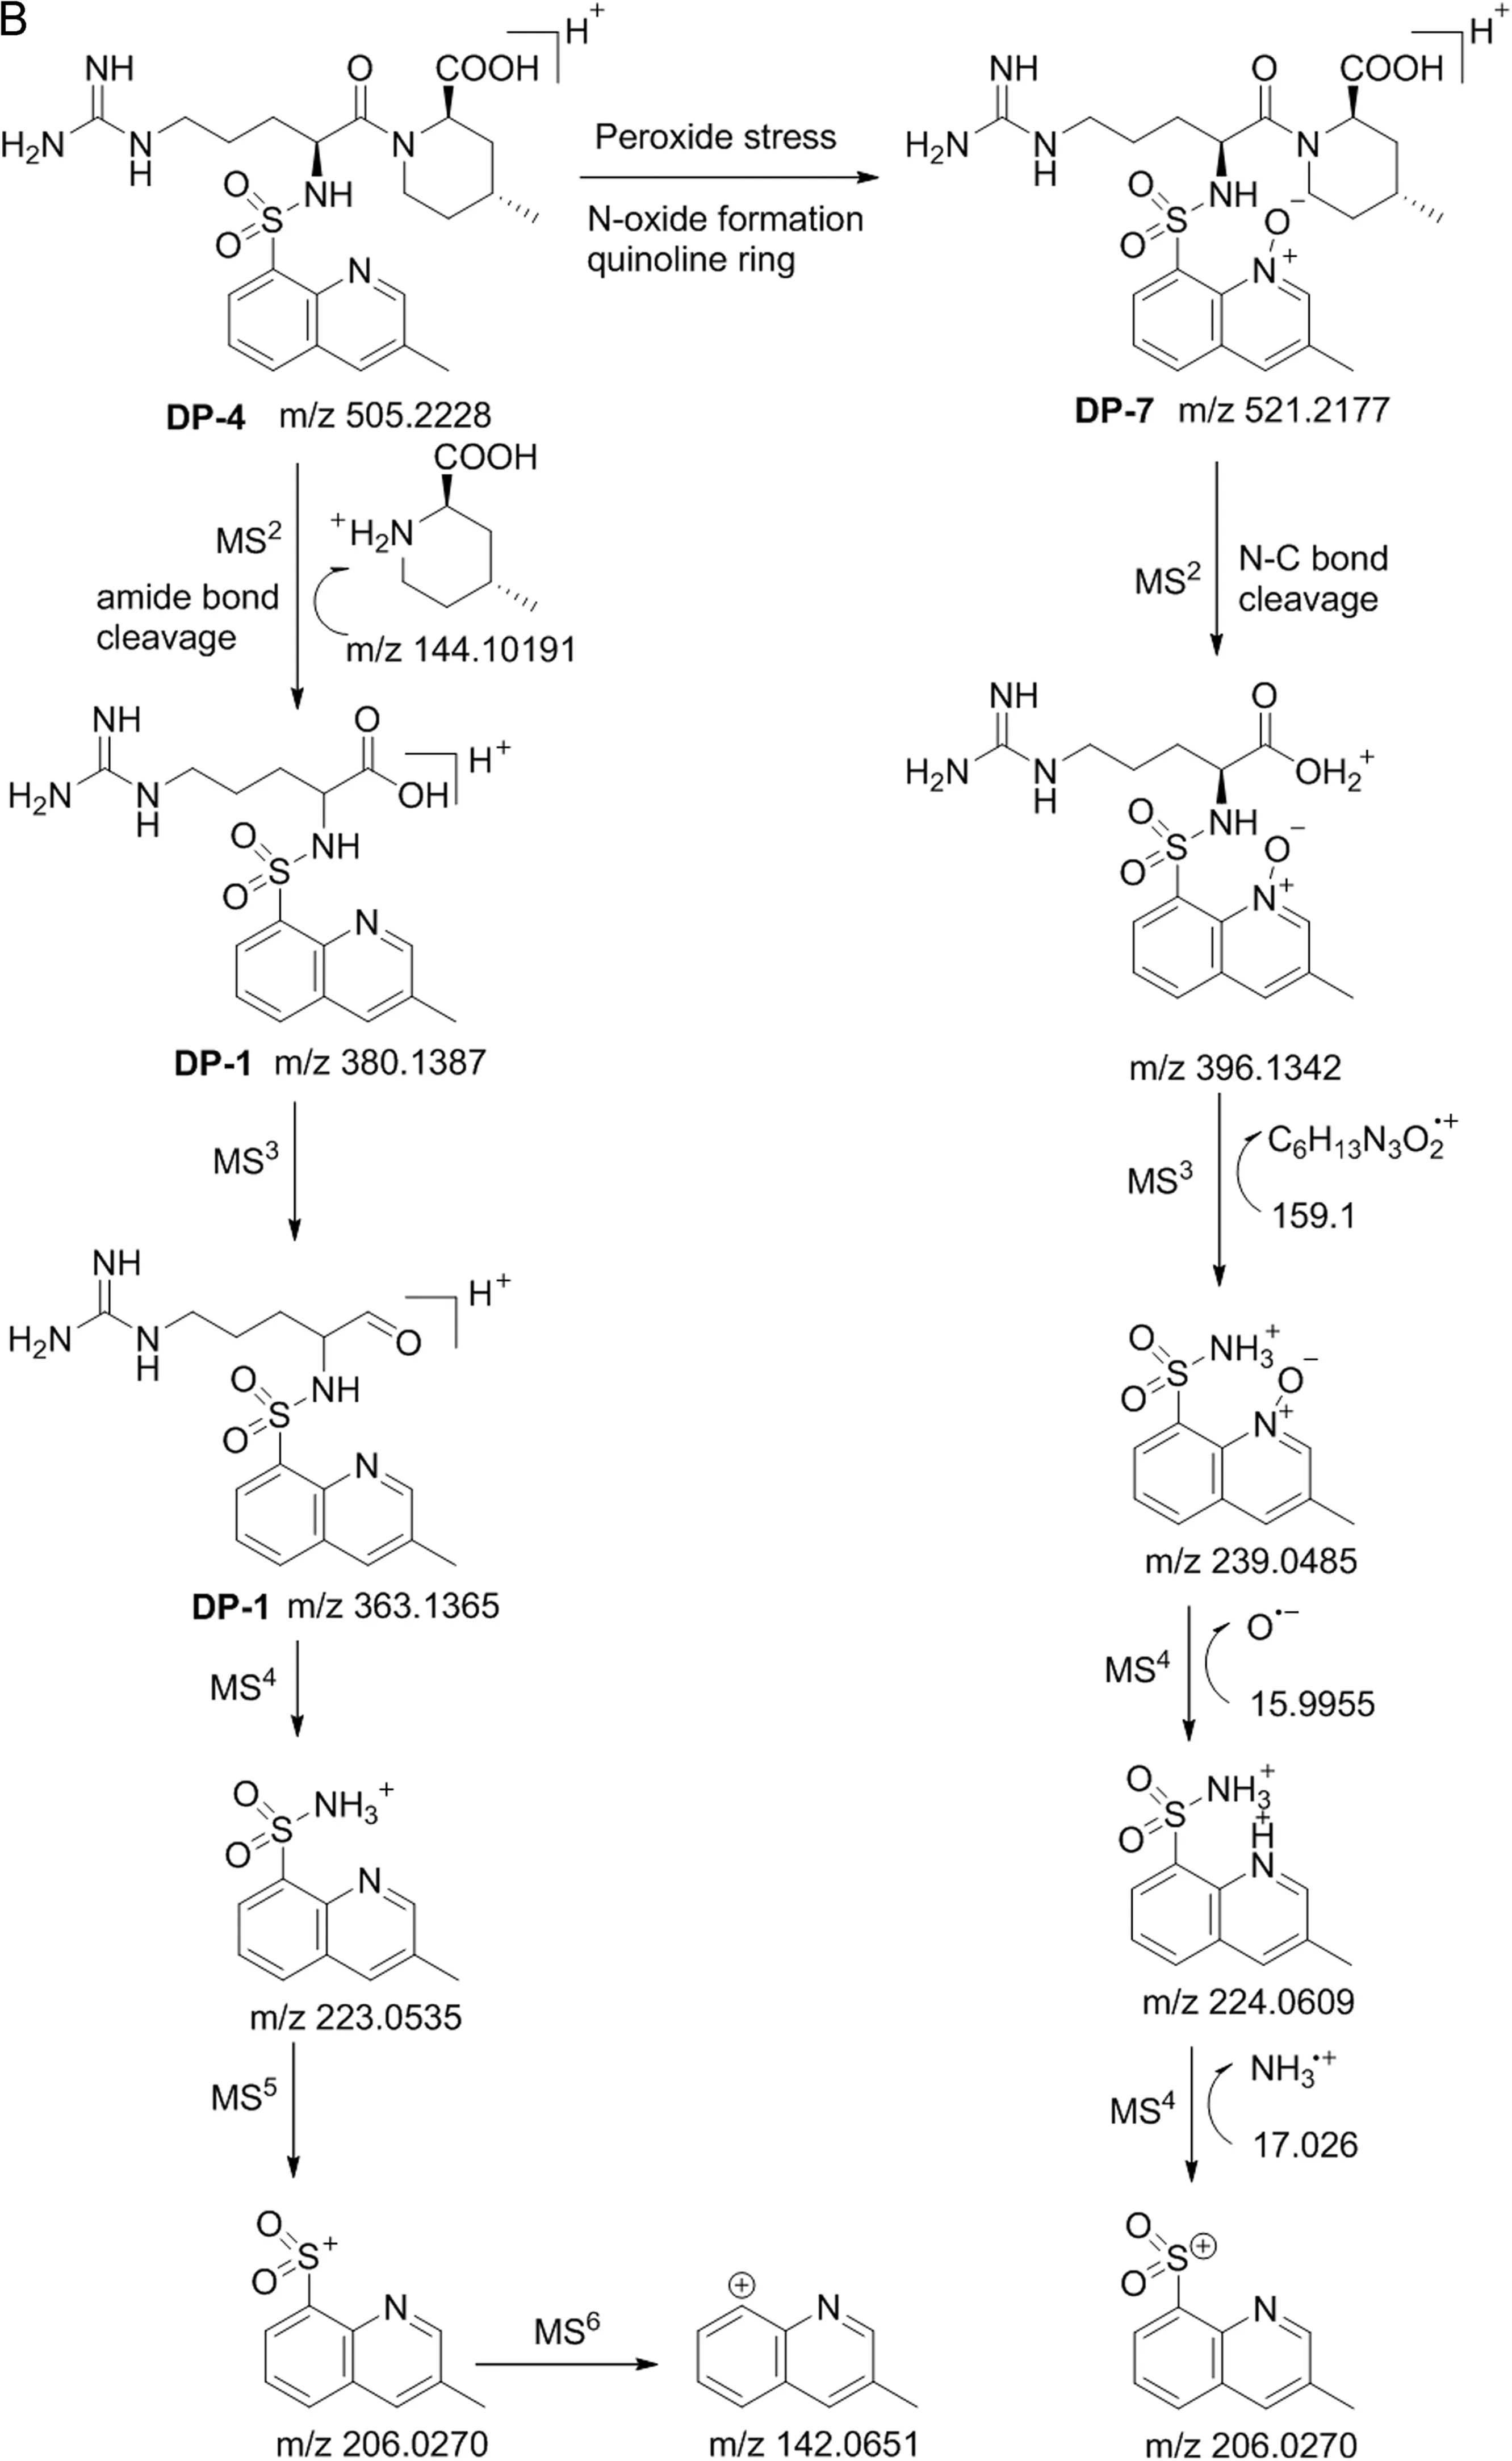
Fig.6.(continued)
The LC–MS result shows that the mass for DP-1 was at m/z 380.1387 as a parent ion(M1).Fragmentation of M1in MS2spectrum produced a product ion of m/z 321.0903(MS2)due to the elimination of guanidyl moiety(58.0405 Da).The further MS3fragmentation of MS2ion produced an ion at m/z 223.0535.The MS4fragmentation of MS3formed a daughter ion at m/z 206.0270 due to the elimination of ammonium ion.In addition,MS5fragmentation of MS4generated a daughter ion at m/z 142.0651 due to elimination of sulfonyl group.Based on the fragmentation,it is suggested that the compound has a quinoline ring in the structural motif.Based on LC–MS results and MS/MS fragmentation pattern it is concluded that DP-1 is formed by the acid hydrolysis of DP-4.The compound was further confirmed by1H(Fig.S1),13C NMR and IR spectral analysis.
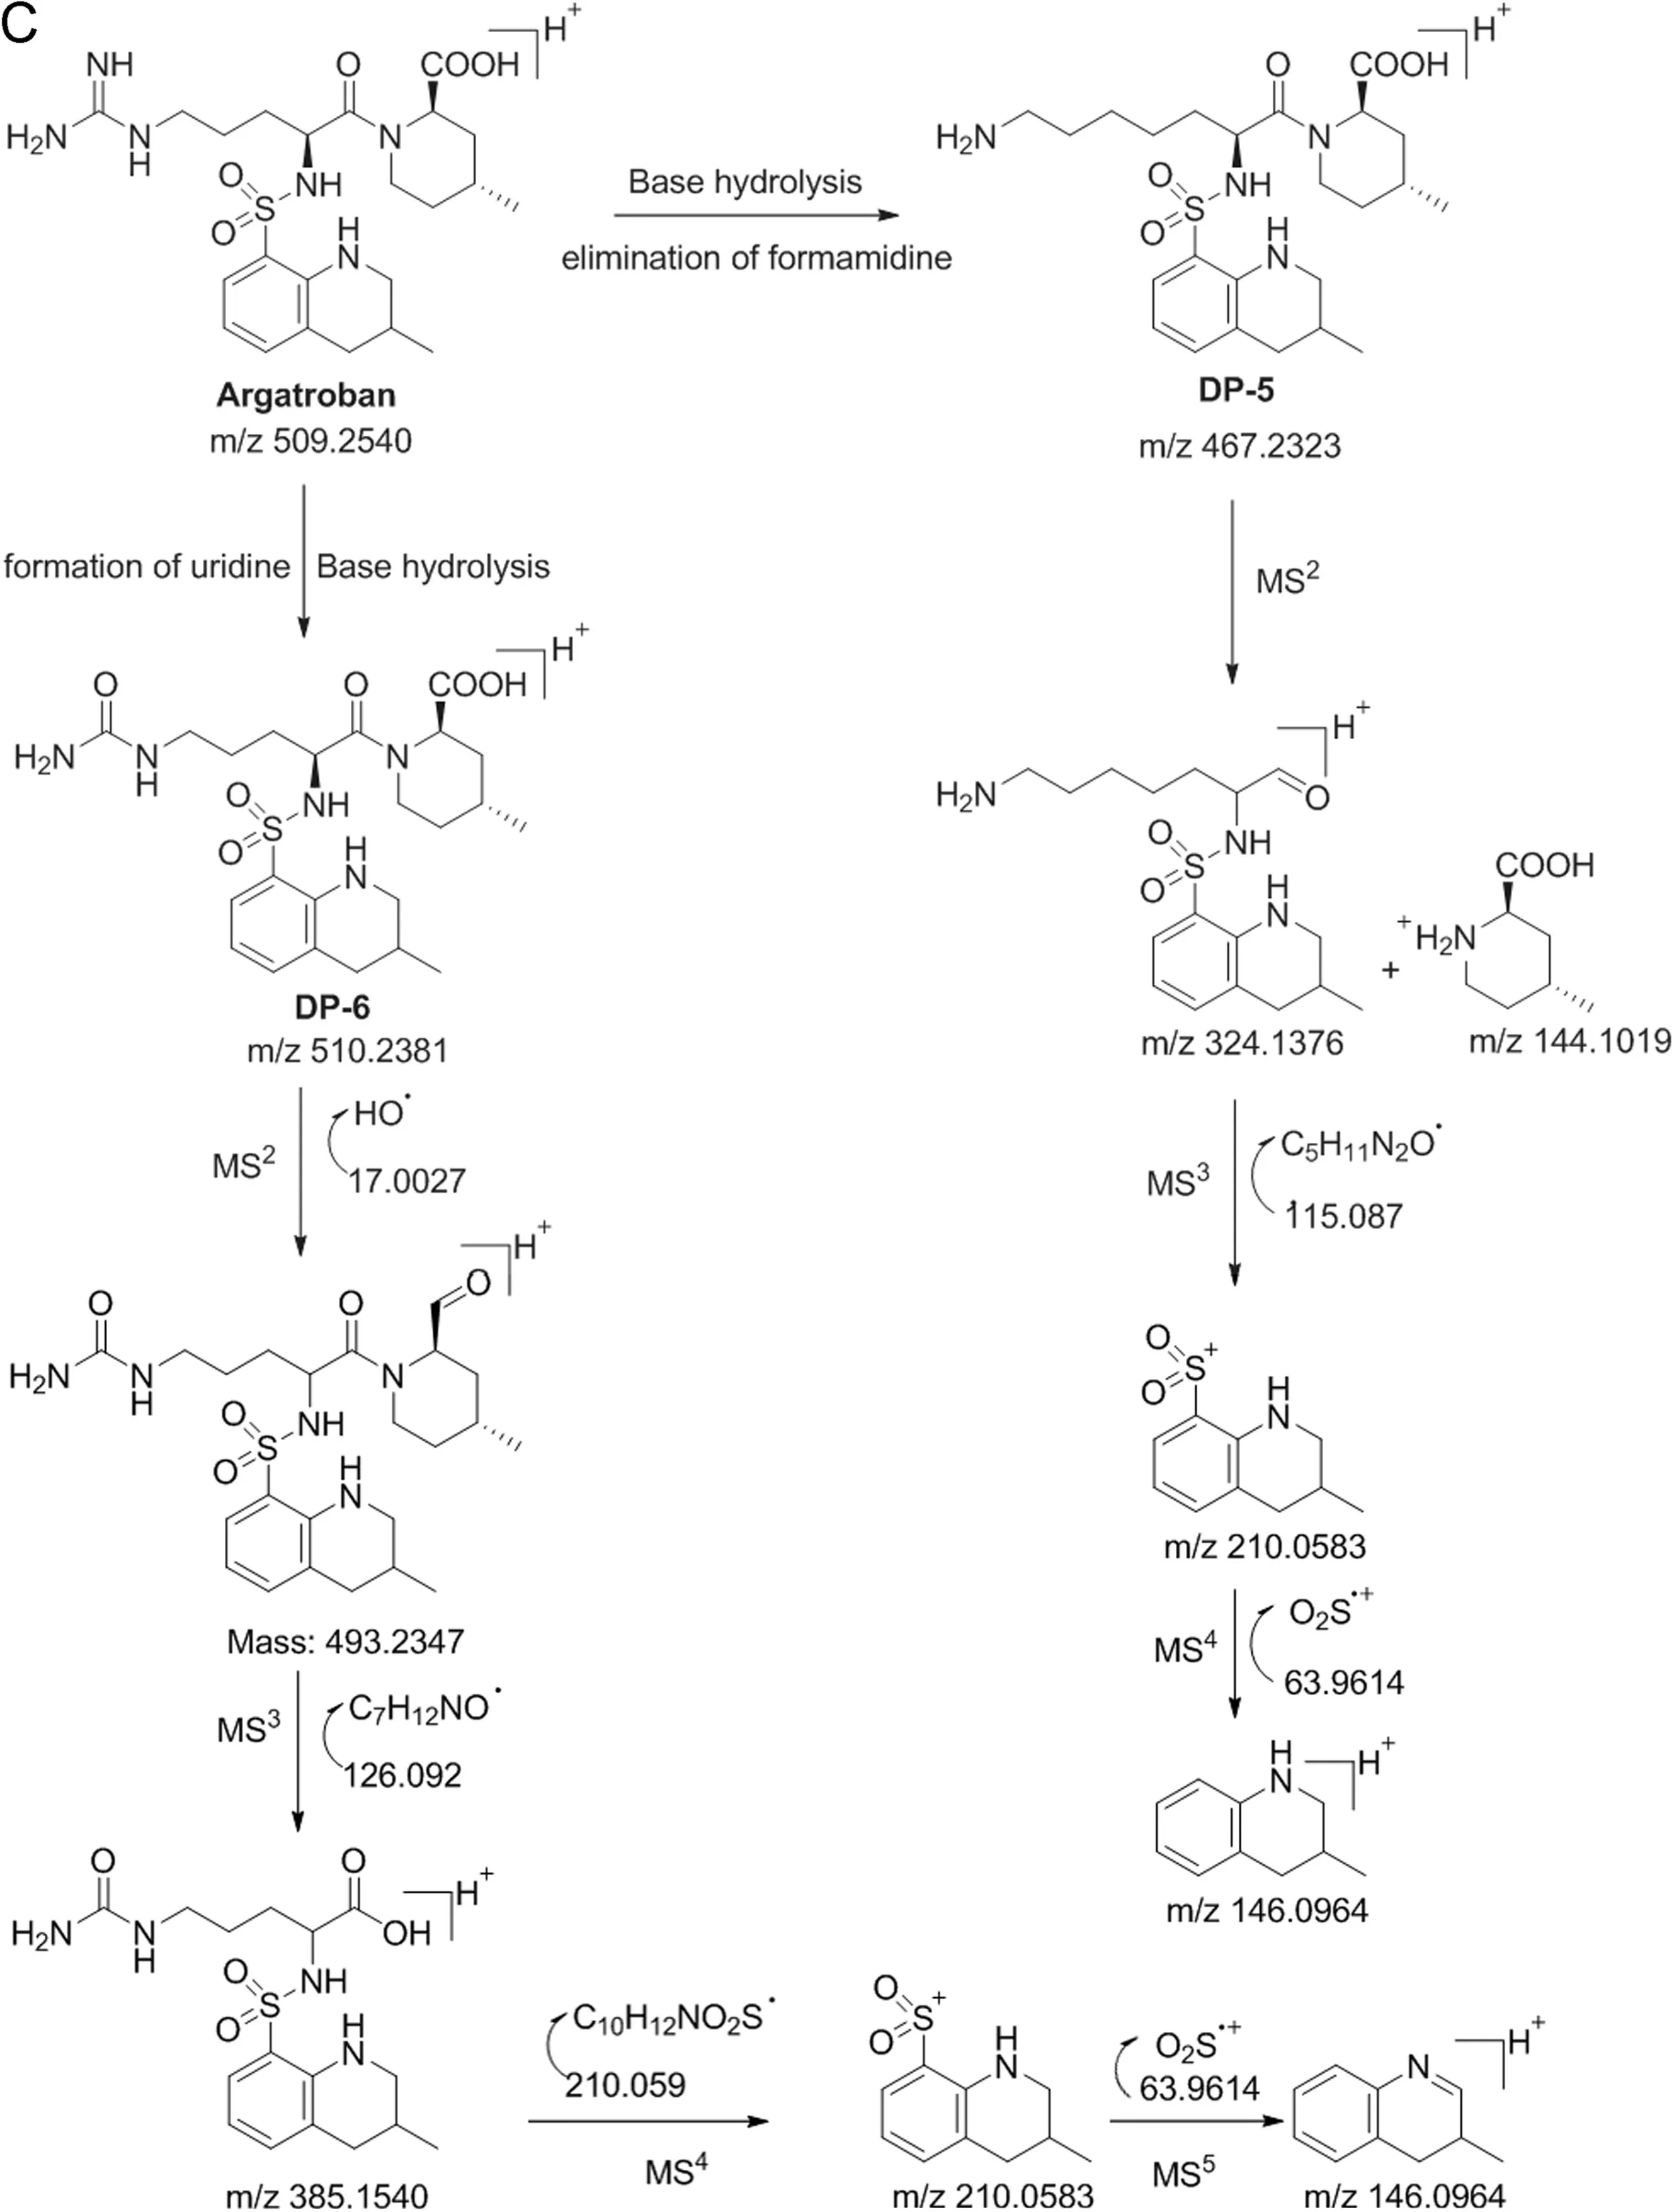
Fig.6.(continued)
3.4.2.Characterization of DP-2
Four stage MS/MS fragmentation studies were performed to characterize DP-2.The LC-MS result shows that the mass was found at m/z 366.1594 for the parent ion(M1)in positive mode.The probability of the formation of the degradant by internal cyclization of DP-3 is due to loss of water molecule.The further MS2fragmentation of M1produced a daughter ion at m/z 307.1110 by the elimination of guanidyl group,which confirmed that the degradant has an eight membered cyclic ring.Besides,MS3fragmentation of MS2ion generated a daughter ion at m/z 210.0583 by the cleavage of sulfonamide bond,con firming that the compound has a tetrahydro quinoline ring attached through sulfonamide group.Further,MS4fragmentation of MS3generated a daughter ion at m/z 146.0964 by the elimination of sulfonyl group,which con firms that the compound has a sulfonyl moiety.Based on the above MS/MS fragmentation pattern,DP-2 was con firmed as containing an eight membered cyclic ring attached with quinoline sulfonyl group.The structure of the compound was further confirmed by1H(Fig.S2),13C NMR and HMBC studies.
3.4.3.Characterization of DP-3
Similarly,LC-MS/Q-TOF results of DP-3 show that the mass at m/z 384.1700 for the parent ion(M1)confirms that the compound is generated by the direct hydrolysis of argatroban.For further confirmation of the structure,MS/MS fragmentation study was chosen.The MS2fragmentation of M1at m/z 384.1700 shows a daughter ion at m/z 175.189 which matches with the argininemoiety due to the cleavage of sulfonamide,confirming that the compound has L-arginine connected with quinoline ring through sulfonamide linkage.Further,MS3fragmentation of MS2ion delivered a daughter ion at m/z 131.1291 by the elimination CO2moiety from CO2H group.Furthermore,the MS4fragmentation of MS3ion generated a daughter ion at m/z 112.0869 by the elimination of ammonia.Based on the MS/MS fragmentation results the structure of the compound was assigned and is shown in Fig.6.The structure of the product was further confirmed by1H(Fig.S3),13C NMR and IR spectral analysis.
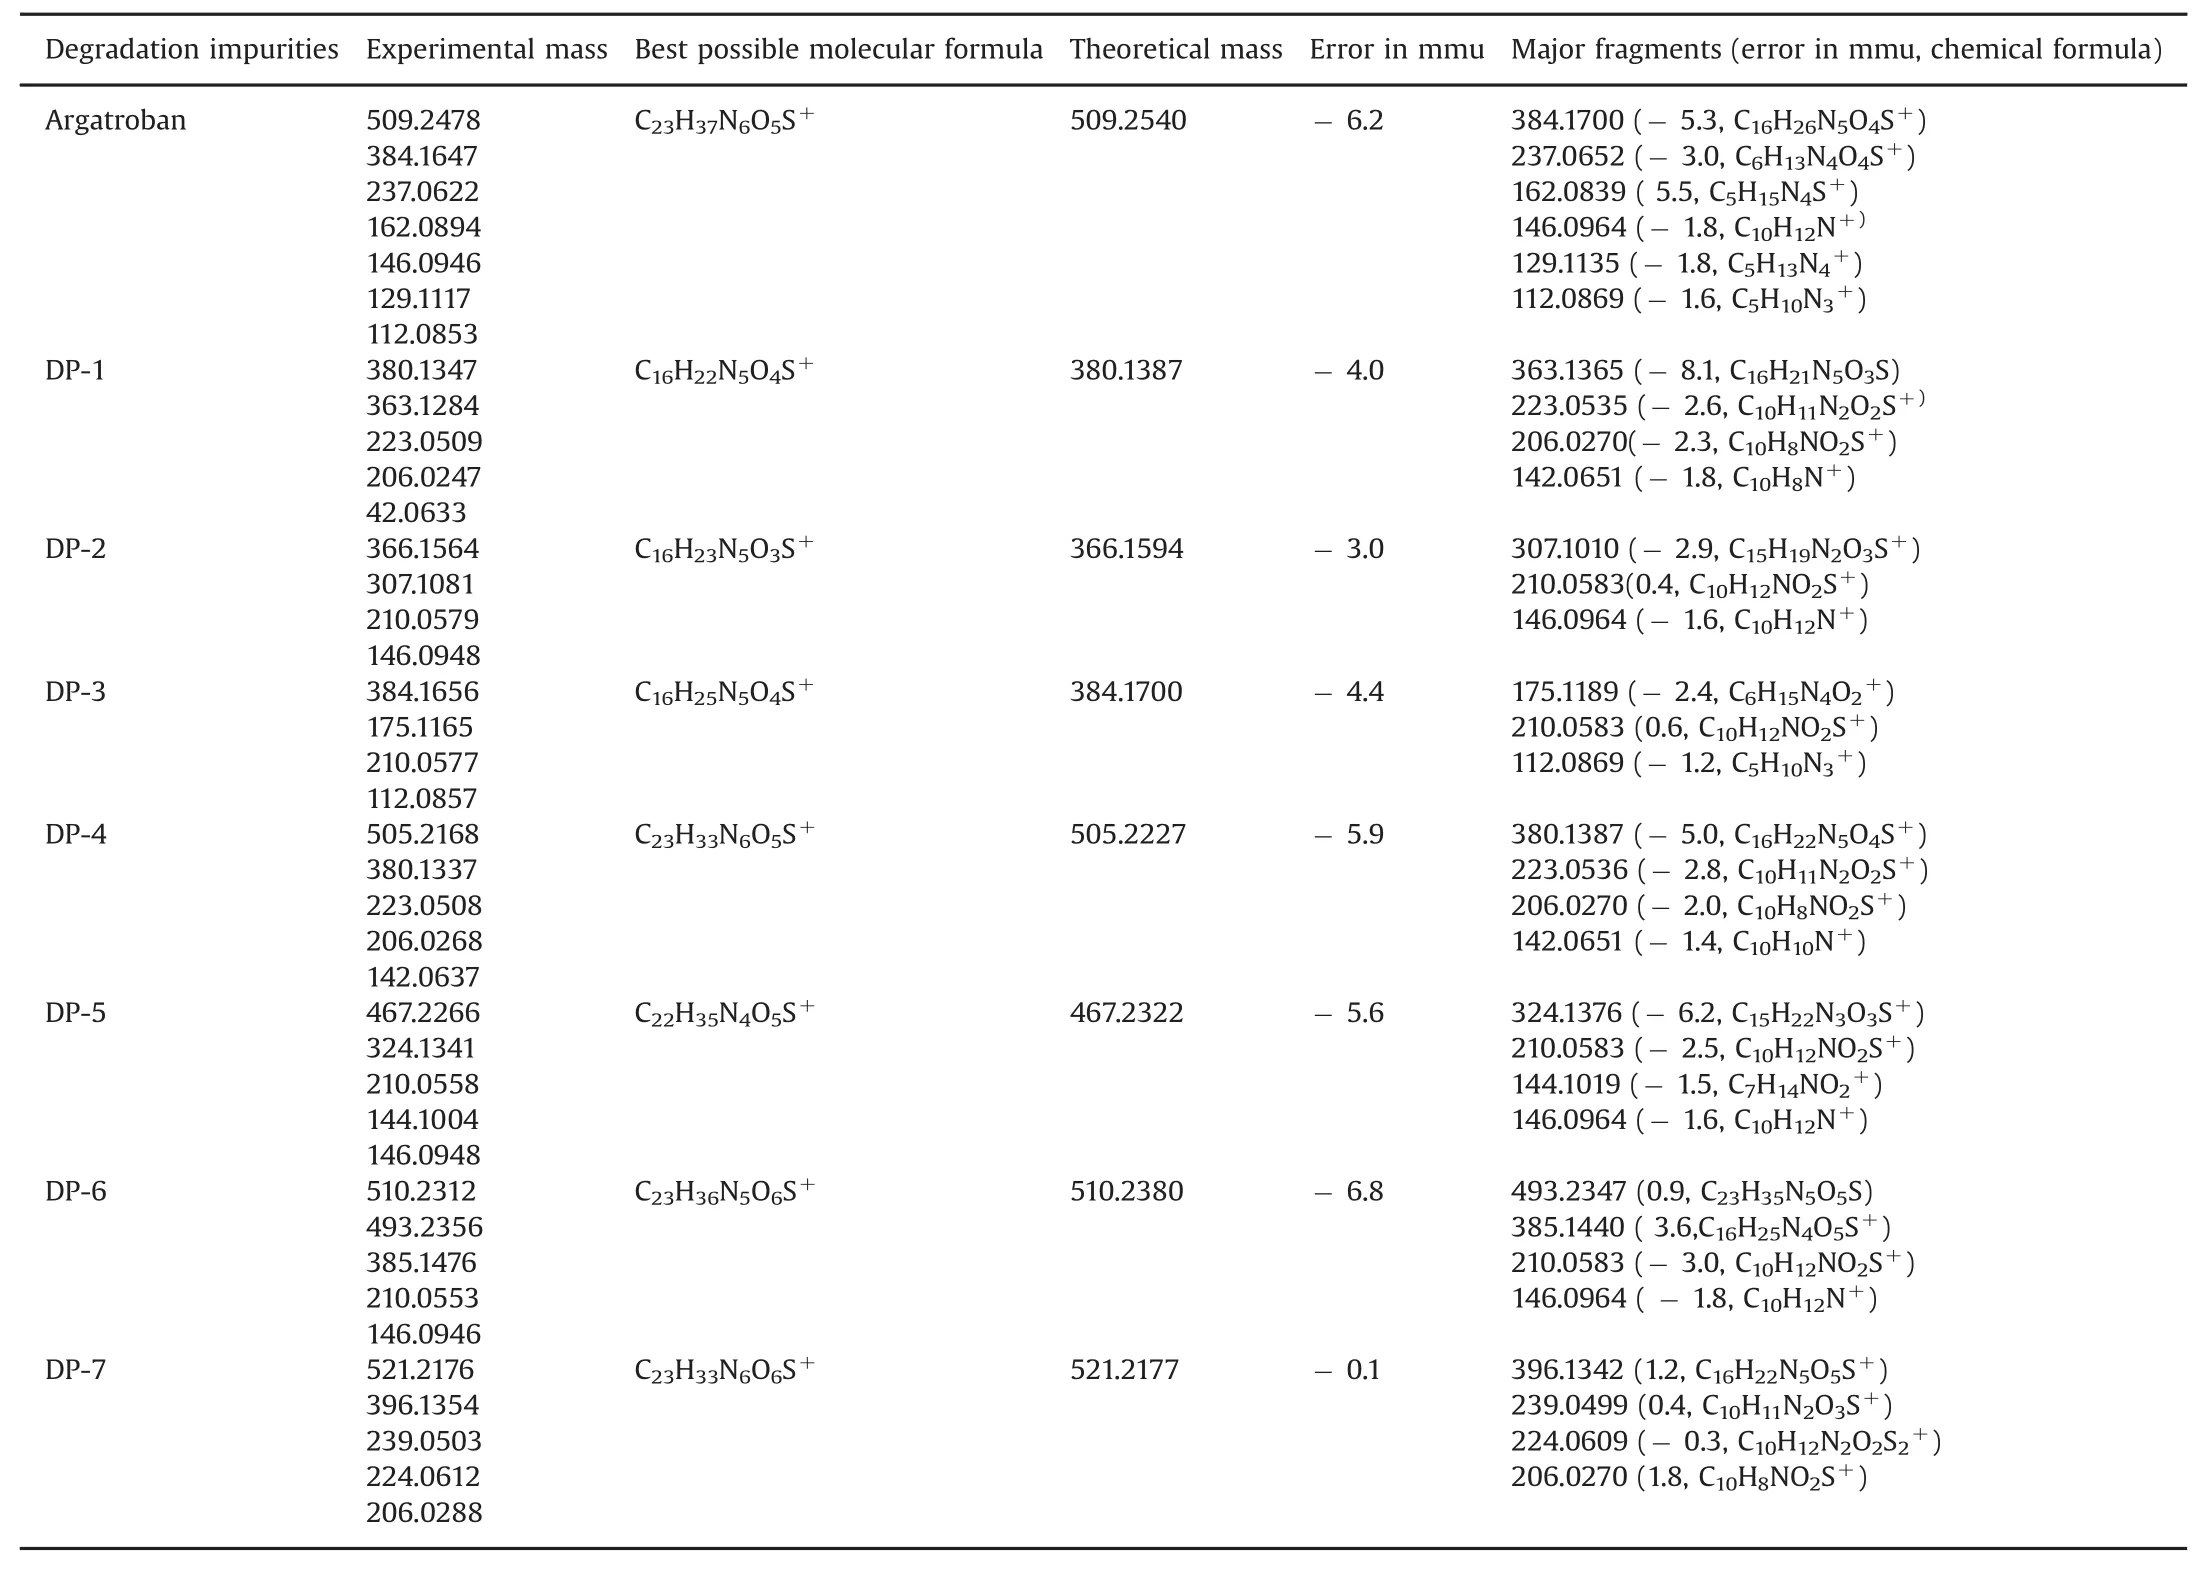
Table 1 LC–MS/Q-TOF data of(DP-1 to DP-7)along with their possible molecular formulae and major fragments.
3.4.4.Characterization of DP-4
The LC–MS/MS QTOF results revealed that the parent ion mass was found at m/z 505.2168(M1)for DP-4.Based on the difference in UV absorbance and four mass units less than that of the parent drug,oxidation might happen in the degradant.In order to identify the structure,further MS/MS fragmentation study was conducted.The MS2fragmentation of M1generated a daughter ion at m/z 380.1387,confirming the cleavage of amide bond,and is similar to the fragmentation observed in the parent drug but only differs in mass by 4 units,indirectly revealing that DP-4 has fully aromatized ring.Moreover,the MS3fragmentation of MS2by the loss of 17 units due to the elimination of OH group from carboxylic acid indicates that the compound has a carboxylic acid group in the structure.Further,MS4fragmentation of MS3produced a daughter ion at m/z 223.0535 due to the heterolytic cleavage of C-N bond in the precursor ion and further MS5and MS6fragmentations finally delivered a daughter ion at m/z 142.0651,confirming the 4-methyl quinoline ring.Based on the MS6fragmentation,DP-4 has a 4-methyl quinoline ring in the structure.Based on the LC-MS/QTOF and MS/MS fragmentation the structure of the compound is deduced as fully aromatized compound and the structure is shown in Fig.6.The degradation product structure was further evidenced by1H(Fig.S4),13C NMR and IR spectral analysis.
3.4.5.Characterization of DP-5
The mass was found for DP-5 at m/z 467.2323 for the parent ion(M1),which was formed by the cleavage of formamidine group from the guanidyl moiety of argatroban under base hydrolysis.The MS2fragmentation of the parent ion at m/z 467.2323 produced two daughter ions at m/z 324.1378 and at m/z 144.1019,respectively by the cleavage of the amide bond.The fragmentation pattern suggested that DP-5 has a tetrahydro quinoline as well as a 4-methyl-piperdine-2-carboxylic acid moiety.Similarly,the MS3(at m/z 210.0583)and MS4(m/z 146.0964)fragmentations confirm that the compound has a terahydro quinoline ring.Based on the LC-MS/QTOF and MS/MS fragmentation,the structure of the compound is deduced and is shown in Fig.6.The proposed structure was further confirmed by1H NMR(Fig.S5)and13C NMR spectral data.
3.4.6.Characterization of DP-6
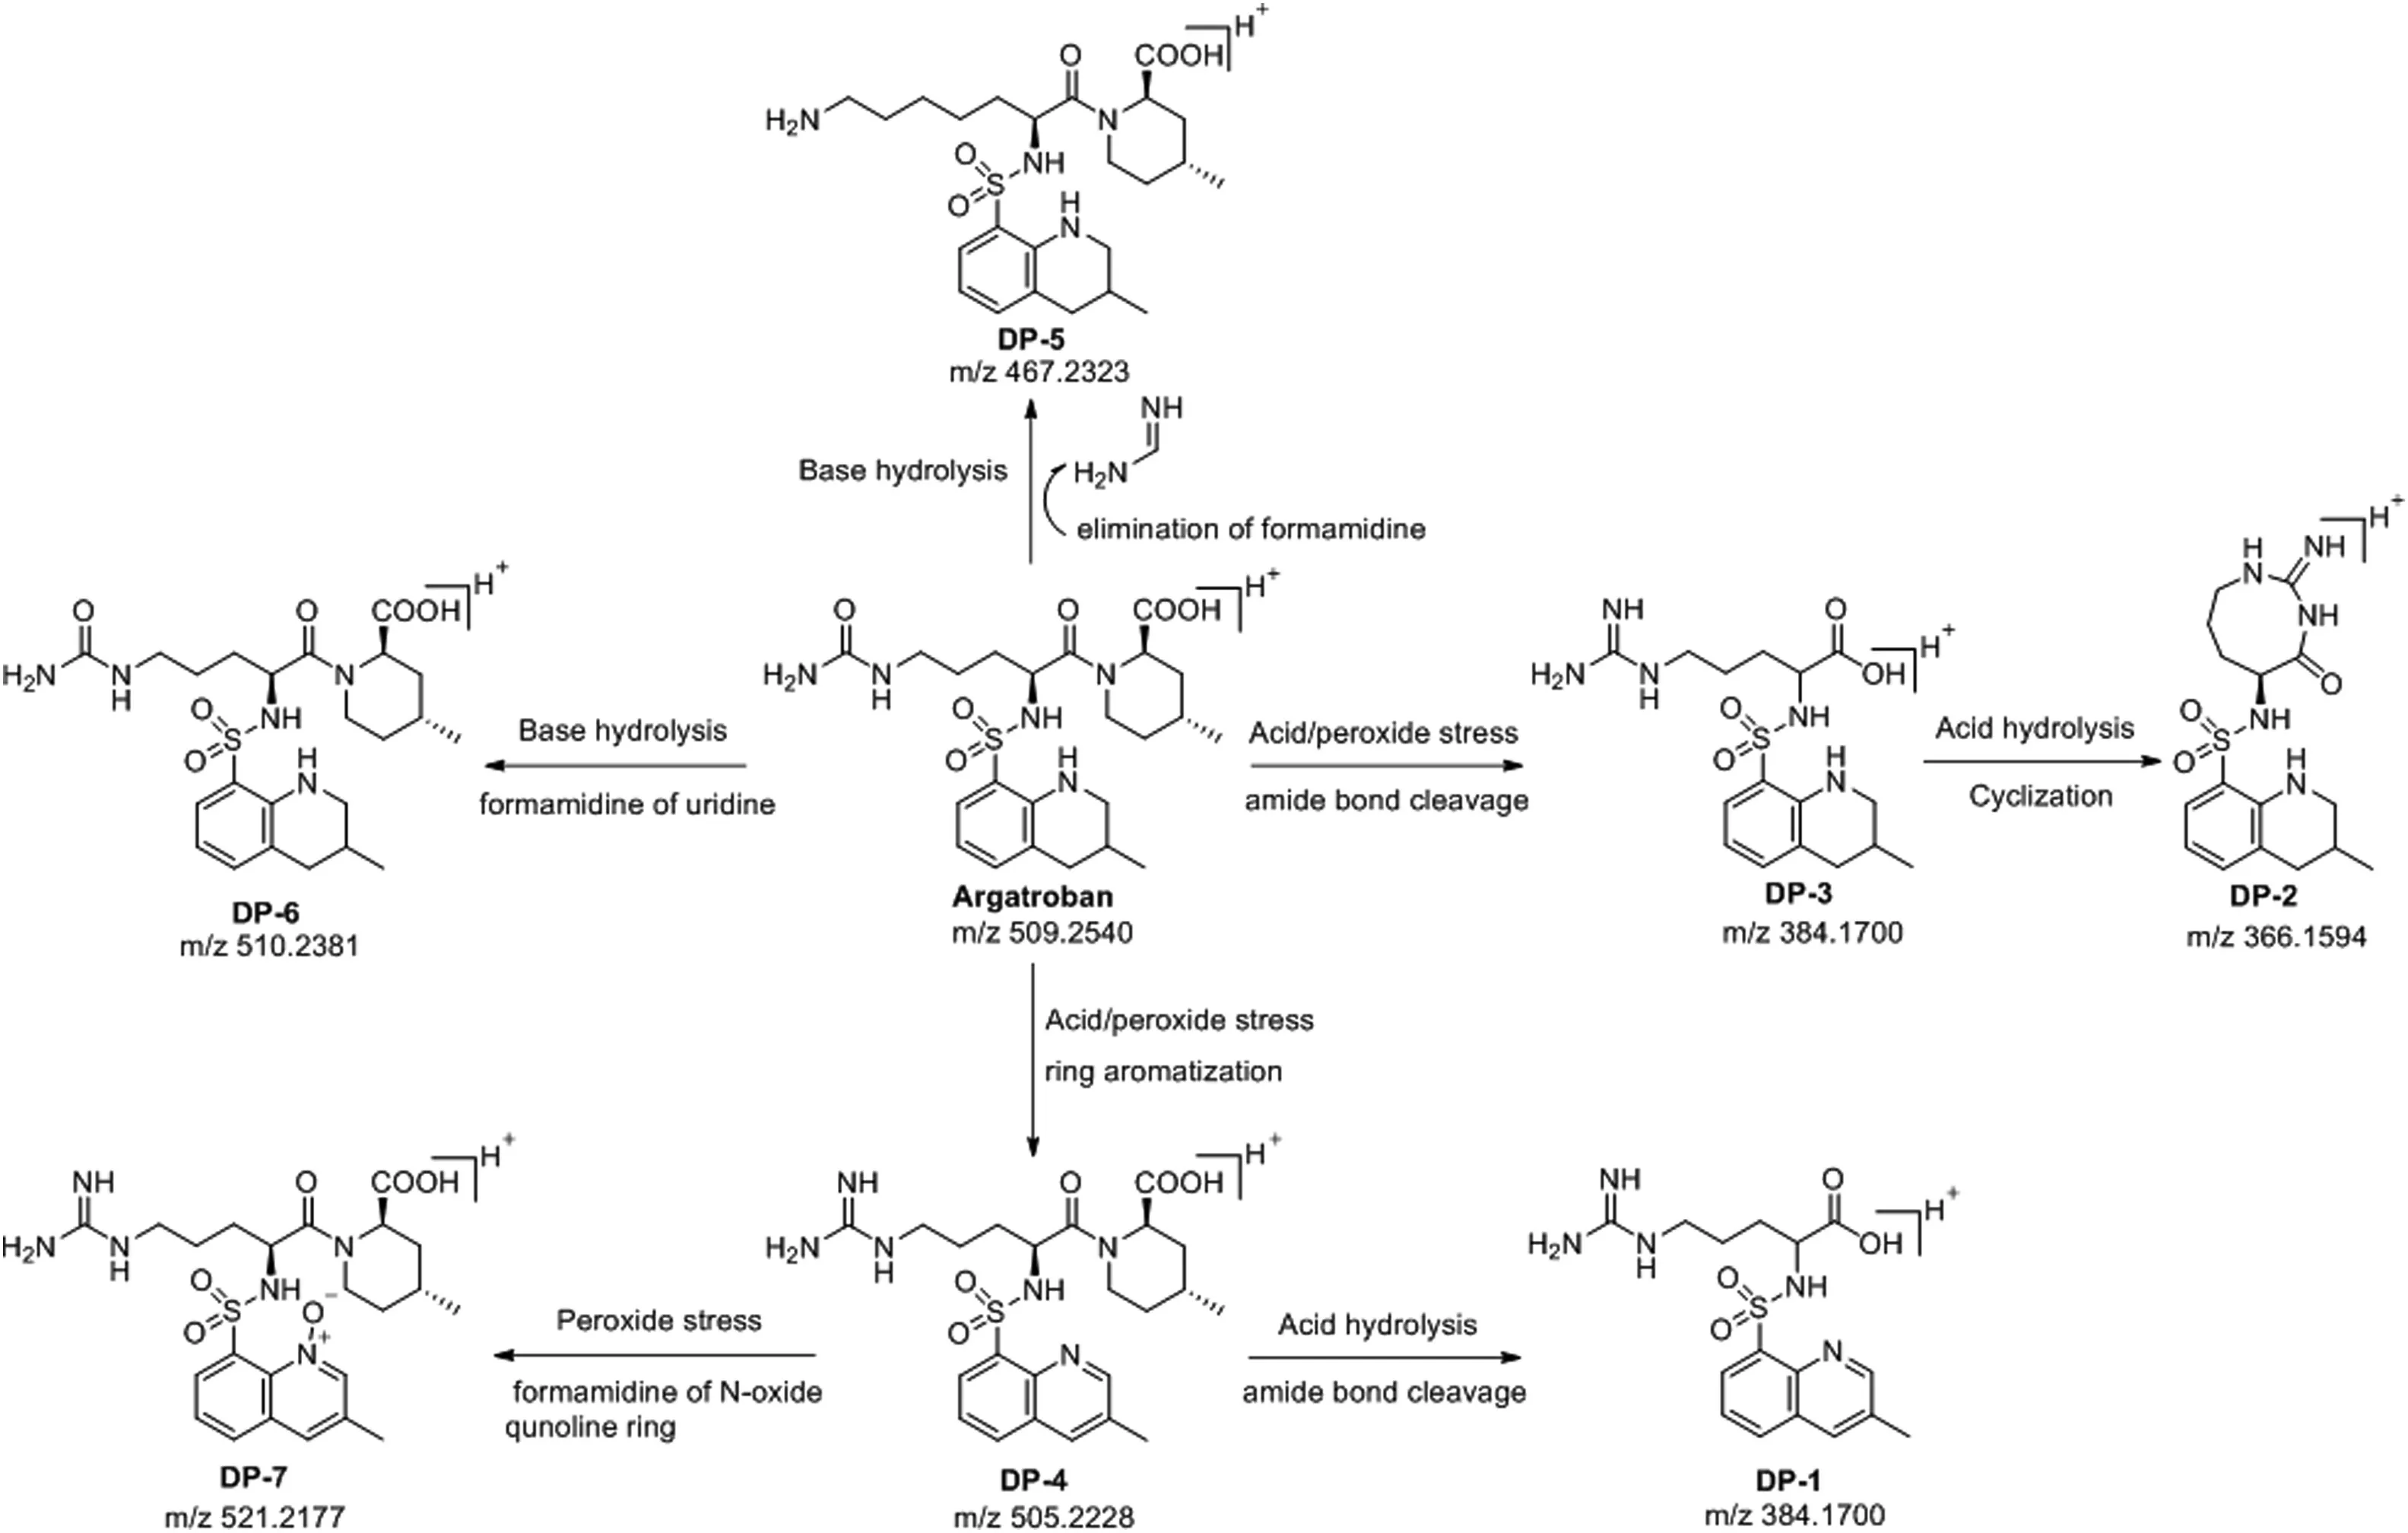
Fig.7.Argatroban and degradation products(DP-1 to DP-7)degradation pathway.
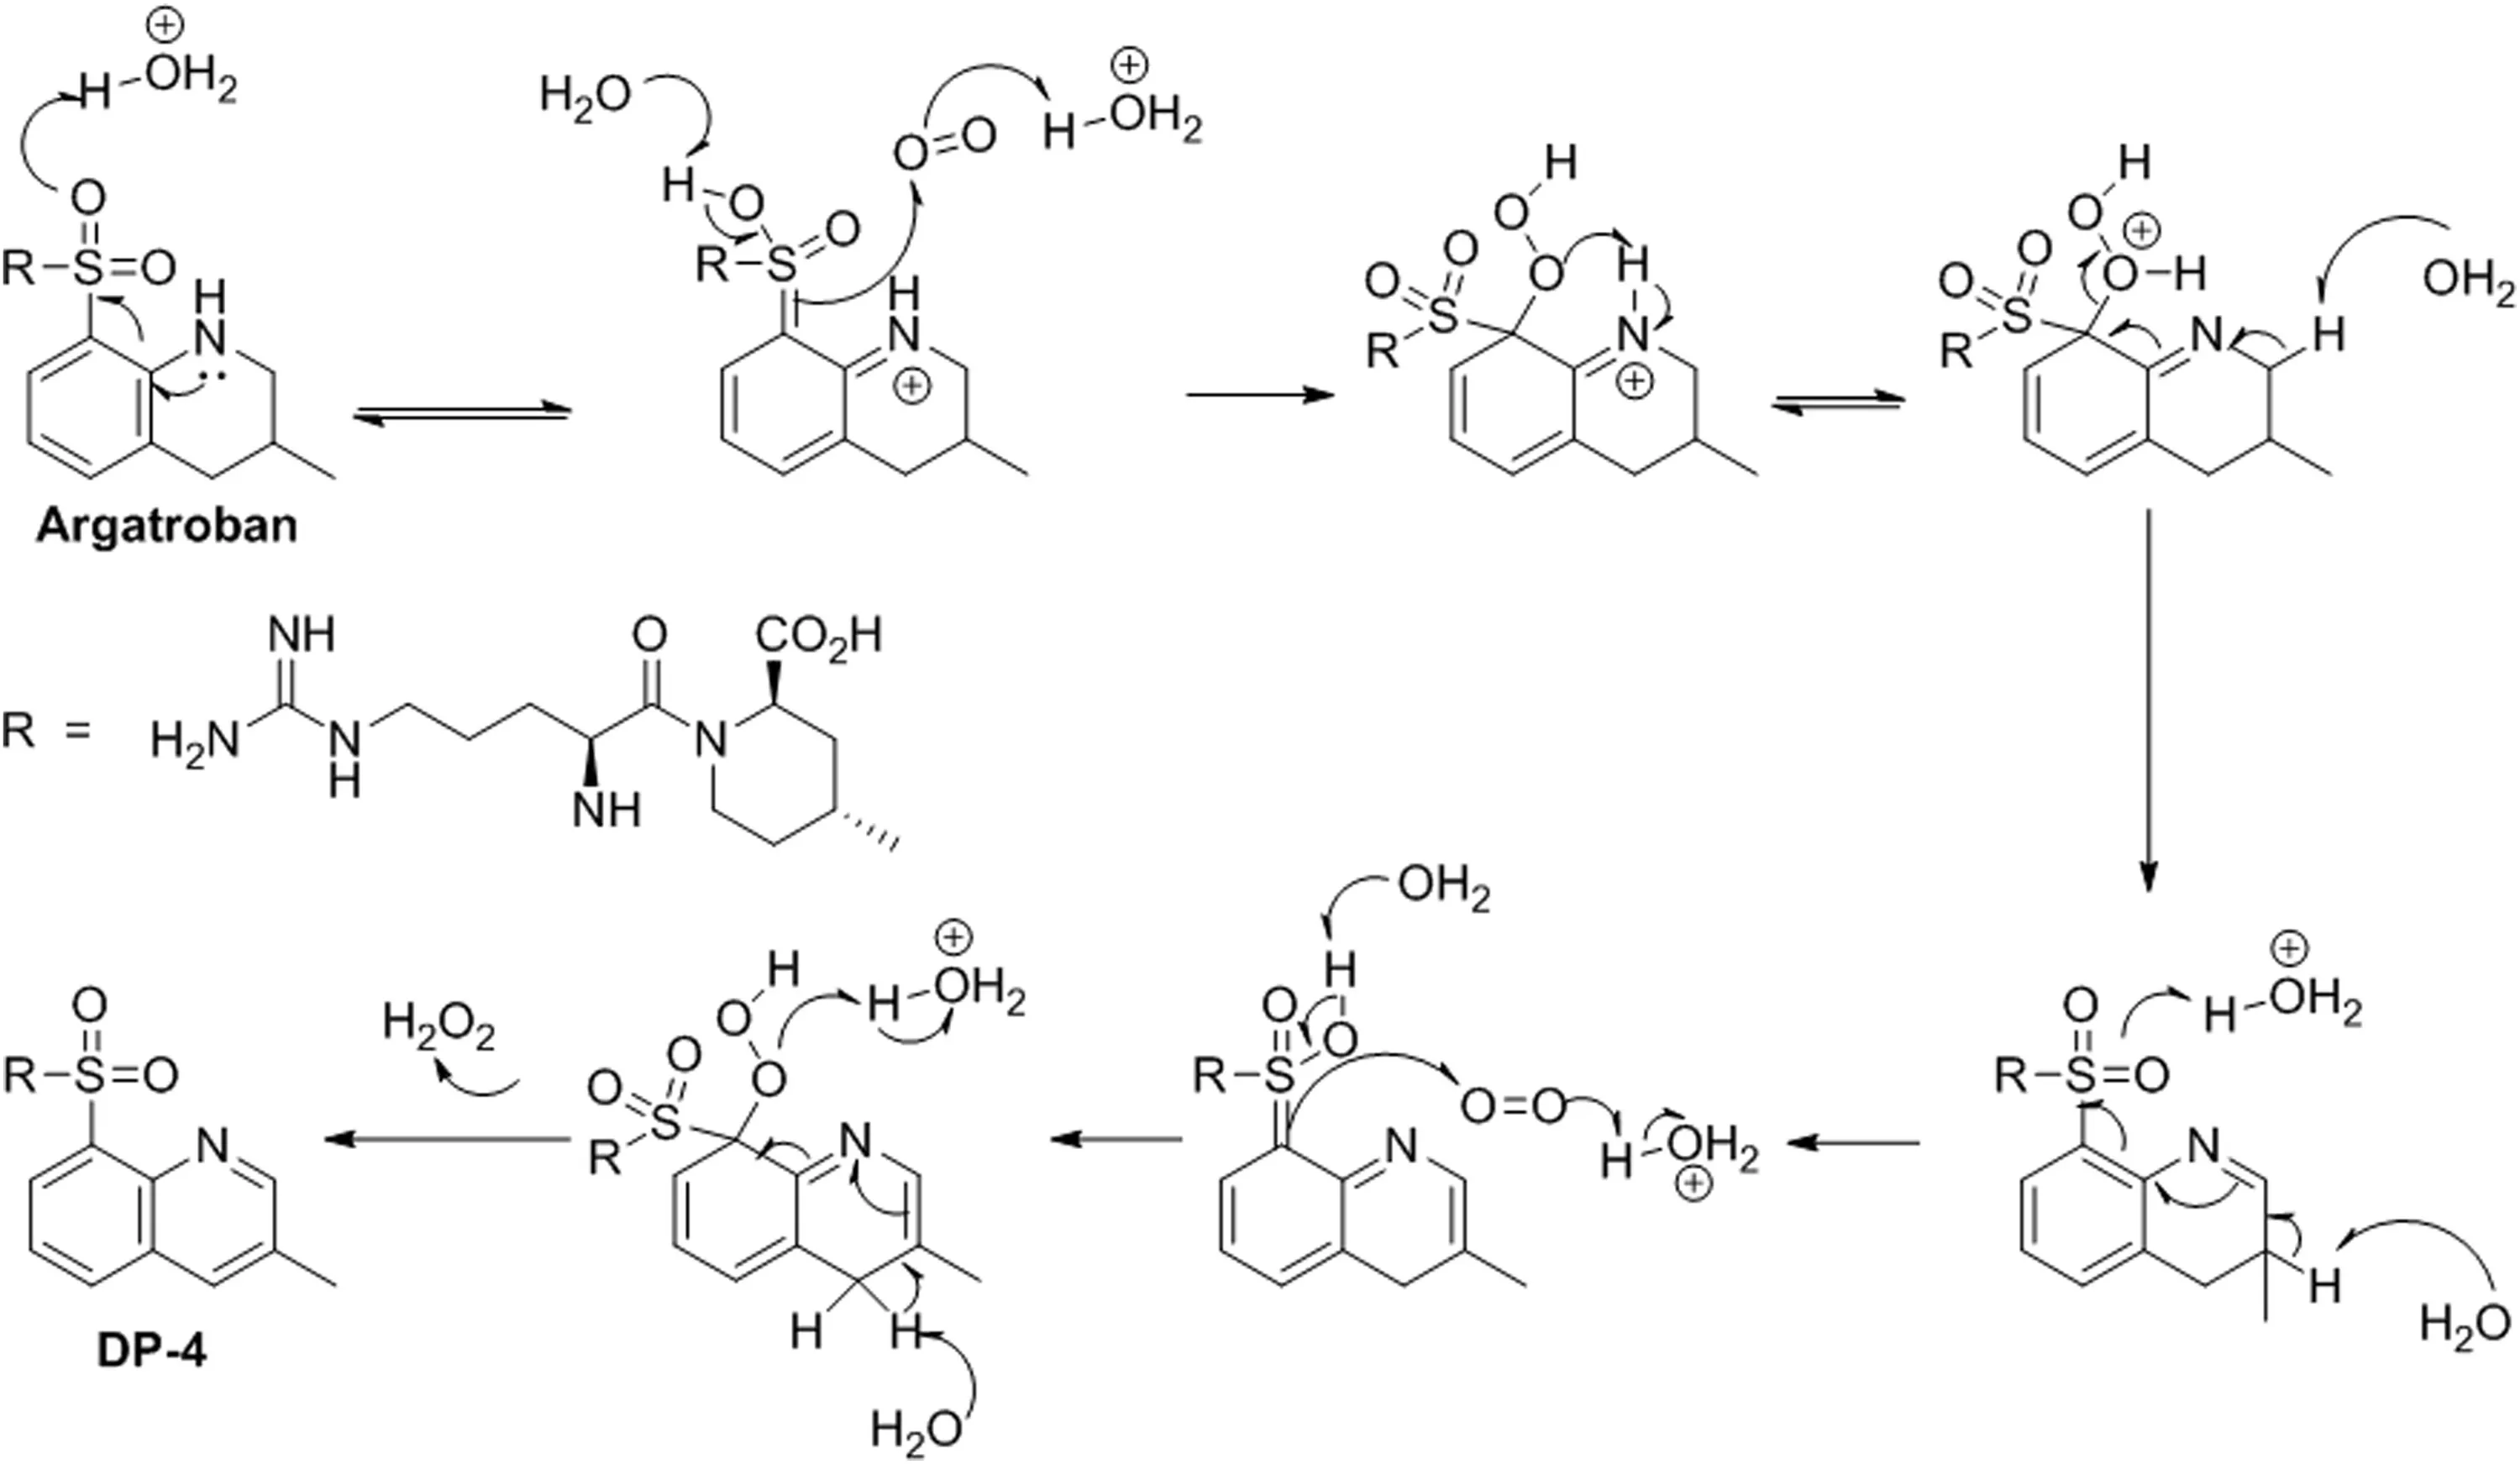
Fig.8.Proposed mechanism for the formation of DP-4.
The LC–MS/MS QTOF results of DP-6 show a mass at m/z 510.2381 for the parent ion(M1)in positive mode and it is found that it has only one mass unit more than that of the parent drug argatroban.This suggests that some hydrolysis happened under base stress and the guanidine was hydrolyzed to uridyl moiety,which confirms the mass difference.Further,MS2fragmentation of M1produced a daughter ion at m/z 493.2347 due to elimination of hydroxyl radical from carboxylic acid.The MS3fragmentation of MS2ion produced a fragmented ion at m/z 385.1540 by the elimination of 4-methyl piperdine-2-aldehyde fragment,which suggests that the degradant has a structure similar to that of argatroban except the uridine moiety.Further,MS4and MS5fragmentations showed daughter ions at m/z 385.1540 and m/z 146.0964,confirming that the compound has a tetrahydro quinoline ring.The proposed structure of the compound was further confirmed by1H NMR(Fig.S6)and13C NMR analysis.
3.4.7.Characterization of DP-7
Under peroxide stress conditions,two degradation products(DP-4 and DP-7)were observed.Among these two impurities,DP-4 is major and DP-7 is minor.The DP-4 was confirmed by the individual synthesis and the synthetic sample retention time was perfectly in agreement with the retention time of the degradant formed in the stress study.Besides,DP-7(N-oxide)formed from DP-4,which was confirmed by mass.In order to confirm the same,peroxide stress study was also performed with the synthetic DP-4 and the generated N-oxide HPLC retention time matched with that of the DP-7 formed from argatroban peroxide stress.
Hence,the structure of the N-oxide was further confirmed by1H(Fig.S7),13C NMR,HRMS and MS/MS fragmentation studies.The1H NMR spectrum of the isolated compound displayed a singlet at lower chemical shift valueδH8.24 ppm due to imine proton of quinoline ring,whereas the DP-4 shows chemical shift for imine proton around δH8.91 ppm,providing strong evidence that the compound has N-oxide on the quinoline ring.Other proton chemical shift values observed for DP-7 were almost similar to that of DP-4.Besides,NH,NH2and OH protons were confirmed by disappearance with D2O exchange.The MS2fragmentation of DP-7 produced a daughter ion at m/z 396.1342 due to heterolytic cleavage of amide,which confirms that DP-7 has an amide linkage in the back bone of the structure.Further,MS3fragmentation of ion at m/z 396.1342 produced a daughter ion at m/z 239.0485 by the heterolytic cleavage of sulfonamide,which indicates that the N-oxide formation took place on the quinoline ring.Similarly,MS4fragmentation of ion at m/z 239.0485 produced a fragmented ion at m/z 224.0609 by loss of 16 mass units due to loss of oxide,which confirms that the N-oxide formation happened on the quinoline ring.Besides,MS5fragmentation of ion at m/z 224.0609 gave a daughter ion at m/z 206.0270 by the elimination of ammonia.Based on the MS/MS fragmentation pattern,the structure of DP-7 was established and is shown in Fig.6.The chemical composition of DP-7 was further confirmed by HRMS analysis and the observed mass 521.21762 was correlated for the chemical composition of C23H33O6N6S[M+H]+and the calculated mass is 521.21776 for C23H33O6N6S[M+H]+.The chemical compositions and the HRMS data of all degradation products(DP-1 to DP-7)obtained and the MS/MS fragmentation results are shown in Table 1.
3.5.Postulated degradation pathway mechanism
The most probable mechanistic explanation for the formation of degradation products DP-1 to DP-7 from argatroban is depicted in scheme(Fig.6).The degradation product DP-4 was formed by acid hydrolysis,followed by ring aromatization in 3-methyl-1,2,3,4-tetrahydroquinoline of argatroban.Similarly,the degradation product DP-1 was expected to be formed by acid hydrolysis of amide bond in DP-4.However,DP-3 was generated by the acid hydrolysis of amide of 4-methylpiperidine-2-carboxylic acid in argatroban.Apart from these,DP-2 was formed in acid hydrolysis by the internal cyclization of DP-3 with the elimination of a water molecule.In addition,product DP-5 was formed by the elimination of formamidine from guanidyl moiety of argatroban under alkaline medium.Besides,DP-6 was formed due to base hydrolysis of imine group in the guanidyl resulting in the formation urea derivative of argatroban.Furthermore,peroxide stress conditions produced two degradation products(DP-4 and DP-7),among which DP-4 is major and DP-7 is minor.Subsequently,DP-7(N-oxide)was formed due to the oxidation of DP-4 under peroxide stress.The N-oxide formation was evidenced by HRMS and MS/MS fragmentation pattern.The degradation product(DP-4)was confirmed by the individual synthesis.The degradation pathway is depicted in Fig.7.A probable mechanism was proposed for the formation of DP-4 and is shown in Fig.8.Initial protonation of sulfone followed by imine formation and subsequent protonation and aromatization gave the corresponding quinoline ring under acidic and peroxide stress conditions.
4.Conclusion
Degradation behavior of argatroban was explored by exposing it to ICH defined stress conditions.The drug showed significant degradation under hydrolysis(acidic,alkaline)and oxidation(peroxide stress)conditions.The drug remained stable under thermal and photolytic stress conditions.In total,seven degradation products(DP-1 to DP-7)were formed under varied conditions which were found to be previously unknown.DP-1 to DP-4 were formed as common hydrolytic degradation products under acid stress conditions and DP-5 and DP-6 were formed as common hydrolytic degradation impurities under alkaline stress conditions.The two major degradation products(DP-4 and DP-7)were generated under peroxide stress conditions.The degradation products were completely characterized with the help of advanced analytical techniques LC–MS-Ion trap/QTOF and NMR,and confirmed by individual chemical synthesis.
Conflicts of interest
The authors declare that there are no conflicts of interest.
The authors are grateful to Gland Pharma Limited,Hyderabad,for providing facilities to carry out the work and thankful to Mr.S.Sathiyanarayanan,Synthesis R&D,Gland Pharma,for the fruitful discussions and also to Prof.D.B.Ramachary and Dr.Anebouselvy,School of Chemistry,University of Hyderabad,Hyderabad,for their valuable suggestions and helpful discussions in the preparation of the manuscript.
Appendix A.Supplementary material
Supplementary data associated with this article can be found in the online version at doi:10.1016/j.jpha.2017.07.001.
[1]M.DiNisio,S.Middeldorp,H.R.Buller,Direct thrombin inhibitors,N.Engl.J.Med.353(2005)1028–1040.
[2]S.Dhillon,Argatroban:a review of its use in the management of heparininduced thrombocytopenia,Am.J.Cardiovasc.Drugs 9(4)(2009)261–282.
[3]Guidance for industry Q1A(R2),Stability testing of new drug substances and products,Proceedings of the International Conference on Harmonization(ICH)Guidelines,Geneva,2003.
[4]Guidance for industry Q1B,photostability testing of new drug substances and products,Proceedings of the International Conference on Harmonization(ICH)Guidelines,Geneva,1998.
[5]Guidance for industry Q3A(R2),Impurities in new drug substances,Proceedings of the International Conference on Harmonization(ICH)Guidelines,Geneva,2006.
[6]P.Elkins,D.Coleman,J.Burgess,et al.,Characterization of the isomeric conif guration and impurities of(Z)-endoxifen by 2D NMR,high resolution LC–MS,and quantitative HPLC analysis,J.Pharm.Biomed.Anal.88(2014)174–179.
[7]A.Awasthi,M.Razzak,R.AI-Kassas,et al.,Isolation and characterization of degradation products of moxidectin using LC,LTQ FT–MS,H/D exchange and NMR,Anal.Bioanal.Chem.8(2012)2203–2222.
[8]R.Rapolu,Ch.K.Raju,K.Srinivas,et al.,Isolation and characterization of a novel acid degradation impurity of amlodipine besylate using Q-TOF,NMR,IR and single crystal X-ray,J.Pharm.Biomed.Anal.99(2014)59–66.
[9]R.Rapolu,A.K.Pandey,Ch.K.Raju,et al.,A novel UV degradation product of ebastine:isolation and characterization using Q-TOF,NMR,IR and computational chemistry,J.Pharm.Biomed.Anal.107(2015)488–494.
[10]P.H.Secretan,M.Karoui1,M.Bernard,et al.,Photodegradation of aqueous argatroban investigated by LC/MSn:photoproducts,transformation processes and potential implications,J.Pharm.Biomed.Anal.131(2016)223–232.
杂志排行
Journal of Pharmaceutical Analysis的其它文章
- Advancements in the preparation of high-performance liquid chromatographic organic polymer monoliths for the separation of small-molecule drugs
- Physicochemical characterization,the Hirshfeld surface,and biological evaluation of two meloxicam compounding pharmacy samples
- Structural confirmation of sulconazole sulfoxide as the primary degradation product of sulconazole nitrate
- Anti-diabetic activity of quercetin extracted from Phyllanthus emblica L.fruit:In silico and in vivo approaches
- Quantitative determination of erlotinib in human serum using competitive enzyme-linked immunosorbent assay
- Ultrasensitive electrochemical determination of metronidazole based on polydopamine/carboxylic multi-walled carbon nanotubes nanocomposites modified GCE
