Electrooxidation of sulfanilamide and its voltammetric determination in pharmaceutical formulation,human urine and serum on glassy carbon electrode
2018-03-06BrunoFerrazTiagoGuimaresDemetriusProfetiLucieneProfeti
Bruno R.L.Ferraz,Tiago Guimarães,Demetrius Profeti,Luciene P.R.Profeti
aDepartamento de Biologia,Universidade Federal do Espírito Santo,Alegre 29.500-000,ES,Brazil
bDepartamento de Química e Física,Universidade Federal do Espírito Santo,Alegre 29.500-000,ES,Brazil
1.Introduction
Sulfonamides were the first drugs with a selective effect on bacteria,and could be systemically used against bacterial infections[1].They are commonly applied for human and veterinary use due to their ability to inhibit gram-positive and gram-negative bacteria,as well as protozoa[2].In humans,common infections treated by sulfanilamide(SFD)drug include urinary tract infections,vaginal infections,strep throat and some staph infections[3].Recently,SFD residues in the aquatic environment have become one of the most concerning issues in public health.They exhibit potential toxicity to human beings and aquatic organisms,and are responsible for the emergence of antibiotic resistant bacteria[4].Although relevant,few methods have been developed for quantification of SFD in pharmaceuticals and other matrices,including chromatographic methods[5-8]and fluorescence[9].These methods are usually expensive,time consuming,require sample pre-treatments in some cases,and involve great labor[10].However,the electrochemical methods present good advantages for drugs detection,such as high sensitivity,accuracy and precision,simplicity,low cost,and less tedious work during sample preparation procedures[11].Tadi et al.[10]described a method for SFD determination using a pencil graphite electrode chemically modified modified with molecular imprinting technology.This sensor,under optimized conditions,has very low detection limit of 0.02 nmol/L and two linear ranges from 0.05 to 1100 nmol/L and 1.1 to 48μmol/L with sensitivity values of 1.168 and 0.012 μA/μmol/L,respectively.The sensor was applied successfully in analysis of SFD in spiked human serum and ground water samples.Wei et al.[12]developed a novel sensor based on glassy carbon electrode(GCE)modified with molecularly imprinted polymer and grapheme oxide for SFD determination.The sensor was characterized using scanning electron microscopy,cyclic voltammetry(CV),and electrochemical impedance spectroscopy and square-wave voltammetry(SWV).Under optimized conditions,the intensity of the oxidation peak current of SFD showed two linear dynamic ranges from 10 to 1000 ng/mL.Although these studies showed good results,the use of bare GCE has some advantages,such as dispensing tedious steps modification,low cost,and ease of use[13–21].In this sense,to the best of our knowledge,this is the first time that an electrochemical sensor based on bare GCE was applied to the quantification of SFD in pharmaceuticals and fluid biologics.
2.Experimental
2.1.Chemicals
The entire chemicals were of analytical grade and were used without further purification.A stock solution of 10.0 mmol/L SFD was prepared in a medium of Britton-Robinson Buffer Solution(BRBS,0.1 mol/L),which was prepared by mixing equimolar amounts of phosphoric acid(85.0%),acetic acid(99.8%),and boric acid(99.5%)and then its pH was adjusted with 1.0 mol/L sodium hydroxide solution.
2.2.Apparatus
The voltammetric measurements were carried out on an Autolab PGSTAT 128N(Metrohm Autolab B.V.,Utrecht,and The Netherlands)potentiostat/galvanostat controlled by NOVA 1.10.4 electrochemical software.The three-electrode electrochemical cell was set with GCE(A=0.07 cm2)as a working electrode,an Ag/AgCl 3.0 mol/L KCl electrode as a reference electrode,and a platinum wire as a counter electrode.The pH measurements were done with a calibrated pH meter with standard buffers at room temperature.
2.3.Electrode preparation procedure
The GCE was polished using alumina(0.05μm)to obtain a mirror effect and then rinsed with plenty of water.The electrode was then conditioned in 0.1 mol/L sulphuric acid by 10 successive CV scans(from 0.0 to+1.4 V)at a scan rate of 0.5 V/s.In the CV,SWV,and chronoamperometry(CA)experiments,the electrode was always polished between measurements.
2.4.Voltammetric and chronoamperometric measurements
The electrochemical behavior of SFD on GCE was first investigated by the CV method.A volume of 10.0 mL of 0.1 mol/L BRBS(pH=2.0)containing 1.0 mmol/L of SFD was placed in the glass electrochemical cell and the electrochemical behavior of SFD on GCE was investigated by the CV at scan rate of 50 mV/s over the potential range from+0.5 to+1.4 V.Also,the scan rate was varied from 10 to 250 mV/s in a potential range of+0.5 to+1.4 V.In order to study the effect of pH on the electrochemical behavior of SFD at GCE,cyclic voltammograms were recorded for 1.0 mmol/L SFD in 0.1 mol/L BRBS with pH varying from 2.0 to 9.0 at 50 mV/s.
The analytical method was developed by SWV and CA.In SWV,the potential pulse amplitude(a),step potential(ΔEs)and frequency(f)were considered as parameters to assess the optimum experimental performance for quantification of SFD using the GCE.An aliquot of 10.0 mL of 0.1 mol/L BRBS(pH=2.0)containing 0.1 mmol/L SFD was placed in the glass electrochemical cell and potential pulse amplitude was varied from 10 to 100 mV withf=50 s-1andΔEs=1 mV.TheΔEs was varied from 1 to 10 mV witha=50 mV,f=50 s-1,the frequency was varied from 10 to 80 s-1witha=50 mV,ΔEs=4 mV.
In CA method,the time(t)used was 0–100 s,applying a fixed potential at+1.06 V vs.Ag/AgCl in various SFD concentrations for the same buffer concentration and pH used in SWV method.
The best experimental condition for SFD analysis with SWV method using the GCE was obtained in 0.1 mol/L BRBS(pH 2.0)ata=50 mV,ΔEs=4 mV,andf=70 s-1.The linearity of the method was evaluated by preparing ten SFD solutions with concentrations varying from 5.0 to 74.7μmol/L on three different days.The results were plotted as a calibration curve and the linear correlation coefficient was determined by linear fitting.
The limits of detection(LOD)and limits of quantification(LOQ)were determined using the ratio of 3σ/band 10σ/b,respectively,wherebis the slope of the calibration curve and σ is the standard deviation value from ten voltammograms of the blank previously determined,according to the IUPAC recommendations[22].The intra-day precision was evaluated by six measurements of 60.0μmol/L SFD on the same day and the mean of peak currents was compared with value on calibration plot.The inter-day precision was evaluated by measurements of 50.0μmol/L SFD on different days(six days)and the mean of peak currents was compared with value on calibration plot.The interference study was evaluated by comparing the current of SFD signal in absence and presence of interfering substances on the ratio of 1:100.
After optimizing the experimental parameters,square-wave voltammograms of SFD were recorded to quantify the antibiotic in otologic solution,human urine and serum by standard addition method.
2.5.Preparation of samples for quantification of SFD by SWV
2.5.1.Otologic solution
The developed voltammetric method was tested for determination of SFD in pharmaceutical formulations.Otologic solution of SFD was purchased from a local drugstore.According to the manufacturer's information,each of 10 mL volumetric flasks contained 0.1 g of SFD.In order to determine the amount of SFD,100 μL of pharmaceutical sample solution was transferred to the flask,and the final volume was completed with 0.1 mol/L BRBS,pH=2.0(this solution was named solution A).A volume equal to 50 μL of solution A was diluted in a 10 mL volumetric flask and the final volume was completed with 0.1 mol/L BRBS,pH=2.0(this solution was named test solution).The test solution was placed in an electrochemical cell and SFD concentration was determined by the standard addition method.
2.5.2.Human serum spiked
Three drug-free human blood samples(10 mL)obtained from healthy volunteers were allowed to rest for 20 min to complete blood clotting and then centrifuged(1500gfor 15 min at 20°C)to separate the serum from the solid portion.An aliquot of 50 μL of serum and 100 μL of 1.0 mmol/L SFD standard solution were transferred to a 10 mL volumetric flask,and the final volume was completed with 0.1 mol/L BRBS,pH=2.0.This final solution was placed in an electrochemical cell and SFD concentration was determined by the standard addition method.
2.5.3.Human urine spiked
Three samples of human urine(10 mL)were collected from volunteers and stored at temperature of approximately 4°C.An aliquot of 200 μL of 1.0 mmol/L SFD standard solution was added to the urine samples(3.0 mL)and the final concentration obtained was 300 μmol/L.This spiked urine sample was diluted ten times in the electrochemical cell with 0.1 mol/L BRBS(pH=2.0).The concentration of SFD was determined by standard addition method.
3.Results and discussion
3.1.Electrochemical behavior of SFD at GCE
Iinitially,the electrochemical behavior of SFD in 0.1 mol/L BRBS(pH=2.0)was investigated by CV at 50 mV/s over the potential range of+0.5 V to+1.40 V.As shown in Fig.1,an oxidation peak was observed at+1.06 V in direct scan and no peak was observed in reverse scan,indicating that the SFD oxidation is irreversible.
3.2.Effect of pH on electrochemical behavior of SFDop
The effect of pH of 1.0 mmol/L SFD solution was studied by CV over the potential of+0.5 to+1.4 V at 50 mV/s in the pH range of 2.0–9.0.It was observed that an increase in pH up to 5.0 decreased significantly the current response.For higher pH values,however,the anodic peak current increased(Fig.2).It is also observed an increase of width of the peak at half-height with increase in pH values.Thus,the pH of 2.0 was chosen for further analysis of SFD because this value showed higher peak current and smaller width of the peak at half height.The anodic peak potential(EP)also exhibited a dependence on the pH of solution(Fig.2,insert).
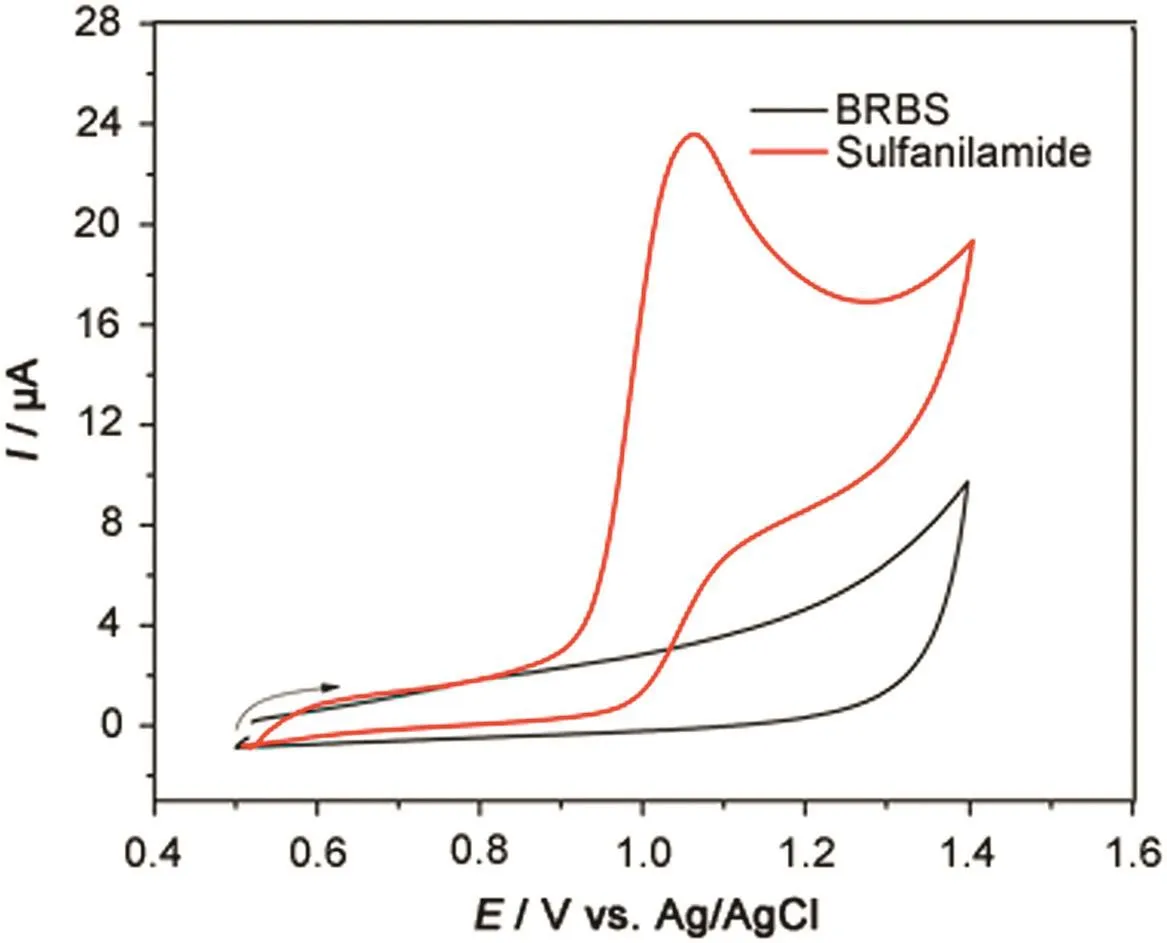
Fig.1.Cyclic voltammograms of 0.1 mol/L Britton-Robinson Buffer Solution(BRBS,pH=2.0)in absence(black line)and presence(red line)of 1.0 mmol/L SFD.ν=50 mV/s.
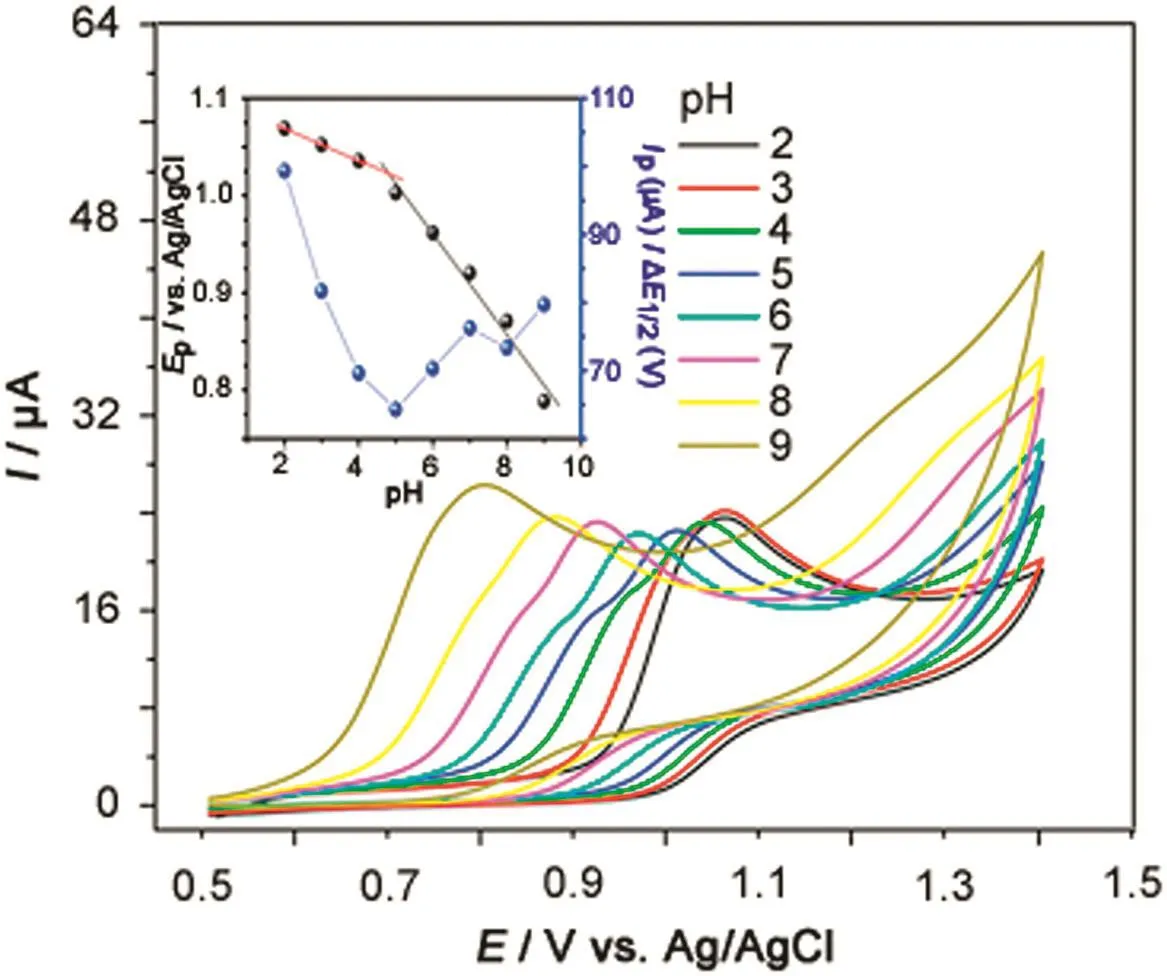
Fig.2.Cyclic voltammograms of 1.0 mmol/L SFD in 0.1 mol/L BRBS at pH values from 2.0 to 9.0,obtained with the glassy carbon electrode.ν=50 mV/s.Insert:EP vs.pH and IPvs.pH plot.
The oxidation peak potentials shifted negatively with increased pH values(Fig.2),and the regression equations can be expressed as EP(V)=-0.052 pH+1.32(R=0.997),indicating that protons are directly involved in the oxidation.Although the Nernst equation is mostly applied to reversible systems,such values may also be used to predict the proton/electron transfer ratios in either SFD irreversible redox processes.The slope obtained for the SFD oxidation process(0.052 V/pH)is close to the number expected from the Nernst equation(0.0592)when the number of protons and electrons involved in the oxidation electrochemical reaction are equal.The number of protons and electrons was obtained using the formulaEPa–EPa/2=47.7 mV/α×n[23],whereEPa,EPa/2,α andnare potential peak,potential peak at half-height,electronic transfer coefficient,and number of electrons,respectively.The obtained values ofEPafrom voltammograms in Fig.1 are equal to 1.06 V,EPa/2equal to 0.96 V,αequal to 0.5(for most irreversible system α can usually be approximated to 0.5),the number of electrons transferred(n)in the oxidation of SFD was 1.0.Thus,one proton and one electron were involved in oxidation reaction.The structure of SFD is very similar top-aminobenzoic acid[24]andpamino benzene sulfonic acid[25].According to these results the oxidation process at+1.06 V is due to formation of free radicals in the amino group(electrochemical step)and immediately,two free radicals rapidly combined together,forming a molecule of hydrazobenzene sulfonamide(chemical step).Thus,the probable oxidation reaction may be in amino group,as shown in Fig.3.
3.3.Effect of scan rates on CV
The effect of the potential scan rate on the GCE electrochemical response was also investigated (Fig.4A).The plot of theIPvs.square root of the potential scan rate(ν1/2)for 1.0 mmol/L SFD solution in 0.1 mol/L BRBS (pH 2.0)resulted in a straight line(Fig.4B),which relationship is given byIP(μA)=0.34+2.20ν1/2(R=0.999),suggesting that the electrochemical process is controlled by diffusion.Moreover,a linear correlation was obtained in the logIPvs.logνcurve(Fig.4C)which relationship is given by log(IP/μA)=-5.60+0.49 log(ν/mV/s)(R=0.999).This slope(0.49)is very close to the theoretical values reported in literature for diffusion-controlled processes[23,26].
3.4.Analytical determination of SFD by SWV and CA
In order to obtain an analytical curve for the determination of SFD by SWV,square-wave voltammograms of SFD oxidation were obtained for different concentrations of SFD(Fig.5)in 0.1 mol/L BRBS(pH 2.0)after optimization of the experimental parameters(a=50 mV,ΔEs=4 mV andf=70 s-1)
The CGE showed a linear response range from 5.0 to 74.7μmol/L(Fig.5,insert)as expressed by equationIP(μA)=-0.171+0.067CSFD(μmol/L)(R=0.999).
A detection limit of 0.92μmol/L and a quantification limit of 3.10 μmol/L were determined using the ratio of 3σ/band 10σ/b,respectively.
In order to obtain an analytical curve for the determination of SFD by CA,chronoamperograms were obtained by varying SFD concentration from 49.7 to 476.3μmol/L.The chronoamperograms in different SFD concentrations andIPvs.CSFDplot are showed in is shown in Fig.6.
The CGE showed a linear response range from 49.7 to 476.3 μmol/L(Fig.6,insert)as expressed by equationQ(μC)=+1.74 ×10⁻⁵+0.604CSFD(μmol/L)(R=0.995).
3.5.Inter-day and intra-day precision
The intra-day precision ofthe proposed method was determined by successive measurements of peak current(n= 6)in 60.0μmol/LSFD solution in 0.1 mol/LBRBS(pH 2.0).When these repeated peak current values were compared with the initial values,relative standard deviation was of 3.51%,indicating a good intra-day precision of the proposed voltammetric method.The inter-day precision was evaluated by measuring the peak current of the 50.0μmol/L SFD solution over a period of six days.A good RSD value(5.01%)was also obtained.Hence,it is possible to conclude that the SWV-GCE approach for SFD determination provides results with adequate precision.
3.6.Interference study
The selectivity of the proposed method for SFD determination was tested by the assessment of the effect of possible interfering compounds that commonly occurring in pharmaceutical formulation human serum and urine(magnesium stearate,micro-crystalline cellulose,glycine,uric acid,ascorbic acid,and citric acid).Solutions of these compounds were freshly prepared at an SFD solution/interferent compound concentration ratio of 1:100 under the same conditions used for 20μmol/L SFD in 0.1 mol/L BRBS at pH 2.0.
The analytical response was monitored and compared with the signal obtained from the pure SFD solution(Table 1).The results revealed that the proposed method is selective for SFD if the interferents did not affect the anodic current of the antibiotic under the tested concentration.

Fig.3.Reaction of SFD oxidation at glassy carbon electrode in 0.1 mol/L BRBS(pH=2.0).

Fig.4.(A)Cyclic voltammograms of 0.1 mmol/L SFD in 0.1 mol/L BRBS,pH=2.0,obtained on GCE at different scan rates:10(a),20(b),30(c),40(d),50(e),60(f),70(g),80(h),90(i),100(j),110(k),120(l),130(m),150(n),160(o),170(p),190(q),200(r),210(s),220(t),230(u),240(v),and 250(w)mV/s.(B)IPvs.ν1/2plot.(C)log(IP)vs.log(ν)plot.
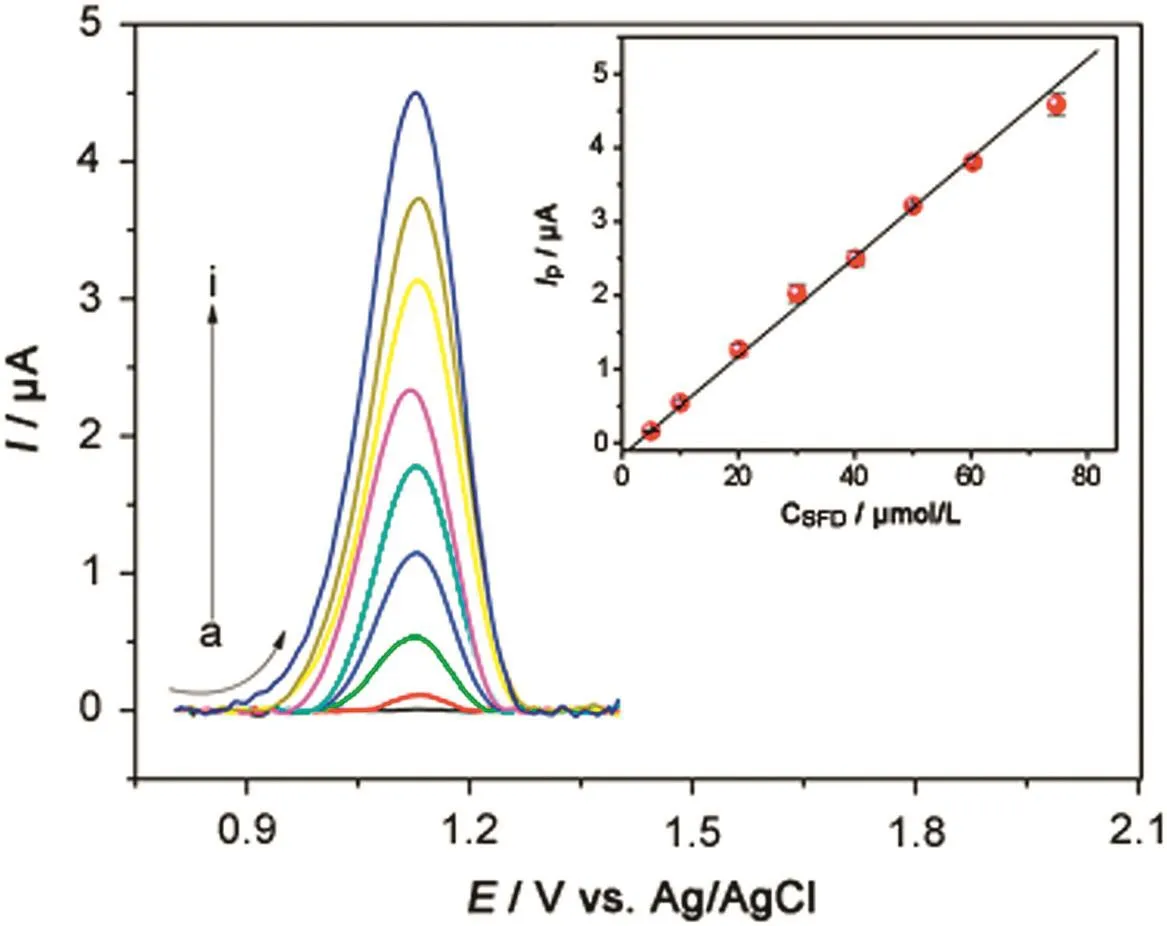
Fig. 5.Square-wave voltammograms of SFD electrooxidation obtained with a glassy carbon electrode under optimized conditions.SFD concentrations:(a)0.0,(b)5.0,(c)10.0,(d)20.1,(e)30.1,(f)40.2,(g)50.0,(h)60.3,and(i)74.7 μmol/L.Parameters:ΔEs=4.0 mV,f=70 s-1and a=50 mV.Insert:calibration plot.

Table 1Effect of some possible interfering compounds on the determination of SFD.CInterferingcompoundadded=2.0 mmol/L;CSFD=20.0 μmol/L.
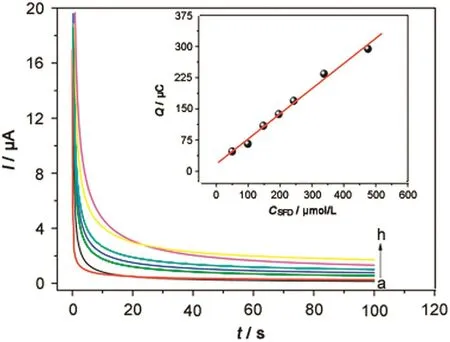
Fig.6.Chronoamperometric measurements of SFD electrooxidation obtained with a glassy carbon electrode in different SFD concentrations:(a)0.0,(b)49.7,(c)99.0,(d)147.7,(e)196.0,(f)243.1,(g)338.0,and(h)476.3 μmol/L.Insert:Calibration plot.
3.7.Determination of SFD and recovery tests
The accuracy of the SWV-GCE method and the possibility of matrix interferences were further checked by performing analytical recovery experiments.The treatment with SFD in usual dosage may result in maximal concentrations in human serum of this drug of 4.4–15 mg/100 mL(584.0–871.0 μmol/L)and the excretion of SFD in free form results in maximal concentrations of235.5–508.2 mg/100 mL (13,600–29,528 μmol/L).In this sense,the human serum and urine samples were fortified with SFD by adding precise amounts of the drugs to those biological fluids[27].
Precise amounts of SFD were added into otologic solution,human urine and serum samples,and the recovery percentage values were calculated from the actual and added SFD concentrations(Table 2).It can be clearly observed that there was no influence of the matrix on the response obtained by SWV-GCE.
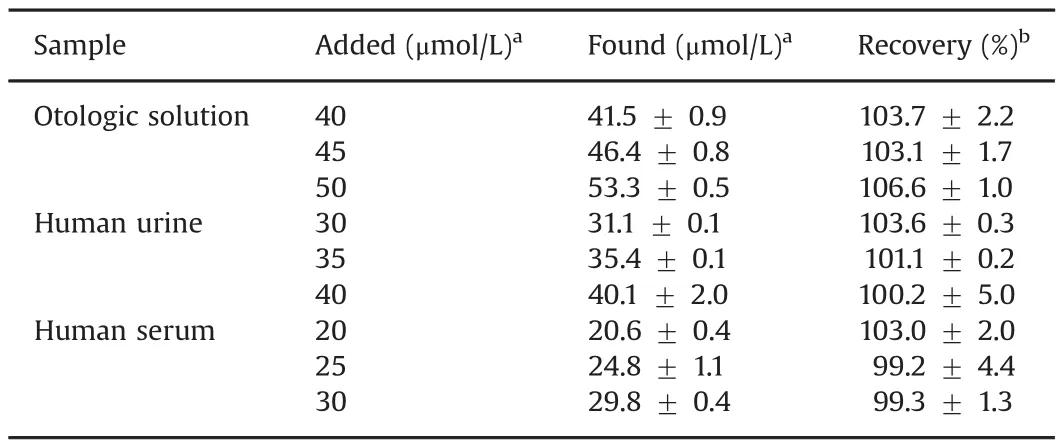
Table 2Results of SFD determination in otologic solution,human urine and human serum samples.
4.Conclusions
This work demonstrated that the SWV-GCE method can be used to quantify SFD in otologic solution,human urine and serum,showing better detection limit and linear range than the chron-oamperometric method.Under optimized conditions,the anodic peak current was linear for SFD concentrations from 5.0 to 74.7 μmol/L with a detection limit of 0.92 μmol/L.Satisfactory recovery results were obtained in the determination of SFD in otologic solution,human urine and serum,indicating that the GCE was also successfully applied in these kinds of samples.The SWV involving GCE is a simple,rapid,sensitive,precise,accurate and environmentally-friendly approach that does not need sophisticated instruments or any separation step,allowing the analysis of SFD without laborious and time-consuming procedures.
Conflicts of interest
The authors declare that there are no Conflicts of interest.
The authors thank UFES;CNPq,CAPES(23068719374/2017-70),and FAPES(54693900/2011,54694442/2011,60125730/2012,53671880/2011)for the financial support,and Andréia Zacchi Bazzarella for the English language revision.
[1]O.Sköld,Sulfonamide resistance:mechanisms and trends,Drug Resist.Updat.3(2000)155–160.
[2]X.Liao,B.Li,R.Zou,et al.,Antibiotic sulfanilamide biodegradation by acclimated microbial populations,Appl.Microbiol.Biotechnol.100(2016)2439–2447.
[3]P.Wang,T.Zhou,R.Wang,et al.,Carbon-sensitized and nitrogen-doped TiO2for photocatalytic degradation of sulfanilamide under visible-light irradiation,Water Res.45(2011)5015–5026.
[4]M.Munir,K.Wong,I.Xagoraraki,Release of antibiotic resistant bacteria and genes in the effluent and biosolids of five wastewater utilities in Michigan,Water Res.45(2011)681–693.
[5]H.Shaaban,T.Górecki,High-efficiency liquid chromatography using Sub-2μm columns at elevated temperature for the analysis of sulfonamides in wastewater,Chromatographia 74(2011)9–17.
[6]L.J.Zhou,G.G.Ying,S.Liu,et al.,Simultaneous determination of human and veterinary antibiotics in various environmental matrices by rapid resolution liquid chromatography–electrospray ionization tandem mass spectrometry,J.Chromatogr.A 1244(2012)123–138.
[7]D.Agbaba,A.Radovic,S.Vladimirov,et al.,Simultaneous TLC determination of co-trimoxazole and impurities of sulfanilamide and sulfanilic acid in pharmaceuticals,J.Chromatogr.Sci.34(1996)460–464.
[8]K.E.Maudens,G.F.Zhang,W.E.Lambert,Quantitative analysis of twelve sulfonamides in honey after acidic hydrolysis by high-performance liquid chromatography with post-column derivatization and fluorescence detection,J.Chromatogr.A 1047(2004)85–92.
[9]M.M.García,N.M.Diez,D.B.Gil,et al.,Determination of sulphathiazole and sulphanilamide by photochemically induced fluorescence and first-derivative fluorescence,J.Pharm.Biomed.Anal.38(2005)349–354.
[10]K.K.Tadi,R.V.Motghare,V.Ganesh,Electrochemical detection of sulfanilamide using pencil graphite electrode based on molecular imprinting technology,Electroanalysis 26(2014)2328–2336.
[11]B.R.L.Ferraz,F.R.F.Leite,A.R.Malagutti,Simultaneous determination of ethionamide and pyrazinamide using poly(L-cysteine) film-modified glassy carbon electrode,Talanta 154(2016)197–207.
[12]X.Wei,X.Xu,W.Qi,et al.,Molecularly imprinted polymer/graphene oxide modified glassy carbon electrode for selective detection of sulfanilamide,Prog.Nat.Sci.27(2017)374–379.
[13]B.R.Kozub,N.V.Rees,R.G.Compton,Electrochemical determination of nitrite at a bare glassy carbon electrode;why chemically modify electrodes?Sens.Actuators B-Chem.143(2010)539–546.
[14]M.M.Ghoneim,A.Radi,A.M.Beltagi,Determination of Nor floxacin by square wave adsorptive voltammetry on a glassy carbon electrode,J.Pharm.Biomed.Anal.25(2001)205–210.
[15]G.Ilangovan,K.Chandrasekara Pillai,Mechanism of activation of glassy carbon electrodes by cathodic pretreatment,J.Solid State Electrochem.3(1999)357–360.
[16]J.Yu,H.Jin,R.Gui,et al.,A facile strategy for ratiometric electrochemical sensing of quercetin in electrolyte solution directly using bare glassy carbon electrode,J.Electroanal.Chem.795(2017)97–102.
[17]R.C.Tenent,D.O.Wipf,Local electron transfer rate measurements on modified and unmodified glassy carbon electrodes,J.Solid State Electrochem.13(2009)583–590.
[18]S.Majdi,A.Jabbari,H.Heli,et al.,Electrochemical oxidation and determination of ceftriaxone on a glassy carbon and carbon-nanotube-modified glassy carbon electrodes,J.Solid State Electrochem.13(2009)407–416.
[19]R.H.O.Montes,R.M.Dornellas,L.A.J.Silva,et al.,Amperometric determination of the insecticide fipronil using batch injection analysis:comparison between unmodified and carbon-nanotube-modified electrodes,J.Solid State Electrochem.9(2016)2453–2459.
[20]X.Hu,W.Zheng,R.Zhang,Determination of p-chloronitrobenzene by voltammetry with an electrochemically pretreated glassy carbon electrode,J.Solid State Electrochem.20(2016)3323–3330.
[21]H.Zhang,S.Li,F.Zhang,et al.,Simultaneous detection of hydroquinone and catechol on electrochemical-activated glassy carbon electrode by simple anodic and cathodic polarization,J.Solid State Electrochem.21(2017)735–745.
[22]Analytical Methods Committee,Recommendations for the definition,estimation and use of the detection limit,Analyst 112(1987)199–204.
[23]A.J.Bard,L.R.Faulkner,Electrochemical Methods:Fundamentals and Applications,Wiley,New York,2001.
[24]R.M.Kotkar,A.K.Srivastava,Voltammetric determination of para-aminobenzoic acid using carbon paste electrode modified with macrocyclic compounds,Sens.Actuators B-Chem.119(2006)524–530.
[25]C.Yao,H.Sun,H.F.Fu,et al.,Sensitive simultaneous determination of nitrophenol isomers at poly(p-aminobenzene sulfonic acid) film modified graphite electrode,Electrochim.Acta 156(2015)163–170.
[26]D.K.Gosser,Cyclic Voltammetry:Simulation and Analysis of Reaction Mechanisms,VCH Publishers,New York,1994.
[27]J.D.Stewart,G.M.Rourke,J.G.Allen,Excretion of sulfanilamide,J.Am.Med.Assoc.110(1938)1885–1887.
杂志排行
Journal of Pharmaceutical Analysis的其它文章
- S-Nitroso-N-acetyl-L-cysteine ethyl ester(SNACET)and N-acetyl-L-cysteine ethyl ester(NACET)–Cysteine-based drug candidates with unique pharmacological profiles for oral use as NO,H2S and GSH suppliers and as antioxidants:Results and overview
- Tissue-based metabolite profiling and qualitative comparison of two species of Achyranthes roots by use of UHPLC-QTOF MS and laser micro-dissection
- A liquid chromatography with tandem mass spectrometry method for quantitating total and unbound ceritinib in patient plasma and brain tumor
- Denaturation studies on bovine serum albumin–bile salt system:Bile salt stabilizes bovine serum albumin through hydrophobicity
- Insight into the interaction of inhaled corticosteroids with human serum albumin:A spectroscopic-based study
- Effect of nonionic surfactants in release media on accelerated in-vitro release profile of sirolimus eluting stents with biodegradable polymeric coating
