A liquid chromatography with tandem mass spectrometry method for quantitating total and unbound ceritinib in patient plasma and brain tumor
2018-03-06XunBoJinmeiWuNderSniJingLi
Xun Bo,Jinmei Wu,Nder Sni,Jing Li,✽
aKarmanos Cancer Institute,Wayne State University,Detroit,MI 48201,USA
bBarrow Neurological Institute,St.Joseph's Hospital&Medical Center,Phoenix,AZ 85013,USA
1.Introduction
Anaplastic lymphoma kinase(ALK)is a receptor tyrosine kinase that can be aberrantly activated by genetic mutation,gene amplification,or chromosomal rearrangement,leading to the expression of a potent oncogenic driver[1].Genetic alterations in theALKare implicated in the pathogenesis of at least 20 types of human cancers including non-small-cell lung cancer(NSCLC),renal cell carcinomas,anaplastic thyroid cancer,breast cancer,head and neck cancer,and glioblastoma[1–6].Tumors with aberrant ALK activation often depend on ALK for growth and survival and can show marked sensitivity to ALK inhibitors.
Ceritinib(LDK378,Zykadia®)is an oral,highly potent and selective second-generation ALK inhibitor.It shows a greater preclinical antitumor potency than first-generation ALK inhibitor crizotinib,and has shown efficacy in patients with ALK-positive NSCLC who have acquired resistance to crizotinib[7].Ceritinib inhibits autophosphorylation of ALK and its downstream signaling proteins in a dose-dependent manner.It has been approved by the United States Food and Drug Administration(FDA)for the treatment of patients with ALK-positive locally advanced or metastatic NSCLC who have progressed on or are intolerant to crizotinib[7].
Given the aberrant activation of ALK in many human cancers,ceritinib is under active preclinical and clinical investigations for the treatment of various ALK-positive cancers including primary brain cancer(in particular glioblastoma)and brain metastasis.Penetration of a chemotherapeutic drug across human blood-brain tumor barrier(BBTB)is the prerequisite for effective treatment of brain cancer.To prospectively assess the penetration of ceritinib across the BBTB,a phase 0 clinical trial is being conducted in patients with glioblastoma or brain metastasis(ClinicalTrials.gov identifier:NCT02605746).Patients are treated with daily oral ceritinib(750 mg)for 14 days prior to surgical resection of their tumors.The extent of drug penetration into brain tumor is assessed by the pharmacologically relevant,unbound drug brain tumor-to-plasma partition coefficient(Kp,uu),which is estimated as the ratio of unbound drug brain tumor concentration to unbound plasma concentration at the steady state[8].
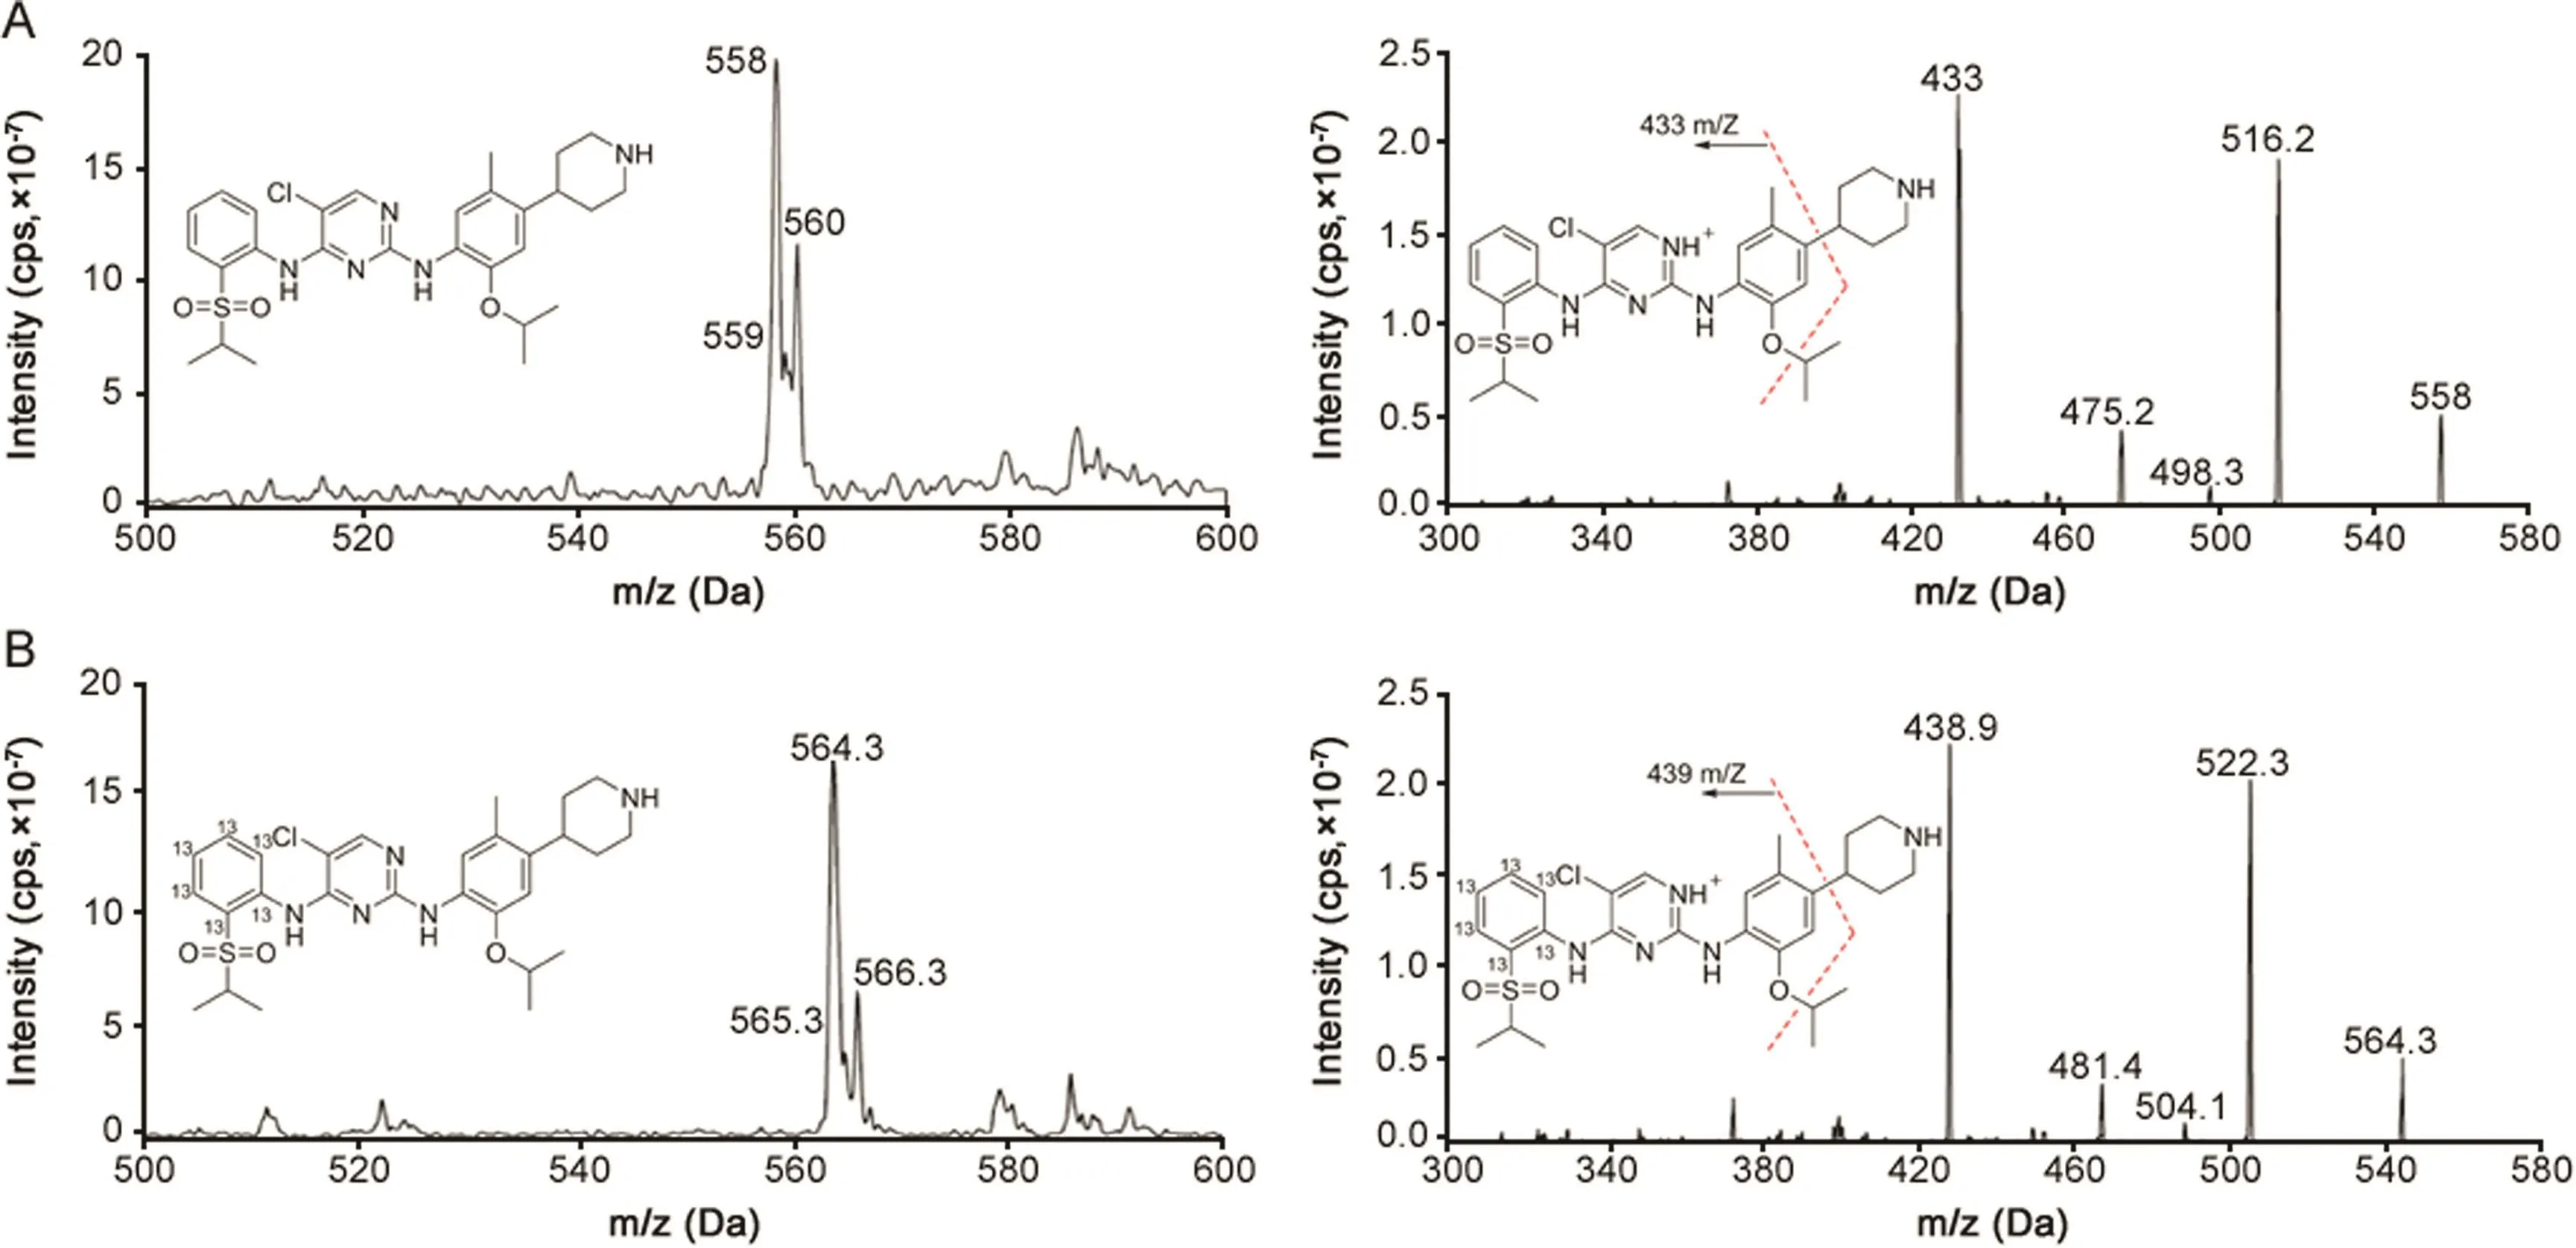
Fig.1.The parent ion scan(left)and product ion scan mass spectra(right)of(A)ceritinib for which mass transition of m/z 558.0→433.0 was selected for monitoring,and(B)[13C6]ceritinib for which mass transition of m/z 564.3→438.9 was selected for monitoring.
A specific,sensitive,and reliable bioanalytical method is essentially required for the accurate determination of theKp,uuof ceritinib.Here,we report a fully validated liquid chromatography coupled with tandem mass spectrometry(LC–MS/MS)method for the determination of total and unbound ceritinib in patient plasma and brain tumor tissue.Compared to the published assay[9,10],the present method demonstrated a better sensitivity(1 nM versus 1.79 nM),a larger dynamic range(1–2000 nM versus 1.79–900 nM),and negligible post-injection carryover,while the sample preparation involved a simple one-step protein precipitation.
2.Experimental
2.1.Chemicals and reagents
Ceritinib and the stable isotope-labeled internal standard,[13C6]ceritinib,were provided by Novartis Pharmaceuticals(Basel,Switzerland).All other chemicals and reagents were purchased from VWR International(Radnor,PA,USA)(LC-MS grade).Water was filtered and deionized with a US Filter PureLabPlus UV/UF system(Siemens,Detroit,MI,USA)and used throughout in all aqueous solutions.Drug-free(blank)human plasma from six different healthy donors and pooled plasma(with Na-EDTA anticoagulant)were purchased from Innovative Research Inc.(Novi,MI,USA).
2.2.Chromatographic and mass-spectrometric conditions
2.2.1.Instrumentation
All LC–MS/MS analyses were performed on an AB SCIEX(Foster City,CA)QTRAP 6500 LC–MS/MS system,which consists of a SHIMADZU(Kyoto,Japan)Nexera ultra-high performance liquid chromatography(UHPLC)coupled with a hybrid triple quadrupole/linear ion trap mass spectrometer.The UHPLC system is equipped with two X2 LC-30 CE pumps,an X2 SIL-30AC autosampler,a CBM-20A communication bus module,an X2 CTO-30A column oven,and two DGU-20A degassing units.Analyst®1.6 software was used for system control and data acquisition,and MultiQuant 3.0 software was used for data processing and quantitation.
2.2.2.Liquid chromatography
Chromatographic separation was achieved on a Waters ACQUITY UPLC BEH C18(2.1 mm × 50 mm,1.7 μm)column using an optimized gradient elution consisting of mobile phase A(0.1%formic acid in water)and mobile phase B(0.1%formic acid in acetonitrile),at a flow rate of 0.4 mL/min.The elution gradient program was as follows[shown as the time(min),(%mobile phase B)]:0,40%;0.5,40%;2,100%;2.5,100%;2.7,40%;4,40%.Column oven temperature was maintained at 35°C.To minimize the carryover,external and internal washes were implemented prior to and after the injection for both the auto-sampler syringe and injection port,as follows:methanol(for R3)was used for external wash with one second rinse dip and 500 μL volume,and isopropanol(for R1)and 40%acetonitrile(R0 and R2)were used in the internal wash with sequence R1 to R0 to R2.
2.2.3.Mass spectrometry(MS)
The QTRAP 6500 mass spectrometer was operated in electrospray positive ionization using multiple reaction monitoring mode(MRM).The MS parameters were optimized to obtain the most sensitive and specific MS transitions for ceritinib and[13C6]ceritinib by direct infusion of 1 μM of the standard solutions into the ion source with a syringe pump.The Turbo ion-spray voltage was set at 5500 V and the source temperature was set at 500°C.Collision gas was optimized at medium level with curtain gas,ion source gas 1 and ion source gas 2 delivered at 20,30 and 30 psi,respectively.Decluttering potential,collision energy,collision cell exit potential,and entrance potential were optimized at 143,43.2,10,and 10 V,for ceritinib and 130,43.8,35,and 10 V for[13C6]ceritinib.The dwell time was set for 100 ms.The MS spectra of the parent ions and product ions for ceritinib and[13C6]ceritinib,under positive electrospray ionization mode,are presented in Fig.1.The most sensitive MS transitions ofm/z558.0→433.0 and 564.3→438.9 were selected for monitoring ceritinib and[13C6]ceritinib,respectively.
2.3.Sample preparation
2.3.1.Stock solutions,calibration standards,and quality control(QC)samples
Ceritinib and[13C6]ceritinib stock solutions were prepared in methanol at a final concentration of 5 mM,and stored in brown glass vials at-80°C.Ceritinib working solutions were prepared freshly by serial dilutions of the stock solution with 50%acetonitrile in water on each day of analysis.[13C6]ceritinib working solution was prepared in acetonitrile at the concentration of 100 μM.For the determination of ceritinib in plasma and brain tissue samples,the calibration standards were prepared by spiking 5 μL of ceritinib working solution into 95 μL of blank human plasma to make the final concentrations at 1,2,5,10,20,50,100,200,500,1000,and 2000 nM.For the determination of unbound ceritinib in post-dialysis phosphate buffer solution(PBS,pH 7.4),the calibration standards were prepared in PBS.QC samples were prepared in blank human plasma at the concentrations of 1(LLOQ),3(LOQ),160(MOQ),1600(HOQ),and 30,000 nM(50-fold dilution).All standards and QC samples were prepared fresh daily.For longterm and freeze-thaw stability,QC samples were prepared as a batch and stored at-80°C.
2.3.2.Plasma samples for the determination of total ceritinib plasma concentrations
Frozen plasma samples were thawed at room temperature.An aliquot of 100 μL plasma was transferred into a micro centrifuge tube,and 400 μL ice-cold acetonitrile containing 50 nM[13C6]ceritinib was added.The mixture was vortex-mixed for 10 s and centrifuged at 9000gat 4°C for 10 min.The supernatant was transferred to an autosampler vial and 5 μL was injected into the LC–MS/MS system.
2.3.3.Brain tissue samples for the determination of total ceritinib brain concentrations
Patient brain tumor tissue samples were thawed at ambient temperature.Tissue homogenate was prepared by adding 4 volumes of distilled water into the tissue sample,followed by homogenizing in a Precellys®homogenizer(at 2000gfor two 10 s with 5 s pause).An aliquot of 100 μL of tissue homogenate was protein precipitated using the same procedure as that for plasma samples,and 5 μL supernatant was injected into the LC–MS/MS system.
2.3.4.Equilibrium dialysis for the determination of ceritinib fraction unbound in plasma and brain tissue
The fraction unbound of ceritinib in either plasma or brain tissue homogenate was determined using equilibrium dialysis on a 96-Well Equilibrium DIALYZER™with 5 kDa molecular weight cut-off regenerated cellulose membrane(Harvard Apparatus Holliston,MA),as described previously with modifications[11].briefly,equilibrium dialysis was performed with 200 μL of plasma or tissue homogenate against an equal volume of PBS(pH 7.4)containing 10%acetonitrile on a rotator(Harvard Apparutus Holliston,MA)at 37°C.The optimal time to equilibrium was assessed with pooled human plasma at ceritinib concentrations of 1 and 10 μM for dialysis of 6,16,and 24 h.At the end of dialysis,200 μ Lacetonitrile(containing[13C6]ceritinib,50 nM)was added into each PBS and plasma compartment,and the post-dialysis PBS and plasma samples were transferred into Eppendorf tubes.The mixture was vortex-mixed and centrifuged(9000g,4 °C,10 min).5 μL of the supernatant was injected into the LC–MS/MS system for determining ceritinib concentrations in the post-dialysis buffer solution(Cu)and post-dialysis plasma(Cp)or post-dialysis tissue homogenate(Chom).
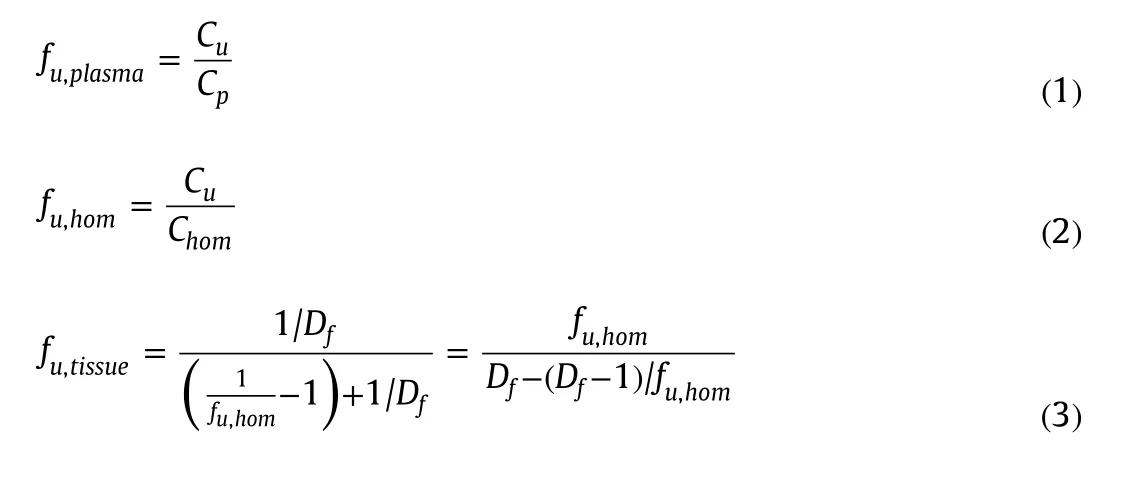
Fraction unbound in plasma(fu,plasma)and in tissue homogenate(fu,hom)was calculated using Eqs.(1)and(2),respectively.Fraction unbound in undiluted brain tissue was calculated based on the measured fraction unbound in diluted tissue homogenate(fu,hom)and dilution factor(Df)using Eq.(3)[12].The total drug recovery was calculated by comparing the total drug concentration recovered in the buffer and plasma(or homogenate)compartments after dialysis with that initially added to the plasma(or homogenate)compartment.
2.4.Method validation using pooled human plasma
2.4.1.Specificity and selectivity
The presence of endogenous interfering peaks was inspected by comparing the chromatograms of the blank matrix(i.e.,plasma from 6 donors or PBS)and those spiked with ceritinib at the LLOQ(1 nM in human plasma)and[13C6]ceritinib at 50 nM.The interfering peak area should be less than 10%of the peak area for the analyte at the LLOQ and less than 5%of the peak area for the internal standard.
2.4.2.Calibration curve,accuracy,and precision
Linearity was assessed at ceritinib concentration ranging from 1 to 2000 nM in human plasma.Calibration curves were built by fitting the analyte concentrations versus the peak area ratios of the analyte to internal standard using linear regression analysis with different weighting scheme(i.e.,1,1/x,and 1/x2),where x represents the concentrations.The selection of weighting scheme was guided by evaluation of goodness-of- fit criteria including correlation coefficient(R2),deviations of the back-calculated concentrations,and residual plots.
Intra-and inter-day precision and accuracy were assessed for the calibrator standards(each in duplicate)and QCs(including LLOQ,low,medium,high,and 50-fold dilution QCs,each in quintuplicate)on three days.The accuracy was assessed as the relative percentage of the determined concentration to nominal concentration.The intra-and inter-day precisions were estimated by one-way analysis of variance (ANOVA)using the JMP™statistical discovery software version 5 (SAS Institute,Cary,NC,USA).The inter-day variance(VARinter),intra-day variance (VARintra),and grand mean (GM)of the observed concentrations across runs were calculated from ANOVA analysis.The intra-day precision (Pintra)was calculated as:The inter-day precision (Pinter)was defined as:where n represents the number of replicate observations within each day.
2.4.3.Matrix effect and recovery
Matrix effect and recovery were assessed in human plasma from 6 different donors,as described previously with modifications[13].Three sets of QC samples(including low,medium and high QCs)were prepared.Set 1 QCs were prepared by spiking ceritinib(at 3,160,and 1600 nM)into 100 μL of 50%acetonitrile.Set 2 QCs were prepared by spiking the same concentrations of ceritinib as Set 1 in 100 μL of blank matrix extract(i.e.,post-precipitation supernatant solution of blank plasma).Set 3 QCs were prepared by spiking the same concentrations of ceritinib as Set 1 in 100 μL of blank human plasma.All 3 set samples were processed by adding 400 μL acetonitrile containing[13C6]ceritinib(50 nM),followed by centrifugation(9000gat 4°C for 10 min),and 5 μL of the supernatants were injected into the LC–MS/MS system.The matrix effect was expressed as the ratio of the mean peak area of the analyte spiked post-precipitation(set 2)to that from neat solution(set 1).The recovery was calculated as the ratio of the mean peak area of the analyte spiked prior to precipitation(set 3)to that from post-precipitation solution(set 2).
2.4.4.Stability tests
The short-term(bench-top)stability of ceritinib in 50%acetonitrile(working solution)at the concentration of 1 and 100 μM as well as in plasma at the concentration of 3 and 1600 nM was tested at ambient temperature(25°C)for 6 h.The autosampler stability of processed samples was tested at 4°C for 9 h.The freeze-thaw stability of ceritinib in plasma(at 3 and 1600 nM)was evaluated after three cycles of freezing and thawing with at least one day of storage at-80°C between each thawing.The longterm stability of ceritinib in plasma(at 3 nM and 1.6 μM)was tested for 8 months.
2.5.Applications
The developed method was used to assess the tumor penetration of ceritinib in patients with glioblastoma or brain metastasis in a phase 0 clinical trial of ceritinib(ClinicalTrials.gov identifier:NCT02605746).The first cohort of 3 patients has been enrolled up to date.The patients were treated with oral ceritinib daily at the dose of 750 mg for 14 days prior to the surgical resection of their tumors at 2–4 h following the administration of the last dose.Blood and tumor samples were collected at the same time.Plasma was separated from whole blood by centrifugation(at 4°C,1500g,for 10 min),and plasma samples were stored at-80°C until analysis.Brain tumor tissue was washed off blood with ice-cold PBS,blot-dried on tissue paper,snap-frozen in liquid nitrogen,and stored at-80°C until analysis.The protocol was approved by the Institutional Review Board of the Barrow Neurological Institute,St.Joseph's Hospital&Medical Center(Phoenix,AZ).All the patients provided a written informed consent.
Brain tumor tissue homogenates were prepared,as described in Section 2.3.3.Ceritinib total concentrations in plasma and tumor tissue homogenate samples were determined using the validated LC–MS/MS method.Unbound fractions of ceritinib in plasma and brain tumor tissue were determined using the equilibrium dialysis method as described in Section 2.3.4.Ceritinib unbound concentration in plasma or tumor tissue was calculated by multiplying the total drug concentration and fraction unbound.TheKp,uuwas calculated as the ratio of unbound drug brain tumor tissue concentration to unbound drug plasma concentration.
3.Results and discussion
3.1.Method development
Ceritinib is a weak base with pKavalues of 9.7 and 4.1.It has good solubility in DMSO,organic solvents(e.g.,methanol and acetonitrile),and very acidic aqueous solution(e.g.,0.1 N hydrochloric acid).Its aqueous solubility decreases significantly with increased pH.The measured unionized species octanol/water partition coefficient(LogP)of ceritinib is 4.6,and the total species octanol/buffer(pH 6.8)distribution coefficient(LogD)is 1.69.
Based on its physicochemical properties,a reversed-phase liquid chromatography method using a Waters ACQUITY UPLC BEH C18column was optimized for the separation of ceritinib.Under the optimized gradient elution with a total running time of 4 min,ceritinib was eluted at the retention time of~1.6 min,with a sharp,symmetrical peak(Fig.2).There was no apparent interference peak in the blank human plasma or PBS(Fig.2).
Post-injection carryover was noted in the published study and during our assay development.To minimize the carryover,the external and internal washes with isopropanol(R1)and 40%acetonitrile(R0 and R2)were implemented for the syringe and injection port.Using the optimized washing condition,the mean peak area in the blank sample following the highest ceritinib calibrator injection was 1272±196.5(9 injections on 3 days),which is less than 5.0%of the mean peak area of the LLOQ(25,387±7921,9 injections on 3 days),suggesting the carryover was abolished.
Notably,ceritinib,when present in protein-free aqueous solution(e.g.,PBS),exhibited significant adsorption to equilibrium dialysis plates,probably due to its high hydrophobicity(LogP,4.6).To eliminate the adsorption,we modified equilibrium dialysis procedures by adding 10%acetonitrile into the PBS compartment during the dialysis,and adding 200 μL acetonitrile into both PBS and plasma compartments at the end of dialysis,followed by the collection of post-dialysis PBS and plasma samples.These procedures effectively reduced the adsorption,as indicated by an average of 91%(range,86%–93%)recovery of ceritinib at the end of 24 h dialysis for the QC samples(at 1 and 10 μM).
3.2.Method validation
The developed method was fully validated using pooled human plasma for the selectivity,sensitivity,linearity,accuracy and precision,matrix effect and recovery,as well as stability according to the US Food and Drug Administration guidance to bio-analytical method validation.
The selectivity for the analysis was shown by symmetrical resolution of the chromatographic peaks,with no significant interference from 6 different donors of plasma(Fig.2).Representative chromatograms of blank and spiked with ceritinib in human plasma samples at LLOQ as well as a patient plasma sample collected at 8 h after the oral administration of ceritinib 750 mg are shown in Fig.2.
The plasma linear calibration curves were constructed using the peak area ratio of ceritinib to[13C6]ceritinib over ceritinib concentration range of 1–2000 nM in human plasma.The calibration curve was best fitted by a weighted(1/x2)least-squares linear regression,expressed as y=a⋅x+b,where y is peak area ratio,x is the analyte concentration,with a and b as fitted parameters.A linear correlation coefficient(R2)of>0.99 was obtained in all analytical runs.
For all calibrator standards(including LLOQ),the average accuracy in terms of the percentage of the back-calculated concentrations relative to the nominal concentrations ranged from 94.5%to 106.7%;the intra-and inter-day assay precisions were less than 8.8%(Table 1).For the QC samples(i.e.,at the LLOQ,low,medium and high QC concentrations),the average accuracy ranged from 93.1%to 100.7%,and the intra-and inter-day precisions were within 10.3%(Table 2).In addition,accuracy and precision were evaluated for 50-fold dilution QC samples(at 30 μM in human plasma),which demonstrated the average accuracy of 96.1%,and intra-and inter-day precisions of 1.7%and 2.7%,respectively(Table 2).
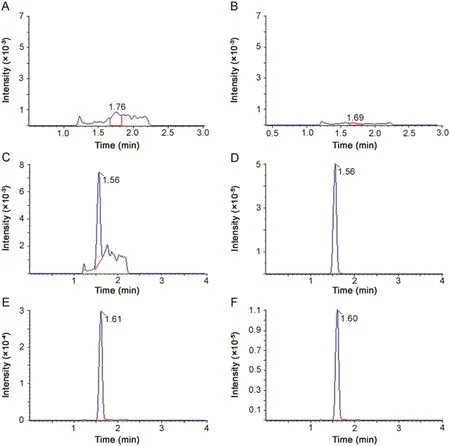
Fig.2.Extracted ion chromatograms of(A and B),blank plasma(C and D)human plasma spiked with ceritinib at LLOQ(1 nM)and(E and F)a 20-fold diluted patient plasma sample collected at 8.0 h after oral administration of a single dose of ceritinib(750 mg).All samples were monitored at m/z 558.0→433.0 for ceritinib and at m/z 564.3→438.9 for[13C6]ceritinib.All plasma samples except for the blank were precipitated with 4 volumes of acetonitrile containing the internal standard[13C6]ceritinib(50 nM).
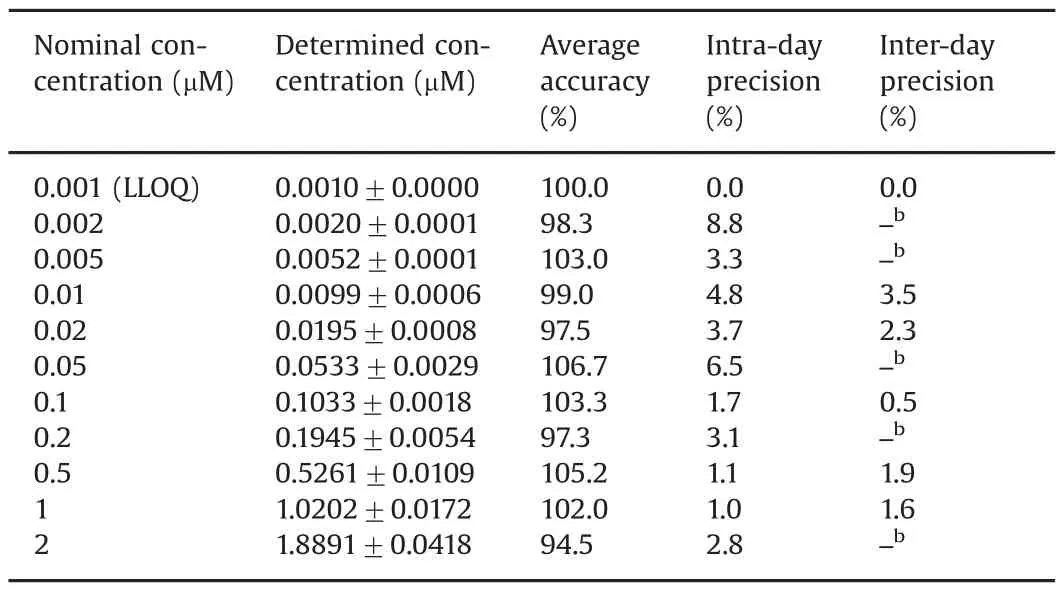
Table 1Accuracy,intra-and inter-day precisions of ceritinib calibrator standards in plasma.a
The matrix effect was examined in human plasma from 6 different donors to assess the potential of ionization suppression or enhancement for ceritinib and[13C6]ceritinib.The average matrix factor of ceritinib determined from 6 different donors of plasma ranged from 0.72 to 0.82 at the low,medium and high QC concentrations,and the interindividual variability,assessed as the coefficient of variation(CV%)from 6 donors of plasma,was<24.7%(Table 3).The matrix factor(expressed as average±standard deviation)of[13C6]ceritinib(at 50 nM)from 6 different donors of plasma was 0.89±0.23.The relative matrix factor of ceritinib,calculated as the ratio of the peak area ratio of ceritinib and[13C6]ceritinib in post-extracted solution(set 2)relative to that in neatsolution(set 1)was>0.84 at three QC concentrations,with the interindividual variability<5.4%(Table 3),suggesting that the isotope-labeled internal standard adequately corrected for the variation of matrix effect from different sources of plasma.
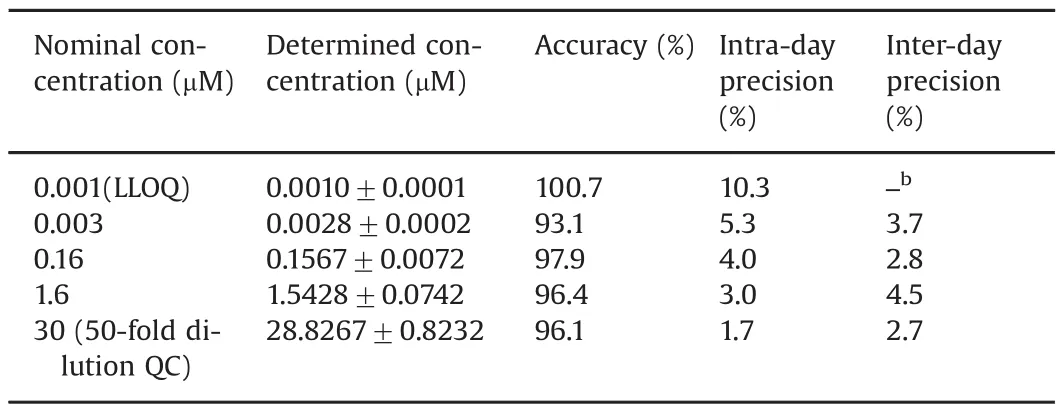
Table 2Accuracy,intra-and inter-day precisions of ceritinib quality control samples in human plasma.a
The average recovery of ceritinib at three QC concentrations from 6 donors of plasma ranged from 96.1%to 105.1%,and the inter-individual variability was within 15.9%(Table 3).The recovery of[13C6]ceritinib at the concentration of 50 nM from 6 different donors of human plasma was 82.3%±9.2%(Table 3).The relative recovery of ceritinib,estimated as the ratio of the peak area ratio of ceritinib to[13C6]ceritinib in plasma(set 3)relative tothat in the post-extracted solution(set 2),was consistently(~110%)at threeQC concentrations,with the interindividual variability<5.5%(Table 3),suggesting that the isotope-labeled internal standard well corrected for the variation of the extraction recovery from different matrices.
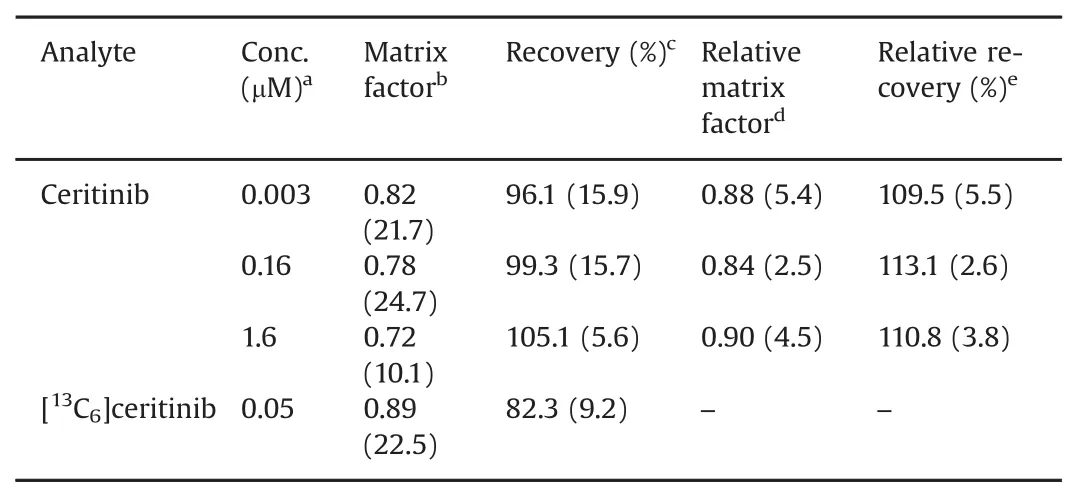
Table 3Matrix effect and recovery of ceritinib and[13C6]ceritinib from 6 different donors of human plasma.
The short-and long-term stability data of ceritinib are summarized in Table 4.Bench-top stability test suggested that ceritinib was stable in both 50%acetonitrile(at 1 and 100 μM)and human plasma(at 3 nM and 1.6 μM)at ambient temperature(~ 25 °C)for at least 6 h.Autosampler stability test suggested that ceritinib was stable in the protein precipitation solution at 4°C for at least 9 h,allowing the assay to be performed continuously during the night for a large number of samples.Freeze-thaw stability test of plasma samples at low and high QC concentrations showed that no significant amount of ceritinib degraded after three freeze-thaw cycles.The long-term stability tests suggested that the ceritinib was stable in human plasma at low and high QC concentrations(3 and 1600 nM)at-80°C for 1 month,suggesting clinical samples should be analyzed within 1 month of storage at-80°C.
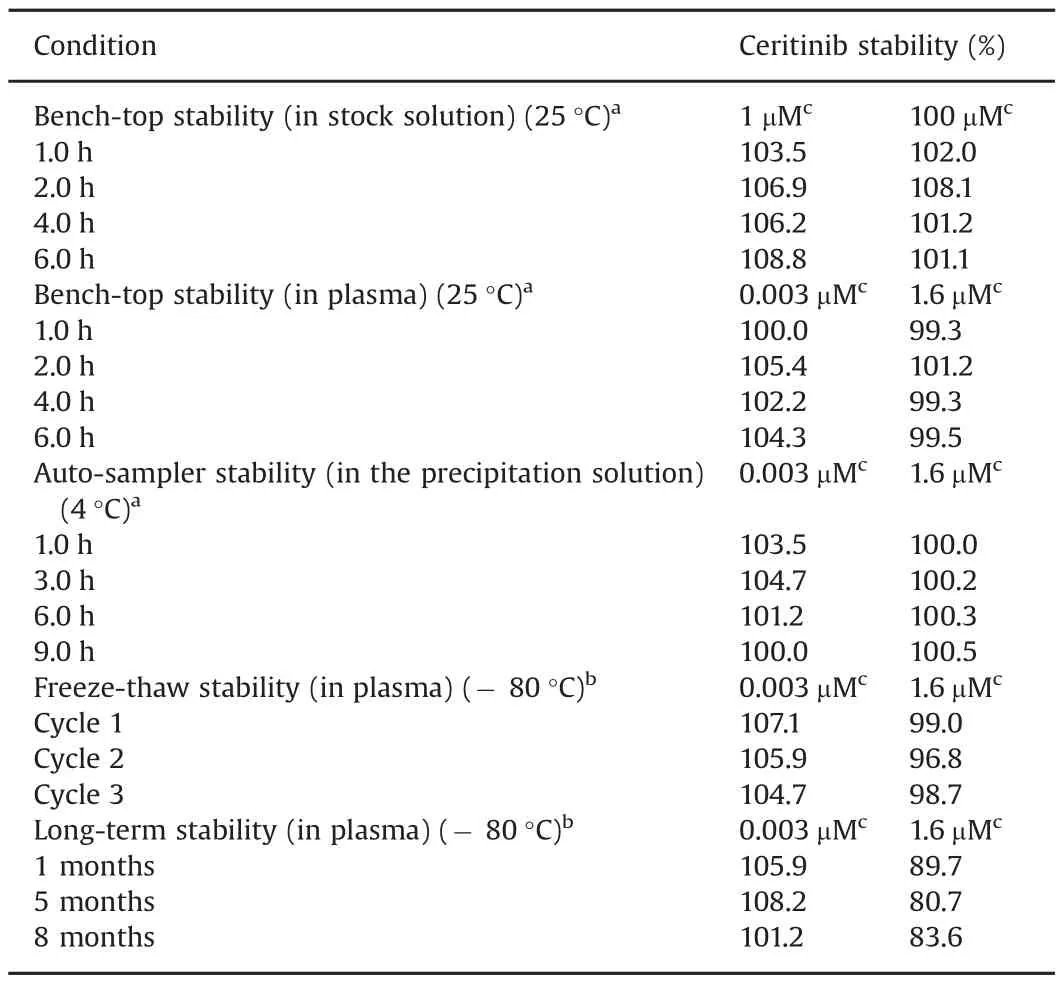
Table 4Assessment of stability of ceritinib.
3.3.Applications
While the present method was fully validated in human plasma only,the method was successfully applied in determining ceritinib concentrations in patient plasma,brain tumor tissue homogenate,and post-dialysis PBS samples.The broad application of the method was attributable to the use of a stable isotope-labeled internal standard that can adequately correct for the variability in the matrix effects and extraction recovery of the analyte across different matrices.
To determine the unbound concentrations of ceritinib in patient plasma and brain tumor tissue,an equilibrium dialysis method using 96-well microdialysis plates was optimized.The optimum equilibrium time was determined at 24 h,at which the dialysis reached equilibrium(Fig.3).Ceritinib was highly bound to human plasma proteins,with an average fu,plasmavalue of 2.5%in pooled human plasma at clinically relevant concentrations(1–10 μM)(Fig.3).In the first cohort of 3 patients receiving daily ceritinib treatment at 750 mg for 14 days,the average fu,plasmaof ceritinib at the steady-state plasma samples was 1.68%.Interestingly,compared to the plasma protein binding,ceritinib showed a higher binding to brain tumor tissue in the patient with neck/head cancer brain metastasis(fu,brain,0.19%)and with melanoma brain metastasis(fu,brain,0.23%),but not in the patient with breast cancer brain metastasis(fu,brain,7.6%).These data indicated a large interindividual variability in ceritinib binding to brain tumor tissue among different tumor types of brain metastasis.Consistently,ceritinib tumor penetration showed a large heterogeneity among various tumor types of brain metastasis,with the highest penetration in breast cancer brain metastasis(Kp,uu,40.6),followed by melanoma brain metastasis(Kp,uu,2.75)and head/neck brain metastasis(Kp,uu,0.34).Further studies are needed to understand the mechanisms underlying the heterogeneous brain tumor penetration of ceritinib.
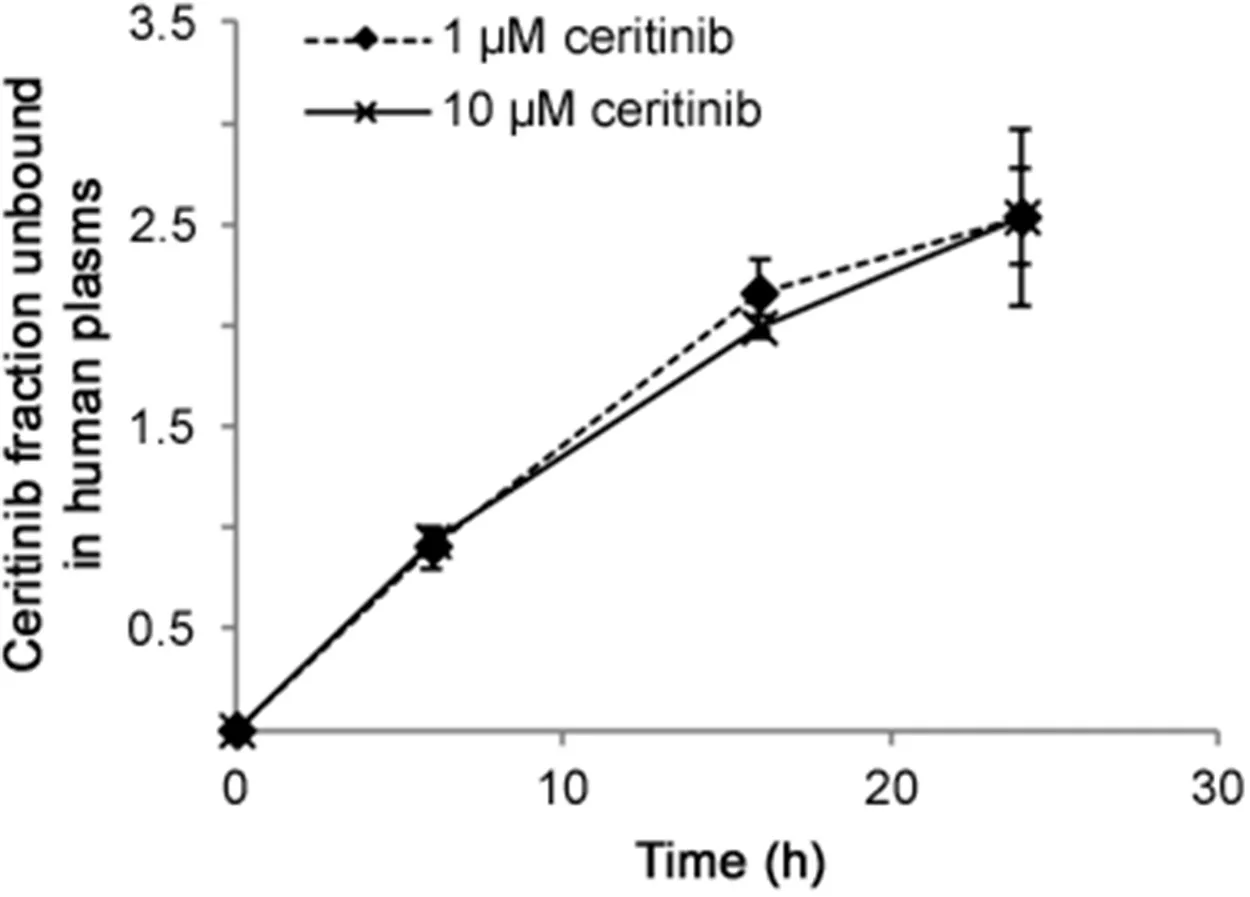
Fig.3.Fraction unbound of ceritinib in pooled human plasma determined at the equilibrium time of 6,16,and 24 h.Values are the mean±standard deviation of triplicate measurements.
4.Conclusion
A rapid,sensitive,and robust LC–MS/MS method based on reversed-phase liquid chromatography was developed for the quantitation of total and unbound ceritinib in plasma and brain tissue samples.The method was fully validated with human plasma.Sample preparation involved a simple protein precipitation.The chromatography running time was 4 min.The LLOQ was 1 nM of ceritinib in human plasma.The linear calibration curve was established over ceritinib concentration range of 1–2000 nM in human plasma.This method was successfully applied to assess ceritinib brain tumor penetration,as assessed by theKp,uu,in patients with metastatic brain tumors.
Conflicts of interest
The authors declare that there are no Conflicts of interest.
This study was supported by the United States Public Health Service Cancer Center Support Grant P30 CA022453.We thank Novartis for providing the study drug and isotope-labeled internal standard and providing financial support for the clinical study.We particularly thank the patients enrolled in the study.
[1]R.Chiarle,C.Voena,C.Ambrogio,et al.,The anaplastic lymphoma kinase in the pathogenesis of cancer,Nat.Rev.Cancer 8(2008)11–23.
[2]S.J.Rodig,M.Mino-Kenudson,S.Dacic,et al.,Unique clinicopathologic features characterize ALK-rearranged lung adenocarcinoma in the western population,Clin.Cancer Res.15(2009)5216–5223.
[3]A.K.Murugan,M.Xing,Anaplastic thyroid cancers harbor novel oncogenic mutations of the ALK gene,Cancer Res.71(2011)4403–4411.
[4]C.Powers,A.Aigner,G.E.Stoica,et al.,Pleiotrophin signaling through anaplastic lymphoma kinase is rate-limiting for glioblastoma growth,J.Biol.Chem.277(2002)14153–14158.
[5]W.R.Sukov,J.C.Hodge,C.M.Lohse,et al.,ALK alterations in adult renal cell carcinoma:frequency,clinicopathologic features and outcome in a large series of consecutively treated patients,Mod.Pathol.25(2012)1516–1525.
[6]R.S.Tuma,ALK gene amplified in most inflammatory breast cancers,J.Natl.Cancer Inst.104(2012)87–88.
[7]L.Landi,F.Cappuzzo,Ceritinib for the treatment of patients with anaplastic lymphoma kinase(ALK)-positive metastatic non-small cell lung cancer,Expert Rev.Clin.Pharmacol.9(2016)203–214.
[8]M.Hammarlund-Udenaes,M.Friden,S.Syvanen,et al.,On the rate and extent of drug delivery to the brain,Pharm.Res.25(2008)1737–1750.
[9]O.Heudi,D.Vogel,Y.Y.Lau,et al.,Liquid chromatography tandem mass spectrometry method for the quantitative analysis of ceritinib in human plasma and its application to pharmacokinetic studies,Anal.Bioanal.Chem.406(2014)7389–7396.
[10]C.Lanshoeft,O.Heudi,M.Raccuglia,et al.,Ultrafast quantitative MS-based method for ceritinib analysis in human plasma samples from clinical trial,Bioanalysis 7(2015)425–435.
[11]J.Li,J.Brahmer,W.Messersmith,et al.,Binding of gefitinib,an inhibitor of epidermal growth factor receptor-tyrosine kinase,to plasma proteins and blood cells:in vitro and in cancer patients,Invest.New Drugs 24(2006)291–297.
[12]H.Wan,M.Rehngren,F.Giordanetto,et al.,High-throughput screening of drug-brain tissue binding and in silico prediction for assessment of central nervous system drug delivery,J.Med.Chem.50(2007)4606–4615.
[13]J.Wu,R.Wiegand,P.LoRusso,et al.,A stable isotope-labeled internal standard is essential for correcting for the interindividual variability in the recovery of lapatinib from cancer patient plasma in quantitative LC-MS/MS analysis,J.Chromatogr.B Anal.Technol.Biomed.Life Sci.941(2013)100–108.
杂志排行
Journal of Pharmaceutical Analysis的其它文章
- S-Nitroso-N-acetyl-L-cysteine ethyl ester(SNACET)and N-acetyl-L-cysteine ethyl ester(NACET)–Cysteine-based drug candidates with unique pharmacological profiles for oral use as NO,H2S and GSH suppliers and as antioxidants:Results and overview
- Tissue-based metabolite profiling and qualitative comparison of two species of Achyranthes roots by use of UHPLC-QTOF MS and laser micro-dissection
- Denaturation studies on bovine serum albumin–bile salt system:Bile salt stabilizes bovine serum albumin through hydrophobicity
- Insight into the interaction of inhaled corticosteroids with human serum albumin:A spectroscopic-based study
- Effect of nonionic surfactants in release media on accelerated in-vitro release profile of sirolimus eluting stents with biodegradable polymeric coating
- Electrooxidation of sulfanilamide and its voltammetric determination in pharmaceutical formulation,human urine and serum on glassy carbon electrode
