基于Landsat 8 OLI影像纹理特征的面向对象土地利用/覆盖分类
2018-02-28孙天娇王晓妍
裴 欢,孙天娇,王晓妍
基于Landsat 8 OLI影像纹理特征的面向对象土地利用/覆盖分类
裴 欢1,2,3,孙天娇1,王晓妍1,2,3
(1. 燕山大学信息科学与工程学院,秦皇岛 066004; 2. 河北省计算机虚拟技术与系统集成重点实验室,秦皇岛 066004; 3. 河北省软件工程重点实验室,秦皇岛 066004)
针对如何提高中低分辨率遥感影像分类精度,该研究以河北省石家庄市Landsat 8 OLI遥感影像为研究对象,对灰度共生矩阵(gray-level co-occurrence matrix, GLCM)纹理与伽博(Gabor)滤波器下的Gist纹理特征进行对比,应用J-M(Jeffries-Matusita)距离可分离性分析GLCM最优纹理特征,并利用最佳指数法(optimum index factor, OIF)获取GLCM与Gist纹理特征的最佳特征组合;其次对面向对象分类的分割尺度进行研究,提出整体最优分割尺度计算方法;最后进行基于纹理特征的面向对象分类识别与精度评价,并与基于原始数据的面向对象分类结果进行对比。研究表明:Gist纹理特征使分类精度有了一定的提高,基于纹理数据的面向对象支持向量机(support vector machine, SVM)分类及面向对象K邻近法(K-nearest neighbor, KNN)分类的总体分类精度(overall accuracy, OA)分别比基于原始数据的2种方法分类精度提高3.67和3.33个百分点,基于纹理的面向对象SVM方法具有最高的精度,OA达到85.67%。不管是基于原始数据还是纹理数据,面向对象分类精度远高于最大似然分类(maximum likelihood classification,MLC)、马氏距离分类(mahalanobis distance classification, MDC)和SVM分类精度,且面向对象分类方法对纹理数据更为敏感。该文提出的基于纹理的面向对象分类方法有效提高了遥感影像分类精度,为区域土地利用/覆盖信息提取提供了有效的途径。
遥感;土地利用;分类;纹理特征;面向对象分类;Gist特征;监督分类
0 引 言
随着科技的进步,纹理分析技术在计算机目标识别和自动检测、图像合成与分割、遥感测量等方面发挥着越来越重要的作用[1-3],研究表明,遥感影像丰富的纹理信息参与分类比单纯利用光谱信息具有更好的分类效果[4-5]。纹理特征提取方法主要包括:以灰度共生矩阵为代表的统计方法;基于马尔科夫随机场模型的方法;基于自相关函数的方法;基于频域的傅里叶变换的方法、小波变换法等[6-7]。这些方法中,灰度共生矩阵(gray-level co-occurrence matrix,GLCM)是目前用于辅助遥感数据进行土地利用/覆盖分类及专题信息提取最普遍的方法,在不同类型遥感数据中都得到了应用,并取得较好分类效果。李粉玲等提取基于变差函数、灰度共生矩阵和梯度的多纹理特征,并结合光谱信息构建分类特征集,采用支持向量机(support vector machine,SVM)分类方法对国产资源一号02C星高分辨率影像进行了冬小麦信息的提取[8];金瑞等利用高光谱数据提取GLCM纹理特征,结合光谱信息建立了基于极限学习机和支持向量机的马铃薯多分类识别模型,有效地识别了马铃薯多项缺陷指标[9];宋荣杰等结合GLCM纹理及光谱特征,采用SVM分类对QuickBird影像苹果园进行了提取,分类总精度达到96.16%[10]。Gist特征是基于Gabor滤波器的纹理特征[11],可以较好地呈现图像的空间尺度、空间结构和方向选择,在场景分类研究中有一定的应用[12-13],但目前还未应用到遥感影像地物识别中。将不同纹理特征引入遥感地物分类中,探讨纹理特征对不同遥感数据及对各种分类方法的适用性是遥感研究中的一项重要内容,对解决地物错分,提高分类精度有重要意义。本研究将Gist特征引入遥感土地利用/覆盖分类中,将其与GLCM纹理进行对比,分析2种纹理特征在中分辨率遥感影像地物识别中的作用,扩展纹理特征应用领域。
目前遥感分类方法多采用基于像元的分类算法,忽略了影像丰富的几何形状、拓扑关系和空间特征等信息,分类结果不可避免地会产生“椒盐”现象,这在异质性较强的城市区域尤为显著[14-15]。面向对象分类在考虑影像光谱特征的情况下兼顾影像空间、形状与纹理特征,可有效改善传统监督分类精度不高的弊端,对提高遥感分类精度具有重要意义[16-17]。目前,面向对象方法主要应用于高分辨率影像,在高分辨率遥感数据土地利用信息提取中具有较强的优势,对中等分辨率遥感数据的适用性研究还不深入。Landsat 8 OLI数据作为中等分辨率遥感数据,不仅可免费获取,而且时间分辨率较高,每隔16 d可重复得到同一地区数据,相对于高分辨率遥感数据,时间分辨率及光谱分辨率均具有一定的优势,在大范围土地利用信息提取中具有广阔的应用前景。另外,面向对象分类中最优分割尺度的选择也一直是国内外学者研究的重点,分割尺度选择不同可能会造成影像的“分割不足”和“过度分割”,对分类结果产生不利影响[18]。鉴于此,本文基于Landsat 8 OLI遥感影像,以高异质性区域—河北省石家庄为研究对象,提取GLCM及Gist纹理特征,并进行纹理特征筛选。在面向对象分类中,运用“面积对象数比”选择最佳影像分割尺度,采用K邻近法(K-nearest neighbor, KNN)与支持向量机(support vector machine, SVM)2种面向对象分类方法对结合纹理信息的影像进行分类识别[19-21],探讨面向对象分类对中等分辨率遥感数据的适用性以及不同纹理特征对面向对象分类的影响,为高异质性城郊的土地分类研究提供新的思路。
1 研究区概况与数据
河北省石家庄市(37°51'N-38°7'N,114°22'E-114°43'E)位于河北省西南部,环渤海湾经济区,含8个辖区、11个县,代管3个县级市,总面积为14 084 km2,市区面积为2 206 km2,西部太行山地,海拔1 000 m左右,东部平原,海拔一般在30~100 m。石家庄的土地构成以耕地为主,占41.8%,未利用地所占比重也较大,土地利用结构不尽合理。
本文选取石家庄地区中部为研究区,涉及多个行政单元,包括部分石家庄市辖区,正定县和元氏县部分地区。依据研究区土地利用特点,将研究区土地利用/覆盖类型划分为8种类别,即:耕地、林地、草地、居民地、水体、未利用地、工矿用地和道路交通用地。图1为研究区地理位置图。
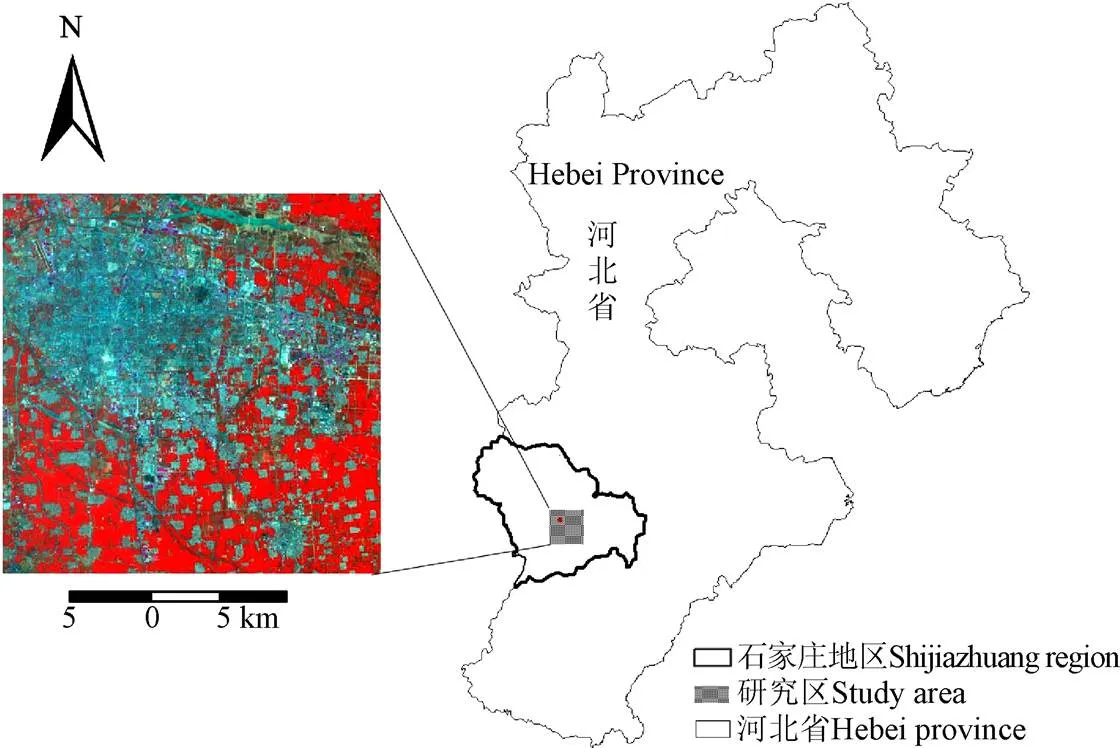
图1 研究区区域位置示意图及遥感影像
以2016年4月25日成像的Landsat 8 OLI中分辨率遥感影像为研究对象,数据轨道号为124/34,数据来源于中国科学院计算机网络信息中心地理空间数据云(http://www.gscloud.cn)。影像包含空间分辨率为15 m的1个全色波段band8(0.50~0.68m)和空间分辨率为30 m的10个多光谱波段。选择其中8个可见光波段和全色波段参与研究。获取的Landsat 8 OLI影像数据已进行了辐射校正和几何校正,后续采用Gram-Schmidt方法进行多光谱与全色数据融合[22],最后经裁剪得到空间分辨率为15 m的2000´2000像素的区域。
2 研究方法
2.1 纹理特征提取方法
2.1.1 GLCM纹理提取
GLCM是通过计算图像灰度级之间条件概率密度来提取纹理的一种经典分析方法[23-24]。本文选取应用较广泛的均值(Mean)、方差(Variance)、协同性(Homogeneity)、对比度(Contrast)、相异性(Dissimilarity)、信息熵(Entropy)、二阶矩(Second Moment)和相关性(Correlation)8种GLCM纹理量进行纹理特征分析[25]。为了提高纹理特征提取效率,应用主成分分析法(principal components analysis,PCA)对多波段数据进行主成分提取[26]。经主成分变换后,第1主成分(PCA1)包含所有波段82.58%的信息,前3个主成分(PCA123)包含99.08%的信息。使用PCA1从4种窗口尺度(3´3,5´5,7´7,9´9)提取8种纹理特征,并讨论提取纹理特征的最佳窗口。
分析GLCM最佳窗口之后,需对8种GLCM纹理量进行筛选,识别最优纹理特征。本文运用平均J-M距离分析最优纹理特征。J-M距离可以衡量训练样本间可分离性[27],其值具有收敛性,在0~2之间。当J-M值小于1时,两类别之间不具备样本可分性;J-M值大于1小于1.8时,有一定可分性但是重叠性较大;J-M值大于1.8时可分性较好。在OLI影像中预先选取分离性大于1.8的感兴趣区样本,将得到的8种GLCM纹理特征分别与PCA123进行合成,测量8种合成数据的平均J-M距离,最后通过距离大小选定GLCM最优纹理特征。
2.1.2 Gist纹理提取
Gist特征通过模拟人眼视觉来提取图像的信息,主要用于场景分类。Gist特征通常使用多尺度多方向的二维Gabor滤波器

式中和分别代表图像像素的横纵坐标;、为沿方向和方向上高斯分布的方差;0为滤波器频率;为谐波相位差。二维Gabor函数的实质可以看成为余弦函数对二维高斯函数的调制。
在Gabor滤波器的基础上通过尺度和旋转变换可以构建多尺度多方向的Gabor滤波器组,其实际上是一种自相似Gabor小波,即
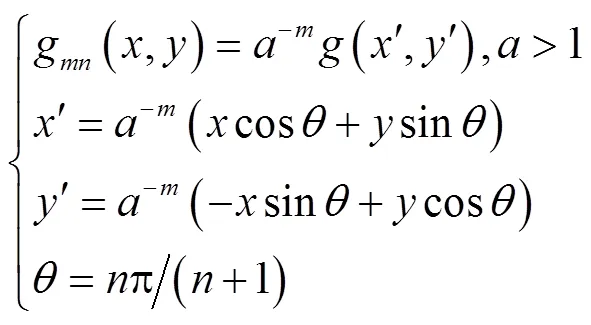
式中a为母小波膨胀尺度因子;为滤波器的方向;、分别为Gabor滤波器的尺度数和方向数,通过调整和的值就可以构造不同方向、尺度下的二维Gabor滤波器[12]。
设原始单波段影像为(,),对图像用n通道(n=·,即尺度方向)的滤波器进行卷积滤波,最后将计算结果进行级联,即为图像的Gist特征:

式中cat为级联运算;*为卷积运算符号;为Gist特征。
2.1.3 选择最佳纹理特征组合
纹理特征之间的相关性会造成信息冗余,应选择信息量大、纹理间关联程度低的组合参与分类。为减少信息冗余,同时为了对数据进行降维,采用最佳指数因子(optimum index factor,OIF)建立最优纹理特征组合。其基本原理是:图像中所涵盖的信息量与其标准差成正比,标准差越大,信息量就越多;图像的独立性与波段间的相关系数成反比,其相关系数越低,信息冗余度越小,其独立性越好。此方法综合了各波段间的关联性及单波段图像的信息量,得到了广泛应用[28],计算公式为

式中OIF为最佳指数因子;SD为波段的标准差;R为,波段间的相关系数。
2.2 面向对象分割尺度的选择
影像分割是将给定的影像划分为互不重叠的区域。分割尺度是重要参数,指在图像对象合并中,允许出现的最大异质性变化的度量值,分割尺度越大,生成对象的面积越大,错分概率越大;分割尺度越小,不同类别像元被“错分”成一个对象的可能性降低,但会使同一类别对象数目增多,造成数据量繁杂,反而降低分类精度。所以最优分割尺度选择的原则是既能精确地提取不同类别,但又要保证数据量小[29-30]。在大量试验的基础上,本研究提出了一种基于分类后地物最大面积与地物对象数的“面积对象数比”法计算适合影像样本的整体最优分割尺度。其基本思路为:不同地物分割尺度趋近于该地物最优分割尺度时,分类后地物最大面积应趋于平缓,对象数也应趋于稳定。但当尺度发生变化,分割尺度不适合此地物时,分类后地物最大面积会发生较大变动,而该尺度下的地物对象数也会出现剧烈变化。根据分类后各地物的最大面积和对象数比值可以得出适合各地物的最优尺度。
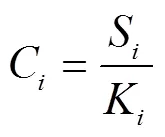
式中C为第类样本面积对象数比,S为第类地物最大面积,K为第类地物中所含对象数,即斑块数。所有类别的平均面积对象数比为
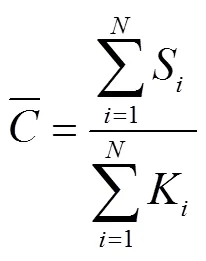
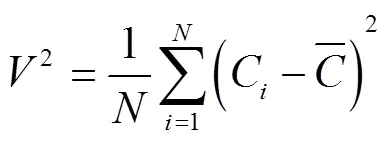
当选择不同分割尺度时,2随尺度变化而变化,当方差2最小时,此时的分割尺度为适合影像的整体最优分割尺度。
3 结果与分析
3.1 GLCM纹理窗口及最优纹理特征
进行GLCM纹理提取时,首先探讨不同基准窗口对纹理特征的影响。计算在不同窗口尺度(3×3,5×5,7×7,9×9)下8种纹理特征值的变化情况,纹理特征值随窗口尺度变化趋势如表1所示。

表1 不同窗口尺度下纹理特征值变化
当基准窗口尺度从3×3到5×5以及从7×7到9×9时,纹理特征值变化较明显;窗口尺度从5×5到7×7时,纹理特征值变化相对较小,比较稳定;若将纹理特征值较为稳定的窗口视为最佳窗口,则5×5和7×7窗口都是最佳选择,但由于窗口尺度从3×3到5×5的变化趋势最为明显,因而窗口尺度为5×5时能够达到比较稳定的状态,从而确定分析窗口5×5为最佳分析窗口。
根据表1结果,选择均值、方差、对比度、相异性和信息熵5种特征值较高的纹理特征进行距离可分性分析。图2为5种纹理特征分别与PCA1、PCA2、PCA3合成后的平均J-M距离统计结果,可以看出,对比度(Contrast,Con)具有最高的J-M值,最终选择对比度作为GLCM的最优纹理特征。
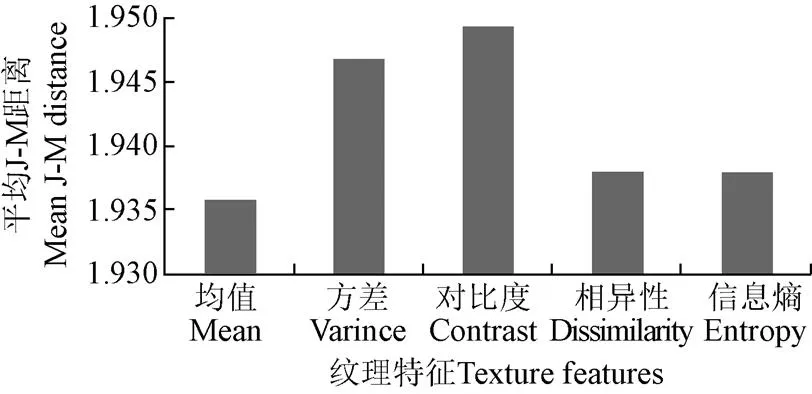
图2 GLCM纹理特征平均J-M距离
3.2 最佳纹理特征组合
对原始数据8个波段进行GLCM Con及Gist纹理特征提取,分别得到8个GLCM Con纹理特征及8个Gist纹理特征。对2种纹理特征进行OIF指数计算,每种纹理特征分别有56种组合,表2为OIF值较高的GLCMCon 组合以及Gist纹理组合,可以看出,Gist纹理特征OIF指数均高于GLCM Con纹理,其中原始数据第5波段Gist特征(Gist 5),第7波段Gist特征(Gist 7)和第8波段Gist特征(Gist 8)3个特征的OIF指数最高,达到26.1,采用Gist 5,Gist 7和Gist 8作为最终纹理特征参与分类。

表2 纹理特征最佳指数因子OIF统计结果
3.3 整体最优分割尺度的选择
根据本文提出的面积对象数比法,统计了在不同分割尺度下分类后各地物的最大面积以及所含对象数,所用分类方法为面向对象K邻近法(K-nearest neighbor, KNN)。表3为不同地物各项指标数值随分割尺度变化情况。

表3 不同分割尺度下地物面积对象数比
从表3可以看出,当分割尺度为20时,方差值最小,此时各样本的面积对象数比变化最为平缓,该尺度为最适合影像的整体最优分割尺度。
3.4 分类结果
3.4.1 面向对象分类结果
采用面向对象K邻近法(K-nearest neighbor, KNN)与面向对象支持向量机(support vector machine, SVM)两种方法分别对原始影像及原始数据与Gist纹理合成数据(简称纹理数据)进行分类。结合Google Earth同期影像对研究区影像进行目视解译,采用随机撒点的方式选择精度验证点,每类地物至少选择了30个样本,建立混淆矩阵。应用制图精度(producer’s accuracy, PA)、用户精度(user’s accuracy, UA)、Kappa系数和总体分类精度(overall accuracy, OA)4个指标对分类结果进行验证,其中,OA和Kappa系数用于比较整体分类精度,PA和UA用于评价特定类别的分类精度,具体分类结果精度如表4所示。
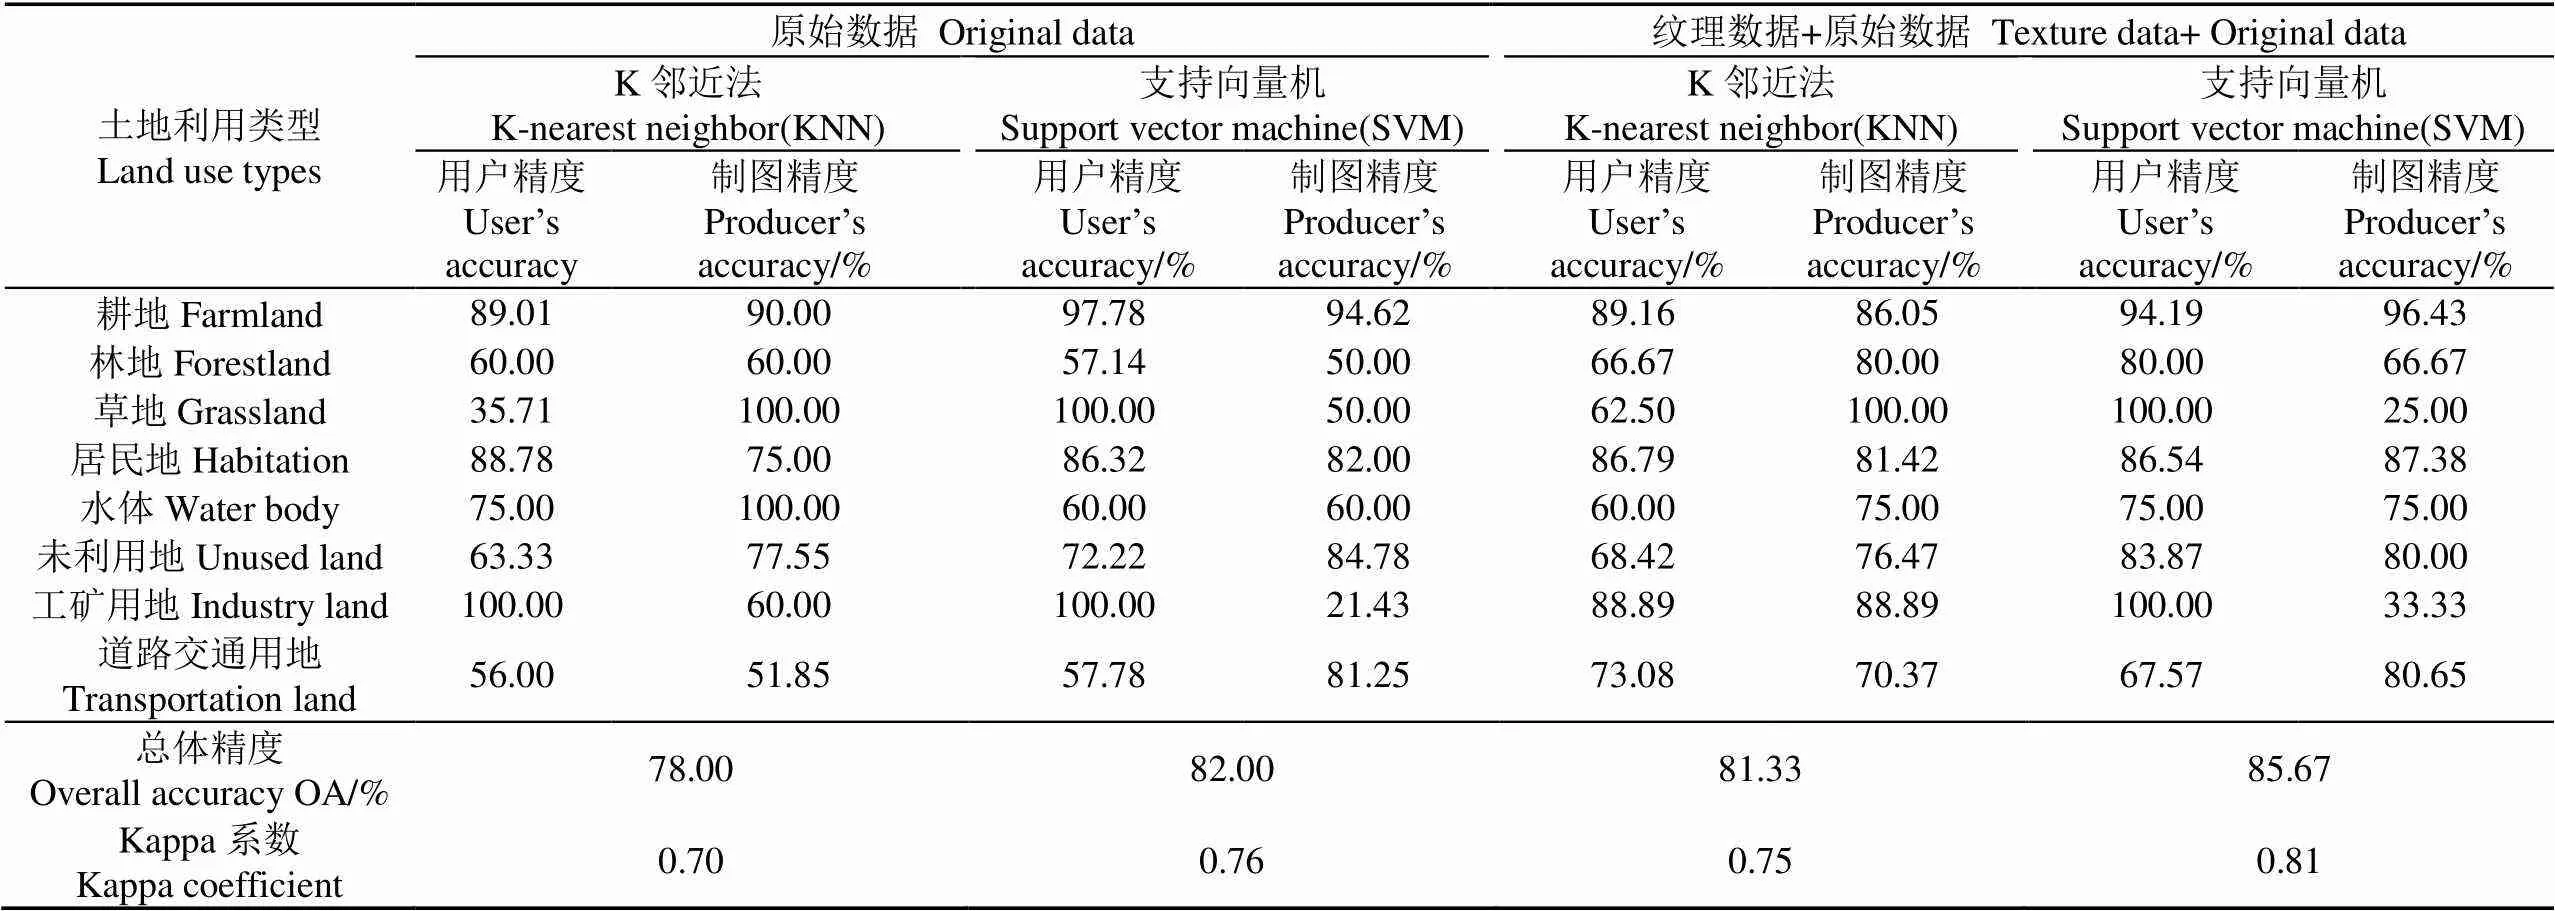
表4 基于原始数据和纹理数据的面向对象分类精度对比
从表4可以看出,面向对象SVM分类较之面向对象KNN具有更高的分类精度,基于原始数据的面向对象SVM分类OA和Kappa系数分别比基于原始数据的面向对象KNN高4个百分点和0.06;基于纹理数据的面向对象SVM分类精度仍高于面向对象KNN。可见,无论是对原始数据还是对纹理数据进行分类,面向对象SVM方法分类效果较好。
加入纹理特征后,面向对象SVM分类和面向对象KNN分类精度均有所提高,相对于原始数据分类结果,面向对象KNN分类的OA提高了3.33个百分点;面向对象SVM分类的OA提高了3.67个百分点。基于纹理的面向对象SVM分类具有最高分类精度,OA和Kappa系数分别达到85.67%和0.81。Gist纹理特征能够更好地表达影像空间尺度与空间结构的纹理信息,在进行面向对象分类时,有助于提高地物识别精度,特别是对于纹理特征明显的地物,如道路交通用地,基于纹理特征的分类精度均比原始数据精度有较大程度的提高。
3.4.2 与其他分类方法对比
为了进一步验证Gist纹理特征分类效果并衡量面向对象分类优势,本研究对原始数据及纹理数据进行传统监督分类,分别采用监督分类中3种经典的最大似然分类(maximum likelihood classification,MLC)、马氏距离分类(mahalanobis distance classification,MDC)、SVM分类方法,并将分类结果与面向对象分类结果进行对比。结果如表5所示。

表5 面向对象分类与监督分类精度对比
从表5可以看出,3种监督分类中,SVM方法具有最高的分类精度,原始数据和纹理数据SVM分类OA分别为76%和78.67%,其中原始数据SVM分类OA比MLC与MDC分类高2.33和1.99个百分点,纹理数据SVM分类OA分别比MLC与MDC分类高3.67和2个百分点。对于3种监督分类方法来说,纹理特征使分类总精度均有了一定程度的提高,SVM提高幅度最为明显。
面向对象分类与监督分类相比,无论是原始数据还是纹理数据,面向对象分类精度均高于监督分类精度。基于Gist纹理的面向对象SVM分类比基于Gist纹理的MLC分类OA高10.67个百分点。加入Gist纹理特征后,面向对象分类精度提高最为明显,其中面向对象SVM分类方法对纹理特征更为敏感。
为了更清晰的对比面向对象与监督分类结果,截取典型区域(图3a),采用目视解译的方法绘制典型区土地利用分类图(图3b),以此为参照,对监督分类中精度较高的SVM以及面向对象SVM分类进行对比。原始数据监督SVM分类的耕地、草地、居民地、水体、未利用地与道路交通用地错分严重;图3d中居民地、水体识别效果较好,但是耕地、草地与道路交通用地错分严重;从图3e可以看出,耕地、草地、水体识别效果好于图3c、3d,且道路交通用地能够较明显的提取出来,但是部分未利用地与居民区、道路交通用地发生混淆,部分耕地、林地与道路交通用地发生混淆;图3f为基于Gist纹理特征的面向对象SVM分类,从分类结果可以看出,水体与道路交通用地分类效果相比于图3c、3d和3e有所提高,林地错分减少,未利用地与居民地、道路交通用地区分也更细致。
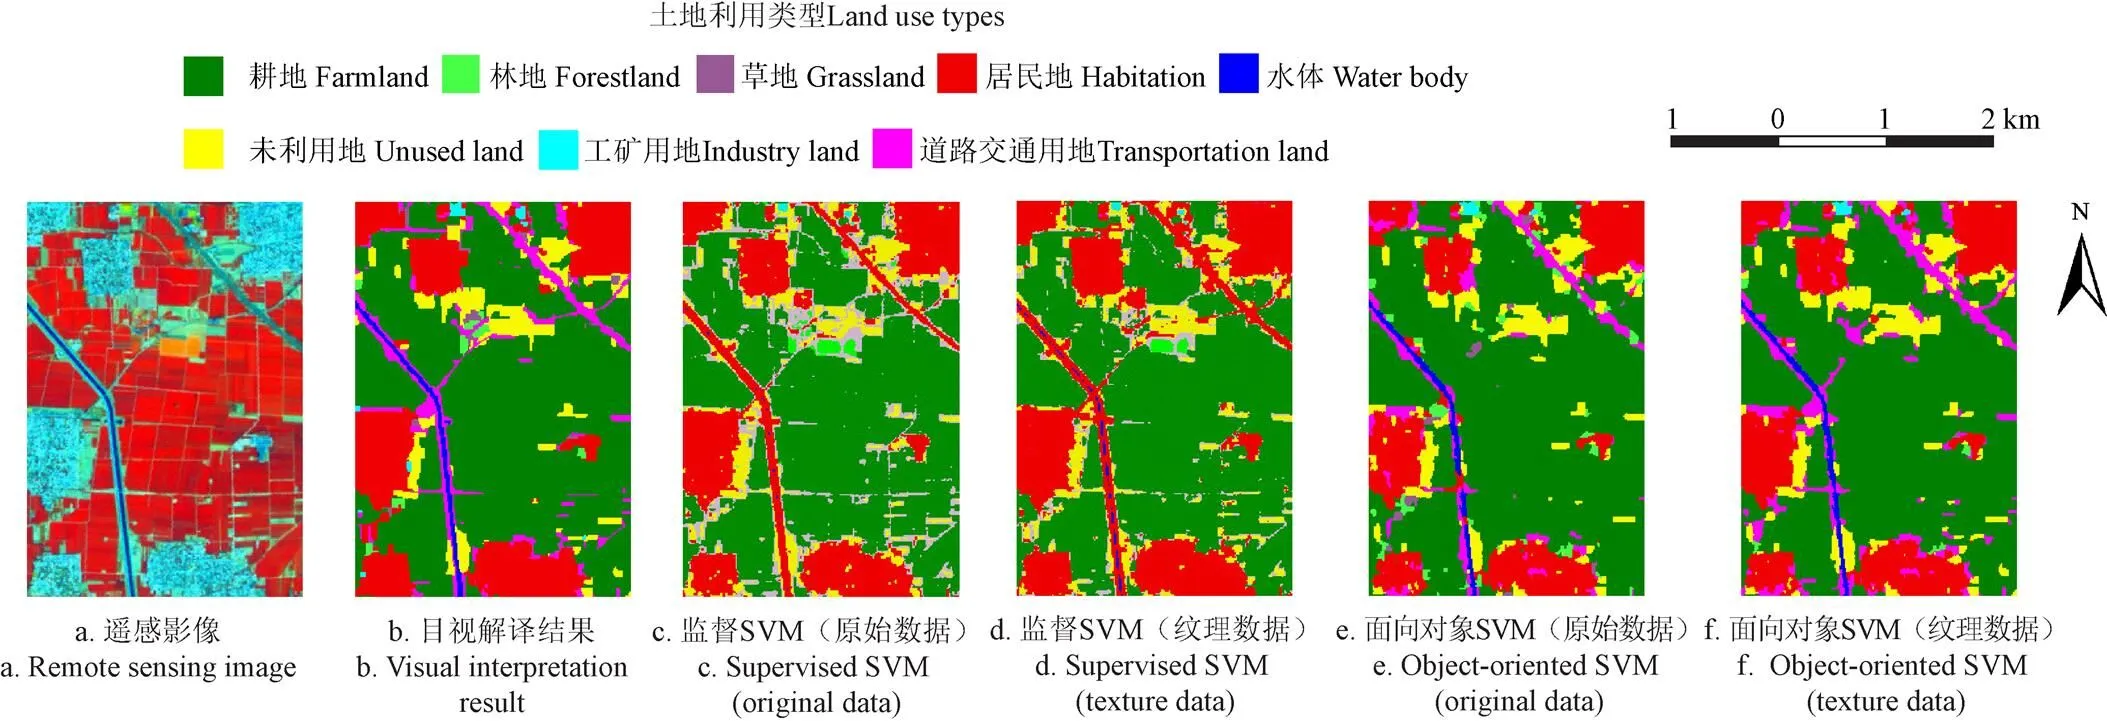
图3 面向对象分类与监督分类对比
4 结 论
本研究以石家庄2016年Landsat 8 OLI遥感影像为研究对象,对面向对象分类过程中纹理特征的提取、纹理特征的选择、面向对象分割尺度进行了分析和研究,实现了基于纹理特征的面向对象土地利用/覆盖信息提取。
1)将广泛运用于场景分类的Gist特征引入遥感分类中,并对基于GLCM的8种纹理特征与Gabor滤波器下的Gist纹理特征进行对比,发现Gist纹理特征所含信息量高于GLCM纹理特征,更适用于Landsat 8 OLI数据分类。Gist特征应用于面向对象分类中得到了较高分类精度,分类总精度达到85.67%。
2)在面向对象分类分割尺度的研究中,本文提出了“面积对象数比”方法计算整体最优分割尺度,取得较好分类效果。
3)面向对象分类与传统监督分类对比表明,无论是原始数据还是纹理数据,面向对象分类精度均高于基于像元的监督分类。对于中分辨率Landsat 8 OLI遥感数据,面向对象分类方法也具有同样的适用性,且面向对象分类方法对纹理数据更为敏感。
[1] 蔡国雷,杨鸿波,邹谋炎. 利用总变分最小化方法的无监督纹理图像分割[J]. 中国图象图形学报,2005,10(4):489-493.
Cai Guolei, Yang Hongbo, Zou Mouyan. Unsupervised texture segmentation using total variation minimization[J]. Journal of Image and Graphics, 2005, 10(4): 489-493. (in Chinese with English abstract)
[2] 张超,金虹杉,刘哲,等. 基于 GF 遥感数据纹理分析识别制种玉米[J]. 农业工程学报,2016,32(21):183-188.
Zhang Chao, Jin Hongshan, Liu Zhe, et al. Seed maize identification based on texture analysis of GF remote sensing data[J]. Transactions of the Chinese Society of Agricultural Engineering (Transactions of the CSAE), 2016, 32(21): 183-188. (in Chinese with English abstract)
[3] 胡玉福,邓良基,匡先辉,等. 基于纹理特征的高分辨率遥感图像土地利用分类研究[J]. 地理与地理信息科学,2011,27(5):42-45.
Hu Yufu, Deng Liangji,Kuang Xianhui, et al.Study on land use classification of high resolution remote sensing image based ontexture feature[J]. Geography and Geo-Information Science, 2011, 27(5): 42-45. (in Chinese with English abstract)
[4] 曹晶晶,王一鸣,毛文华,等. 基于纹理和位置特征的麦田杂草识别方法[J]. 农业机械学报,2007,38(4):107-110.
Chao Jingjing, Wang Yiming, Mao Wenhua, et al. Weed detection method in wheat field based on texture and position features[J]. Transactions of the Chinese Society for Agricultural Machinery, 2007, 38(4): 107-110. (in Chinese with English abstract)
[5] 游炯,裴志远,王飞,等. 基于改进多元纹理信息模型和GF-1影像的县域冬小麦面积提取[J]. 农业工程学报,2016,32(13):131-139.
You Jiong, Pei Zhiyuan, Wang Fei, et al. Area extraction of winter wheat at county scale based on modified multivariate texture and GF-1 satellite images[J]. Transactions of the Chinese Society of Agricultural Engineering (Transactions of the CSAE), 2016, 32(13): 131-139. (in Chinese with English abstract)
[6] 刘丽,匡纲要. 图像纹理特征提取方法综述[J]. 中国图像图形学报,2009,14(4):622-634.
Liu Li, Kuang Gangyao. Overview of image textural feature extraction methods[J]. Journal of Image and Graphics, 2009, 14(4): 622-634. (in Chinese with English abstract)
[7] 田有文,程怡,王小奇,等. 基于高光谱成像的苹果虫害检测特征向量的选取[J]. 农业工程学报,2014,30(12):132-139.
Tian Youwen, Cheng Yi, Wang Xiaoqi, et al. Feature vectors determination for pest detection on apples based on hyperspectral imaging[J]. Transactions of the Chinese Society of Agricultural Engineering (Transactions of the CSAE), 2014, 30(12): 132-139. (in Chinese with English abstract)
[8] 李粉玲,常庆瑞,刘佳岐,等. 基于多纹理和支持向量机的ZY-1 02C星HR数据分类[J]. 武汉大学学报:信息科学版,2016,41(4):455-461.
Li Fenling, Chang Qingrui, Liu Jiaqi, et al. SVM classification with multi-texture data of ZY-1 02C HR image [J]. Geomatics and Information Science of Wuhan University, 2016, 41(4): 455-461. (in Chinese with English abstract)
[9] 金瑞,李小昱,颜伊芸,等. 基于高光谱图像和光谱信息融合的马铃薯多指标检测方法[J]. 农业工程学报,2015,31(16):258-263.
Jin Rui, Li Xiaoyu, Yan Yiyun, et al. Detection method of multi-target recognition of potato based on fusion of hyperspectral imaging and spectral information[J]. Transactions of the Chinese Society of Agricultural Engineering (Transactions of the CSAE), 2015, 31(16): 258-263. (in Chinese with English abstract)
[10] 宋荣杰,宁纪锋,刘秀英,等. 基于纹理特征和SVM的QuickBird影像苹果园提取[J]. 农业机械学报,2017,48(3):188-197.
Song Rongjie, Ning Jifeng, Liu Xiuying, et al. Apple orchard extraction with QuickBird imagery based on texture features and support vector machine[J]. Transactions of the Chinese Society for Agricultural Machinery, 2017, 48(3): 188-197. (in Chinese with English abstract)
[11] Rorat M, Zeevi Y. Localized texture processing in vision: Analysis and synthesis in the Gaborian space[J]. IEEE Transactions on Biomedical Engineering, 1989, 36(1): 115-129.
[12] 刘静,郭建,贺遵亮. 基于Gist和PHOG特征的场景分类[J]. 计算机工程,2015,41(4):232-235.
Liu Jing, Guo Jian, He Zunliang. Scene classification based on Gist and PHOG feature[J]. Computer Engineering, 2015, 41(4): 232-235. (in Chinese with English abstract)
[13] Siagian C, Itti L. Rapid biologically-inspired scene classification using features shared with visual attention[J]. IEEE Transactions on Pattern Analysis & Machine Intelligence, 2007, 29(2): 300-312.
[14] 仲波,马鹏,聂爱华,等. 基于时间序列HJ-1/CCD数据的土地覆盖分类方法[J]. 中国科学:地球科学,2014,44(5):967-977.
Zhong Bo, Ma Peng, Nie Aihua, et al. Land cover mapping using time series HJ-1/CCD data[J]. Science China: Earth Sciences, 2014, 44(5): 967-977. (in Chinese with English abstract)
[15] 杨浩,黄文江,王纪华,等. 基于HJ-1A/1B CCD时间序列影像的水稻生育期监测[J]. 农业工程学报,2011,27(4):219-224.
Yang Hao, Huang Wenjiang, Wang Jihua, et al. Monitoring rice growth stages based on time series HJ-1A/1B CCD images[J]. Transactions of the Chinese Society of Agricultural Engineering (Transactions of the CSAE), 2011, 27(4): 219-224. (in Chinese with English abstract)
[16] Laliberte A S, Rango A, Havstad K M, et al. Object-oriented image analysis for mapping shrub encroachment from 1937 to 2003 in southern New Mexico[J]. Remote Sensing of Environment, 2004, 93(1/2): 198-210.
[17] 吴健生,刘建政,黄秀兰,等. 基于面向对象分类的土地整理区农田灌排系统自动化识别[J]. 农业工程学报,2012,28(8):25-31.
Wu Jiansheng, Liu Jianzheng, Huang Xiulan, et al. Automatic identification of irrigation and drainage system in land reclamation area based on object-oriented classification[J]. Transactions of the Chinese Society of Agricultural Engineering (Transactions of the CSAE), 2012, 28(8): 25-31. (in Chinese with English abstract)
[18] 于欢,张树清,孔博,等. 面向对象遥感影像分类的最优分割尺度选择研究[J]. 中国图象图形学报,2010,15(2):352-360.
Yu Huan, Zhang Shuqing, Kong Bo, et al. Optimal segmentation scale selection for object-oriented remote sensing image classification[J]. Journal of Image and Graphics, 2010, 15(2): 352-360. (in Chinese with English abstract)
[19] Mountrakis G, Im J, Ogole C. Support vector machines in remote sensing: A review[J]. Isprs Journal of Photogrammetry & Remote Sensing, 2011, 66(3): 247-259.
[20] Omer G, Mutanga O, Abdel-Rahman E M, et al. Performance of support vector machines and artificial neural network for mapping endangered tree species using WorldView-2 data in Dukuduku forest, South Africa[J]. IEEE Journal of Selected Topics in Applied Earth Observations & Remote Sensing, 2015, 8(10): 4825-4840.
[21] Dihkan M, Guneroglu N, Karsli F, et al. Remote sensing of tea plantations using an SVM classifier and pattern-based accuracy assessment technique[J]. International Journal of Remote Sensing, 2013, 34(23): 8549-8565.
[22] 张涛,刘军,杨可明,等. 结合Gram-Schmidt变换的高光谱影像谐波分析融合算法[J]. 测绘学报,2015,44(9):1042-1047.
Zhang Tao, Liu Jun, Yang Keming, et al. Fusion algorithm for hyperspectral remote sensing image combined with Harmonic analysis and gram-schmidt transform[J]. Acta Geodaetica et Cartographica Sinica, 2015, 44(9):1042-1047. (in Chinese with English abstract)
[23] Hirsch J. The utility of texture analysis to improve per-pixel classification for high to very high spatial resolution imagery[J]. International Journal of Remote Sensing, 2005, 26(4): 733-745.
[24] Regniers O, Bombrun L, Lafon V, et al. Supervised classification of very high resolution optical images using wavelet-based textural features[J]. IEEE Transactions on Geoscience & Remote Sensing, 2016, 54(6): 3722-3735.
[25] Haralick R M, Shanmugam K, Dinstein I. Textural features for image classification[J]. Systems Man & Cybernetics IEEE Transactions on, 1973, smc-3(6):610-621.
[26] Townshend J R G, Justice C O, Kalb V. Characterization and classification of south american land cover types using satellite data[J]. International Journal of Remote Sensing, 1987, 8(8): 1189-1207.
[27] 谭玉敏,夏玮. 基于最佳波段组合的高光谱遥感影像分类[J]. 测绘与空间地理信息,2014(4):19-22.
Tan Yumin, Xia Wei. Optimum band combination based hyperspectral remote sensing image classification[J]. Geomatics&Spatial Information Technology, 2014(4): 19-22. (in Chinese with English abstract)
[28] 赵庆展,刘伟,尹小君,等. 基于无人机多光谱影像特征的最佳波段组合研究[J]. 农业机械学报,2016,47(3):242-248.
Zhao Qingzhan, Liu Wei, Yin Xiaojun, et al.Selection of optimum bands combination based on multispectral images of UAV[J]. Transactions of the Chinese Society for Agricultural Machinery, 2016, 47(3): 242-248. (in Chinese with English abstract)
[29] 胡文亮,赵萍,董张玉. 一种改进的遥感影像面向对象最优分割尺度计算模型[J]. 地理与地理信息科学,2010,26(6):15-18.
Hu Wenliang, Zhao Ping, Dong Zhangyu. An improved calculation model of object-oriented for the optimal segmentation-scale of remote sensing image[J]. Geography and Geo-Information Science, 2010, 26(6): 15-18. (in Chinese with English abstract)
[30] 王荣,李静,王亚琴. 面向对象最优分割尺度的选择及评价[J]. 测绘科学,2015,40(11):105-111.
Wang Rong, Li Jing, Wang Yaqin. Selection and evaluation of segmentation scale with of object-oriented method[J]. Science of Surveying and Mapping, 2015, 40(11): 155-111. (in Chinese with English abstract)
Object-oriented land use/cover classification based on texture features of Landsat 8 OLI image
Pei Huan1,2,3, Sun Tianjiao1, Wang Xiaoyan1,2,3
(1.066004,; 2.066004,; 3.066004,)
Remote sensing image classification is the main approach for rapidly obtaining regional land use/cover information and it has always been an important part in the field of remote sensing. How to improve the classification accuracy of remote sensing images is an urgent problem to be solved in remote sensing research. In traditional classification, only the spectral features of remote sensing image are used, while the texture and other features are ignored. Therefore, it is very common to see the object confusion in the classification result. In this paper, we took the Shijiazhuang Landsat 8 OLI remote sensing image data as the research area, and systematically studied object-oriented classification based on the spatial texture features of remote sensing images. Firstly, Gray Level Co-occurrence Matrix (GLCM) texture features and Gist texture features based on Gabor filter were compared and analyzed. The average J-M distance method was used to evaluate the sample separability and to choose optimal texture features of GLCM. Subsequently, the optimum index factor (OIF) was applied to obtain the best combination of the two texture features. Secondly, the segmentation scale of object-oriented classification was studied in detail, meanwhile, the concept of “the optimal overall segmentation scale” was proposed, which was based on the ratio between maximum area and the number of the objects in classification result. Finally, two object-oriented classification methods, K-Nearest Neighbor (KNN) method and Support Vector Machine (SVM) method, were used to classify the texture data and the original data, and the accuracy of assessment results were compared using three traditional supervised classification methods. The results indicated that the fusion of texture features could improve the accuracy of classification to some extent. The overall classification accuracy based on texture data using object-oriented SVM and object-oriented KNN increased by 3.67 and 3.33 percentage points, respectively, compared with the results based on original data. Object-oriented SVM method based on texture data had the highest classification accuracy with overall classification accuracy of 85.67%, and with Kappa index of 0.81. Although the classification accuracy of the texture-based supervised classification was improved compared with the supervised classification based on original data, the accuracy was far lower than the value with object-oriented method. For original data, the overall classification accuracy of object-oriented KNN increased by 4.33%, 3.99% and 2.00%, respectively, compared with Maximum Likelihood Classification (MLC), Mahalanobis Distance Classification (MDC) and SVM method. The overall classification accuracy of object-oriented SVM increased by 8.33%, 7.99% and 6.00%, respectively, compared with three supervised methods. After fusing Gist texture features, the overall classification accuracy of object-oriented KNN had increased by 6.33%, 4.66% and 2.66% respectively compared with MLC, MDC and SVM. Whereas the overall classification accuracy of object-oriented SVM increased by 10.67%, 9% and 7.00%, respectively, compared with three supervised methods. Object-oriented SVM method is more sensitive to texture features with the maximum increase of classification accuracy. In future study, more texture features need to be considered to extend the application range of remote sensing classification. In summary, the texture feature has positive effect on improving the accuracy of remote sensing classification, and the application of Gist textures have great potential in object-oriented classification. Moreover, it can also be found that object-oriented method is suitable for classifying medium resolution remote sensing image. The research method in this paper not only gives a valuable reference for other kinds of remote sensing images, but also provides an effective approach for the extraction of regional land use/cover information.
remote sensing; land use; classification; texture features; object-oriented classification; Gist feature; supervised classification
10.11975/j.issn.1002-6819.2018.02.034
TP75
A
1002-6819(2018)-02-0248-08
2017-08-19
2018-01-12
国家自然科学基金项目(U1503184);燕山大学青年教师自主研究计划课题(14LGA011,16LGB010)
裴 欢,甘肃民勤县人,博士,副教授,主要从事生态环境遥感研究。Email:peihuan_ysu@163.com
裴 欢,孙天娇,王晓妍. 基于Landsat 8 OLI影像纹理特征的面向对象土地利用/覆盖分类[J]. 农业工程学报,2018,34(2):248-255. doi:10.11975/j.issn.1002-6819.2018.02.034 http://www.tcsae.org
Pei Huan, Sun Tianjiao, Wang Xiaoyan. Object-oriented land use/cover classification based on texture features of Landsat 8 OLI image[J]. Transactions of the Chinese Society of Agricultural Engineering (Transactions of the CSAE), 2018, 34(2): 248-255. (in Chinese with English abstract) doi:10.11975/j.issn.1002-6819.2018.02.034 http://www.tcsae.org
