基于气象资料的日辐射模型在中国西北地区适用性评价
2018-02-28张青雯崔宁博龚道枝胡笑涛
张青雯,崔宁博,2,冯 禹,贾 悦,李 晨,龚道枝,胡笑涛
基于气象资料的日辐射模型在中国西北地区适用性评价
张青雯1,崔宁博1,2※,冯 禹1,3,贾 悦1,李 晨1,龚道枝3,胡笑涛4
(1. 四川大学水力学与山区河流开发保护国家重点实验室水利水电学院,成都 610065; 2. 南方丘区节水农业研究四川省重点实验室,成都 610066; 3. 中国农业科学院农业环境与可持续发展研究所作物高效用水与抗灾减损国家工程实验室,北京 100081; 4. 西北农林科技大学旱区农业水土工程教育部重点实验室,杨凌 712100)
地表总辐射(R)是作物生长模型率定、蒸散量估算、灌溉制度制定和太阳能资源利用的重要基础数据。为有效提高辐射资源利用率,该文基于中国西北地区10个气象站点1993-2016年气象数据对9种不同日辐射模型进行适用性评价。采用非线性回归分析法对Bristow-Campbell(B-C)模型进行参数属地化修正,得到B-C校正模型。模型适用性评价结果表明:9种模型在西北地区的辐射模拟值和实测值均呈极显著相关(<0.01);基于日照时数的日辐射模型(Ångström-Prescott、Ogelman、Bahel、Louche、Almorox-Hontoria、Glower-McCulloch,其2介于0.875~0.954)计算精度高于基于温度的模型(Hargreaves-Samani、Annandale、Bristow-Campbell,其2介于0.652~0.813);其中基于日照时数的模型中Bahel模型精度最高,其次是Ogelman和Glower-McCulloch模型,其RMSE分别为2.282、2.309和2.313 MJ/(m2·d),RMSE分别为14.0%、14.2%和14.2%,MAE分别为1.666、1.701和1.697 MJ/(m2·d),Nash-Sutcliffe系数(NS)分别为0.905、0.903和0.902;基于温度的日辐射模型中B-C校正模型精度最高,其RMSE为3.819 MJ/(m2·d),RMSE为23.3%,MAE为2.680 MJ/(m2·d),NS为0.741。因此,西北地区日辐射计算当仅有日照时数资料时推荐使用Bahel模型,当仅有温度资料时推荐使用Bristow-Campbell校正模型。
太阳辐射;模型;温度;日照时数;西北地区;参数率定
0 引 言
地表总辐射(s)即太阳辐射是地球表面最终能量来源,到达地球表面的太阳辐射是地球大气系统能量收支的最重要参数之一[1-2]。太阳辐射量的变化与水文循环、陆地生态系统和气候变化密切相关[3],准确估算s对蒸散量估算、灌溉制度制定、作物产量预报、太阳能资源开发利用及气候变化等领域都具有重要的科学价值和现实意义[4-8]。此外,精确预测s对无电力供给区域发展太阳能光伏提水灌溉及光伏设施农业系统也具有重要意义,尤其针对缺乏观测站和气象站导致无辐射观测区域太阳能资源开发利用极为重要。同时,由于全球能源需求的快速增长和化石燃料对环境的破坏性影响,光伏清洁能源开发技术对可靠的s数据的需求不断增长[9-10]。然而,由于技术设备和维护成本较高,s观测受到极大的限制,尤其是在发展中国家,其数据并不像常规日照时数、温度等气象数据容易获取[11]。目前中国建有752个国家气象站点,能观测太阳辐射量的仅有122个,有观测条件的s数据在时间序列上也并不完整,普遍存在数据缺失现象[12-14]。
为此,多种s估算方法被相继提出,如卫星图像、机器学习、随机天气模型和经验模型等方法[15]。其中,基于云量、日照、温度等气象数据的经验模型最为常见并被广泛使用,尤其是基于日照时数和基于温度的经验辐射模型[11,15]。最初基于日照时数的模型为Ångström模型[16],采用日照时数和晴空辐射数据计算s。由于晴空辐射数据较难获取,Prescott[17]建议使用大气顶层辐射来替代晴空辐射,得到了至今广泛使用的Ångström-Prescott模型。Chelbi等[18]将几种Ångström型回归模型(线性、二次、三次、对数和指数模型)进行比较,估算突尼斯4个气象站的s,发现拟合模型均能准确估算s,其中三次Ångström模型拟合精度最高。Bahel[19]以全球不同气候条件和地理位置的48个站点的日照时数和辐射数据为基础,提出了在全球范围内均适用的Bahel模型。Ogelman等[20]建立了基于日照时数与最大可能日照时数之比的二阶多项式函数来估算日辐射值。虽然基于日照时数的模型估算s较为准确,但通常会受到日照资料缺失的限制[21],因此,基于温度的经验模型得以发展,较为典型的是Hargreaves-Samani (H-S) 模型,仅需日最高、最低温度就能准确估算s[22]。Annandale等[23]考虑海拔和大气层厚度对辐射的影响进而对H-S模型进行了改进。Bristow等[24]提出以温度指数函数估算日s值,即Bristow-Campbell(B-C)模型。Liu等[5]评估了16种基于温度的经验辐射模型在中国东北、华北平原和西北地区的适用性,发现B-C模型与修正H-S模型计算精度相似,且显著优于H-S模型。Hassan等[15]建立了17个新的基于温度的辐射模型,并将其与已有的3种模型(Annandale、Allen和Goodin模型)进行比较以估算埃及日s,发现精度最高的新模型在埃及不同地区计算精度均高于原模型,尤其在沿海地区。向友珍等[14]以中国南方20个站点气象资料为基础,对B-C模型及H-S模型各6种不同形式进行了参数率定,并与支持向量机15种参数输入形式进行了适用性评价,发现支持向量机模型整体好于B-C模型和H-S模型。Chen等[25]基于中国48个站点的气象数据对2种基于日照时数的辐射模型和3种基于温度的辐射模型进行适用性评价,发现基于日照时数的模型精度高于基于温度的模型,且Bahel模型计算精度最高。
中国西北地区生态环境脆弱,经济发展较为落后,但辐射资源十分丰富,充分利用辐射资源对西北地区农业生产效率提升、生态环境改善及地方经济发展具有重要现实意义。目前关于中国西北地区辐射模型适用性评价还未见报道,因此,本文基于西北地区10个气象站点1993-2016年逐日气象数据对9种不同日辐射模型进行适用性评价,探寻适宜西北地区的R估算方法,以期为西北地区s的准确预测提供理论基础和技术支持。
1 材料与方法
1.1 研究区域与数据
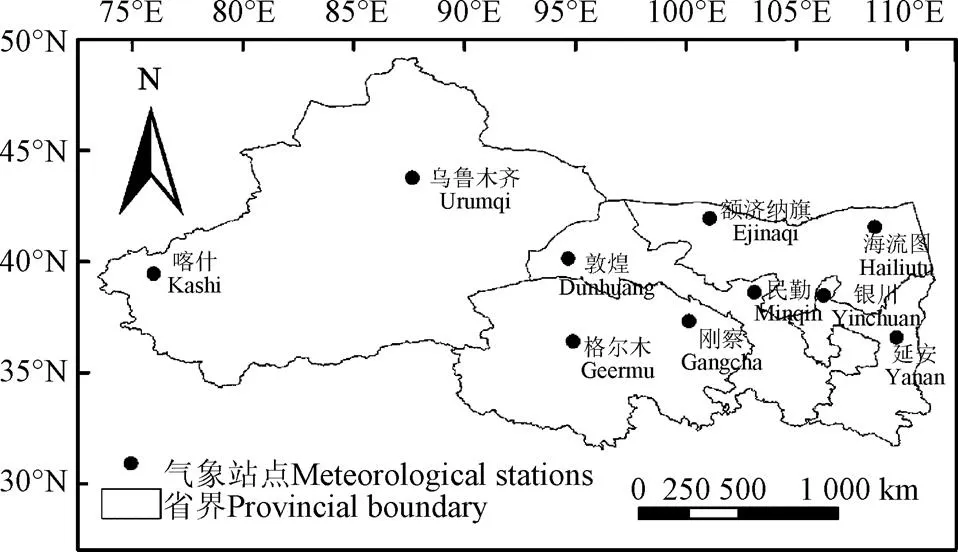
中国西北地区位于73°25′~110°55′E和31°35′~49°15′N,主要包括陕西、甘肃、青海、宁夏、新疆和内蒙西部(图1),约为中国国土面积1/3[26]。西北地区地形复杂多样,以高原、盆地和山地为主,太阳辐射资源十分丰富,由于该区地处亚欧大陆腹部,并有山岭阻隔、地形闭塞,海洋水汽难以到达,除秦岭以南地区外大部分地区全年降水量多在500 mm以下,且呈由东向西递减态势,是中国主要的干旱和半干旱区,也是中国气候变化的敏感区和生态脆弱区[27-28]。基于对站点所处气候区域代表性与气象数据完整性的考虑,本文在西北地区共选取10个代表性站点1993-2016年24 a逐日气象数据作为基本资料,各气象站点概况见表1。气象数据来源于中国气象科学数据共享服务网(http://data.cma.cn/),包括日总辐射量(MJ/(m2·d))、日最高气温(℃)、日最低气温(℃)、日照时数(h),对其中缺测数据(占全部数据的4.8%)采用线性内插法和多年平均值法补全。

图1 中国西北地区气象站点分布图

表1 中国西北地区10个气象站点概况
注:数据起止年份为1993-2016年,日最高温度、日最低温度、日照时数及日总辐射均为24 a平均值。
Note: Data from 1993 to 2016. Daily maximum temperature, daily minimum temperature, sunshine duration and daily solar radiation are the average of the 24 years.
1.2 经验辐射模型
本文选取共9种具有代表性的经验日辐射模型,其中包括6种基于日照时数的经验模型(A-P、OG、BA、LO、A-H、G-M)和3种基于温度的经验模型(H-S、AN、B-C),如表2所示。基于温度的B-C模型虽为经验模型,但其参数具有一定的物理意义,参数为晴空a衰减比例系数,参数和则为晴空a衰减幅度调整系数,B-C模型推荐参数取值为0.7,参数取值为0.004~0.010之间,参数取值2.4[29]。为确定B-C模型参数取值,提高其在中国西北地区辐射计算精度,本文基于各代表性站点1993-2010年气象数据并采用非线性回归分析法对B-C模型进行参数属地化修正,通过2011-2016年数据对其进行验证得B-C校正模型。

表2 经验辐射模型
注:s为地表总辐射,MJ·m-2·d-1;为实际日照时数,h;为最大可能日照时数,h;为纬度,rad;为高程,km;max为日最高温度,℃;min为日最低温度,℃;a为地外总辐射,MJ·m-2·d-1;G为太阳常数,取0.082(MJ·m-2·min-1);d为日地间相对距离的倒数;ω为太阳时角(rad);为太阳磁偏角(rad);
Note:sis the daily global solar radiation, MJ·m-2·d-1;is the sunshine duration, h;is the maximum possible daily sunshine duration, h;is the latitude, rad;is the altitude, km;maxis the maximum daily temperature, ℃;minis the minimum daily temperature, ℃;ais the daily extraterrestrial radiation on horizontal surface, MJ·m-2·d-1.Gis the solar constant,G=0.082 (MJ·m-2·min-1);dis the countdown of relative distance between sun and earth;ωis the sunset hour angle (rad);is the solar declination angle (rad).
1.3 评价方法
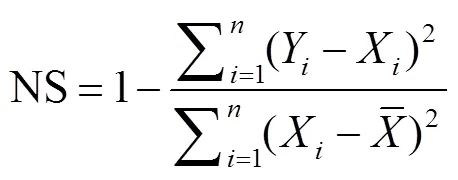
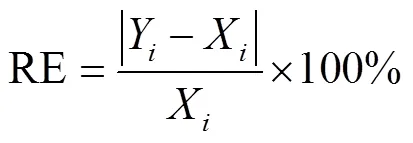
本文采用辐射模型常用的5个评价指标:决定系数(2)、均方根误差(RMSE)、归一化均方根误差(nRMSE)、平均绝对误差(MAE)、Nash-Sutcliffe系数(NS)和相对误差(Relative error,RE)评价各模型的计算精度与一致性,其计算公式如下


2 结果与分析
2.1 Bristow-Campbell模型参数率定
本文基于西北地区各1993—2010年各代表性站点气象资料,采用非线性回归分析法(最小二乘法)对B-C模型进行参数属地化修正,通过2011—2016年数据对其进行验证,最终提出B-C校正模型在西北地区各代表性站点的参数值,结果见表3。由表3可知,率定后B-C模型参数值介于0.627~0.793之间,其平均值为0.734,除乌鲁木齐、延安站外均大于原模型推荐值0.7,表明晴空a衰减比例系数较原始值偏大;率定后参数值介于0.018~0.072之间,其平均值为0.040,均大于原模型推荐最大值0.010,表明晴空a衰减幅度调整系数较原始值偏大;率定后参数值介于1.150~1.804之间,其平均值为1.525,均小于原模型推荐值2.4,表明晴空a衰减幅度调整系数较原始值偏小。此外,B-C模型修正后参数值在各代表站点均不相同,表明不同区域因受季节变化、云层厚度、积雪覆盖、污染物浓度、纬度及海拔等影响,模型参数在不同地区取值不一[11,31]。

表3 中国西北地区Bristow-Campbell修正模型参数值率定情况
2.2 模型适用性比较
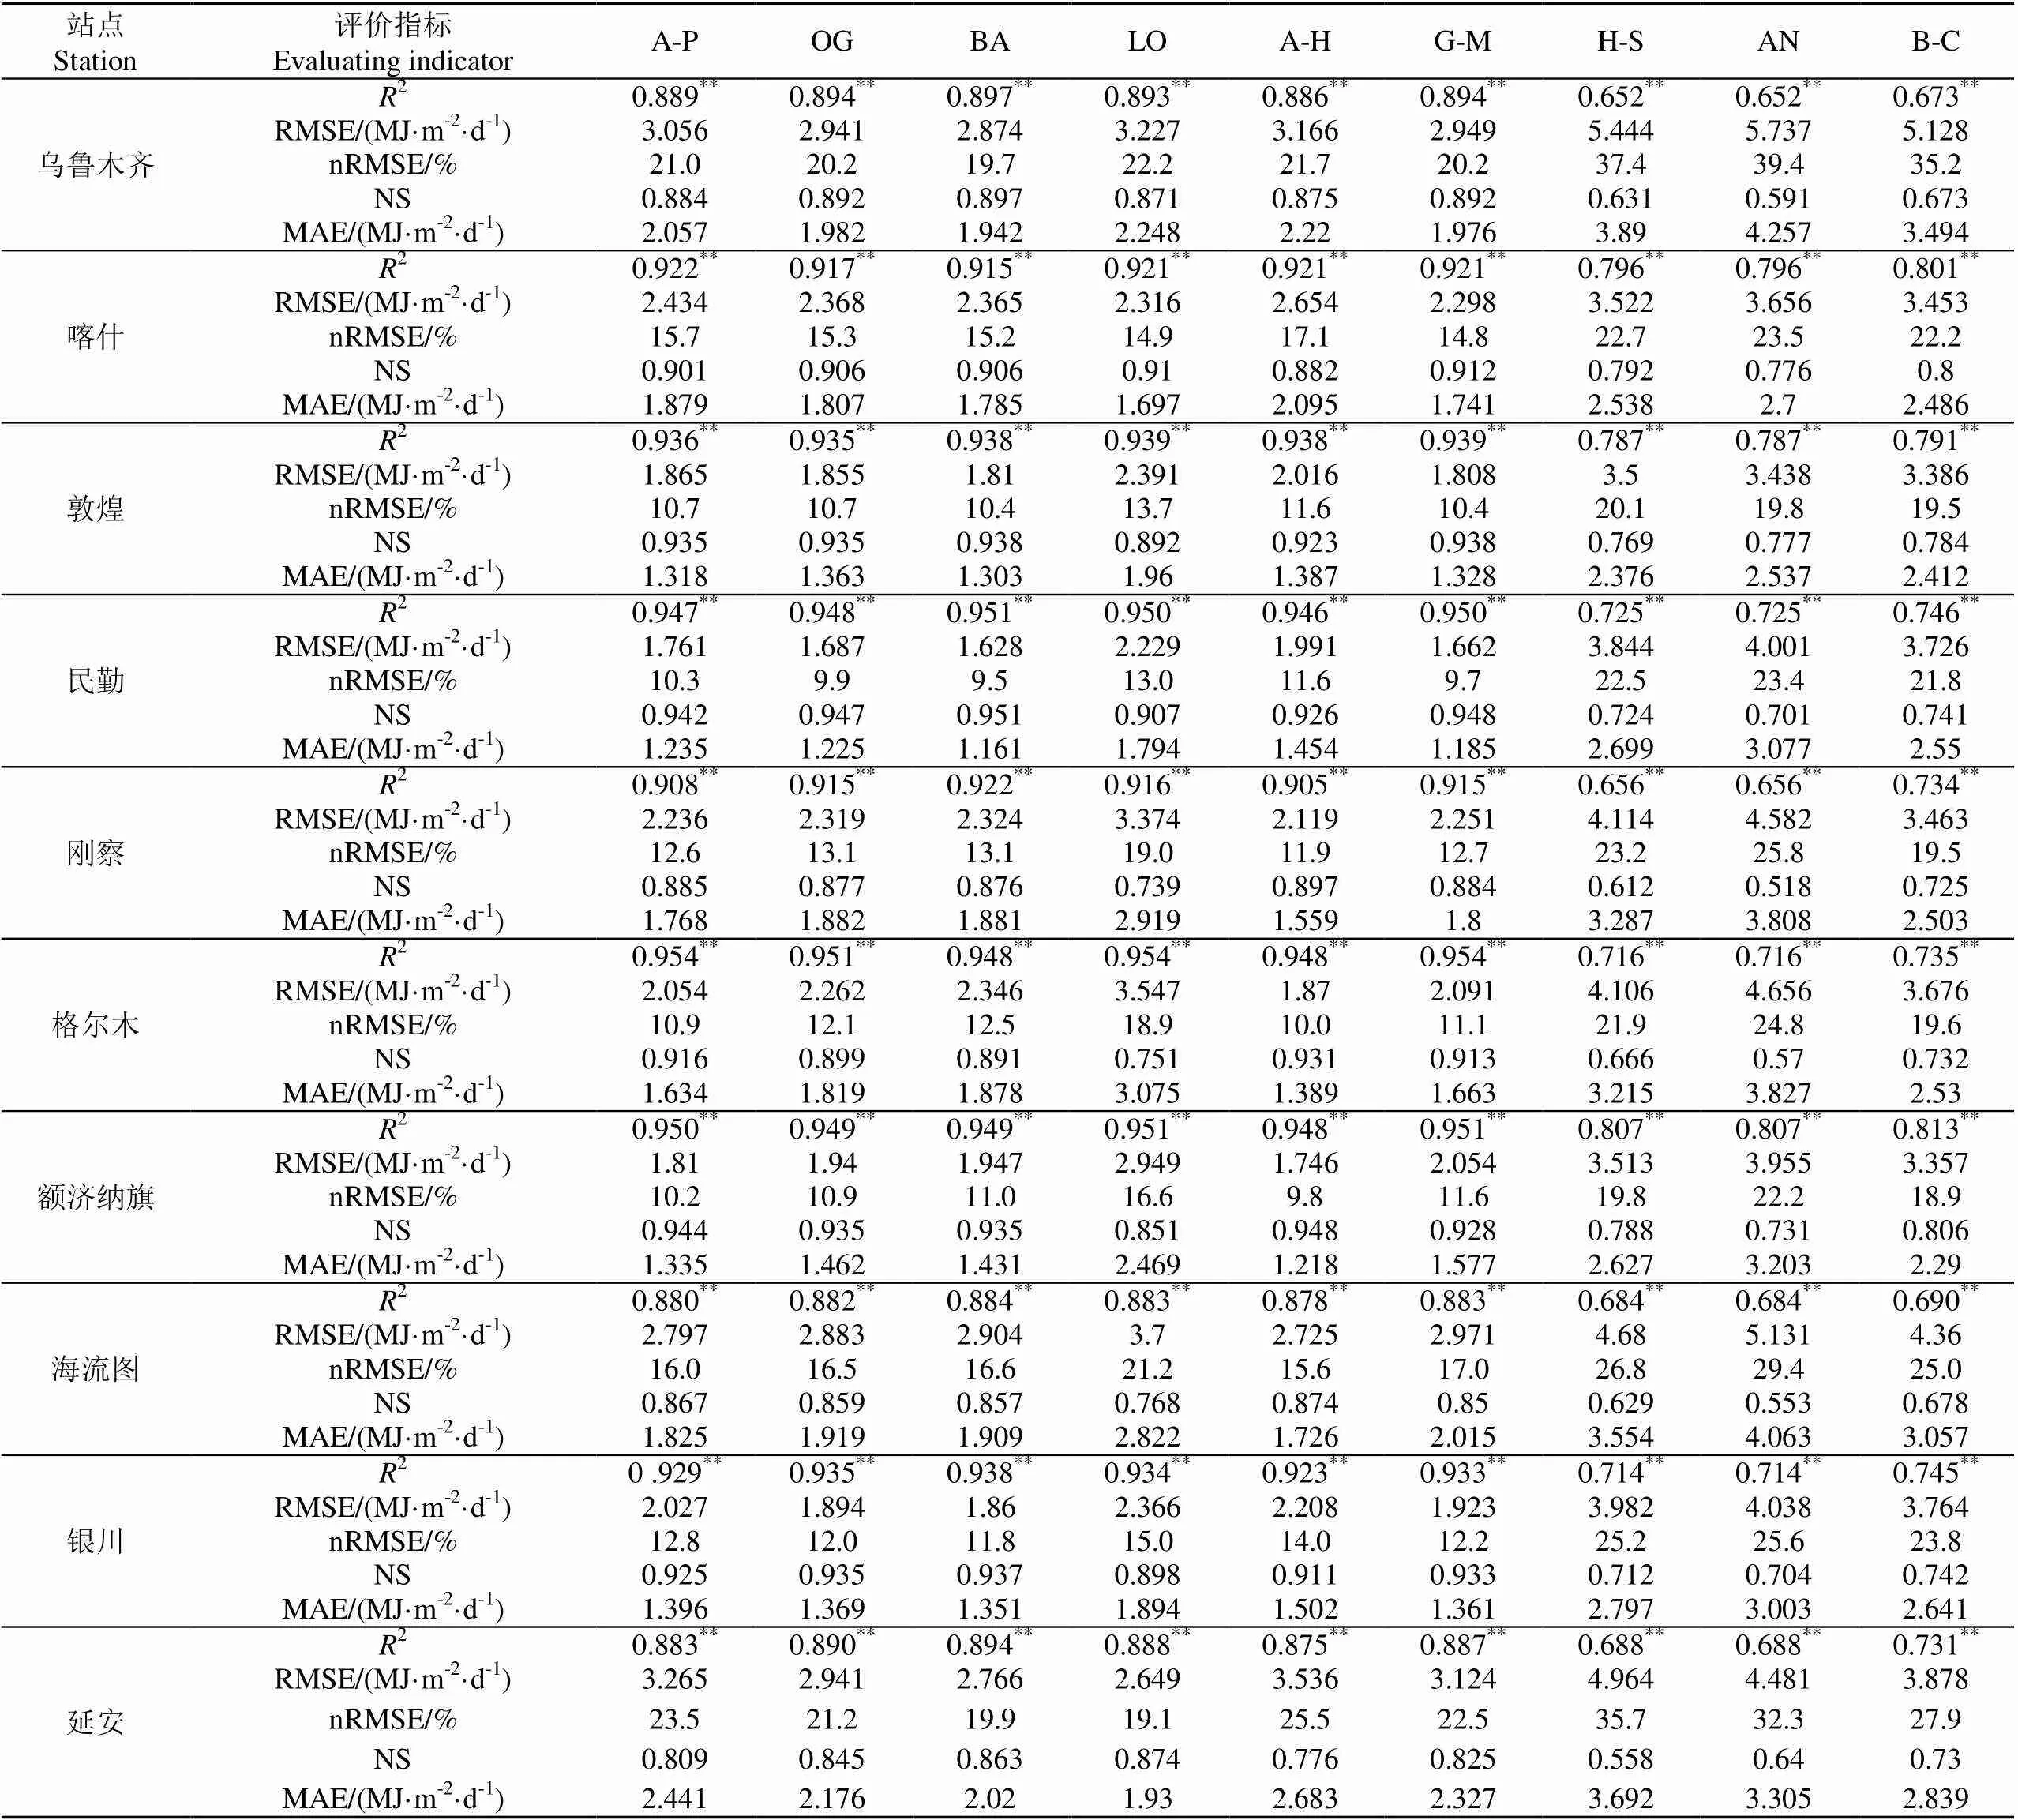
为评价各模型对西北地区日s模拟精度,将9种模型在西北地区10个代表性站点的模拟值和实测值进行统计分析,如表4所示。由表4可知,9种模型在西北地区10个代表性站点s模拟值与实测值拟合结果较好,均呈极显著相关(<0.01)。6种基于日照时数的辐射模型(A-P、OG、BA、LO、A-H和G-M)2分别介于0.880~0.954、0.882~0.951、0.884~0.951、0.883~0.954、0.875~0.948和0.883~0.954;3种基于温度的辐射模型(H-S、AN和B-C)2分别介于0.652~0.807、0.652~0.807和0.673~0.813;6种基于日照时数的辐射模型在西北地区各站点日s值拟合精度较高,除乌鲁木齐、延安、海流图3个站外,2均大于0.9,且6种模型在格尔木、额济纳旗、民勤站拟合结果均优于其它站,其2均大于0.946。3种基于温度的辐射模型在西北地区各站点s模拟精度均低于基于日照时数的辐射模型,除额济纳旗站外,2均小于0.8,3种模型在乌鲁木齐、刚察、海流图站精度均较差,其2均小于0.734。此外,从其余4个误差统计指标也可看出基于日照时数的辐射模型计算精度均高于基于温度的模型,基于日照时数的模型中BA模型精度最高,其次是OG模型和G-M模型,其平均RMSE分别为2.282、2.309和2.313 MJ/(m2·d),平均nRMSE分别为14.0%、14.2%和14.2%,平均NS分别为0.905、0.903和0.902,平均MAE分别为1.666、1.701和1.697 MJ/(m2·d);基于温度的模型中精度最高的是B-C校正模型,其次是H-S模型和AN模型,其平均RMSE分别为3.819、4.167和4.368 MJ/(m2·d),平均nRMSE分别为23.3%、25.5%和26.6%,平均NS分别为0.741、0.688和0.656,平均MAE分别为2.680、3.068和3.378 MJ/(m2·d)。

表4 中国西北地区不同经验辐射模型计算精度比较
注:表中**表示相关性达极显著水平(<0.01)。
Note:**means a statistically significant correlation (<0.01).
为分析各模型对西北地区月尺度日s模拟精度,将各经验模型的s模拟值与实测值求月平均值(喀什、敦煌站结果如表5所示,其余站点结果与之相似),并计算各模型在不同站点s模拟值的相对误差,结果见表6。表5表明,西北地区9种经验模型月尺度上s模拟值与实测值的年内变化趋势基本相同,1-6月均呈增大趋势,7-12月均呈减小趋势,夏季s较大,冬季s较小。由表6可知,9种模型在西北地区各代表性站点月尺度上计算精度差异明显,但绝大多数相对误差小于15%。6种基于日照时数的经验模型(A-P、OG、BA、LO、A-H和G-M)在西北地区10个代表性站点月尺度上s模拟值的相对误差RE范围分别为1.690%~15.385%、0.741%~12.275%、0.809%~10.305%、3.349%~15.634%、1.770%~17.917%和1.233%~14.245%,平均RE分别为5.709%、5.375%、5.350%、9.703%、6.532%和5.679%,表明基于日照时数的模型中BA模型模拟精度最高,其次是OG模型和G-M模型;3种基于温度的经验模型(H-S、AN和B-C)在各站月尺度上s模拟值的RE范围分别为3.652%~18.713%、4.971%~17.748%和2.863%~6.525%,平均RE分别为8.184%、10.636%和4.254%,表明基于温度的模型中B-C校正模型精度最高,且其误差小于BA模型。同时,由于西北地区面积广阔,地形复杂、气候差异显著等因素,各代表性站点月尺度上s模拟精度最高的模型也不同,在敦煌、民勤和银川站精度最高的均为OG模型,在刚察、额济纳旗和海流图站精度最高的均为A-H模型,在喀什和延安站精度最高的均为LO模型,而在乌鲁木齐和格尔木站精度最高的分别为G-M模型和BC校正模型。

表5 中国西北地区代表站各模型月平均日辐射值

表6 中国西北地区各经验模型月平均日辐射值的相对误差
注:表中加粗值为各站点相对误差最小值。
Note: bold numbers are the minimum relative error for each station.
3 讨 论
本研究结果表明基于日照时数的辐射模型在西北地区各代表站点计算精度均高于基于温度的辐射模型。Trnka等[35]在奥地利和捷克分析了7种不同的日总辐射计算模型,发现基于日照时数的模型精度最高,其次是基于云资料的辐射模型、基于降水的辐射模型和基于温度的辐射模型。Mecibah等[36]研究了在阿尔及利亚地区月尺度上平均日辐射计算精度较高的模型,结果也表明基于日照时数的模型计算精度高于基于温度的模型。到达地球表面的太阳辐射量与日照时数密切相关,同时,云层及其伴随的天气模式也是限制地球表面太阳辐射的最重要的大气现象之一,这是导致基于日照时数的模型和基于云资料的模型计算精度较高的主要原因。到达地球表面的太阳辐射又以长波辐射的形式被大气层吸收或散发到空中,被大气层吸收的部分则会使大气温度升高,因此温度与太阳辐射密切相关,但又并不完全对应,这也导致了基于温度的辐射模型计算精度要低于基于日照时数的模型。
本文研究发现中国西北地区基于日照时数的模型中BA模型计算精度最高,其次是OG模型和G-M模型;Chelbi等[18]基于突尼斯4个气象站点数据研究发现在几种Ångström型回归模型(线性、二次、三次、对数和指数模型)中,属于三次Ångström型的Bahel模型拟合精度最高,与本文研究结论一致。同时,Chen等[25]比较了5种辐射模型在中国地区的适用性,也发现BA模型在中国是计算精度最高的基于日照时数的辐射模型,且计算精度高于A-P模型,二者平均NS分别为0.84、0.83。
本研究发现中国西北地区基于温度的辐射模型中B-C校正模型精度最高;Quej等[21]评价了13种经验辐射模型在墨西哥尤卡坦半岛地区适用性,发现温度的辐射模型中B-C模型精度最高;Chen等[25]在中国地区研究也发现B-C校正模型计算精度高于H-S模型,其平均NS分别为0.47、0.44,与本研究结论一致。B-C模型是基于气温日较差的经验辐射模型,入射辐射中有部分被大气散射或吸收并未到达地表对气温无影响,同时长波辐射对气温变化也有一定影响,气温日较差与太阳总辐射虽密切相关,但又并未直接对应,因此B-C模型具有一定的不确定性,降低B-C模型不确定性的主要途径则是对其参数进行属地化校正,这也是B-C校正模型精度较高的主要原因[37]。
9个辐射模型在西北地区各代表性站点月尺度上计算精度差异明显,但绝大多数相对误差小于15%,而且在喀什、刚察、敦煌、民勤、额济纳旗、海流图和延安等地还表现出春、冬季节s计算误差相对较大的趋势,这可能是由于当地云量和气溶胶增加所引起。Al-Mostafa等[38]在阿拉伯地区评价了52种基于日照时数的辐射模型,发现在月尺度上,各模型计算相对误差百分比在−10%~10%之间,文本基于日照时数的模型计算结果绝大多数也均小于10%。月尺度上B-C校正模型相对误差较小,主要是在选模型之初对其参数进行率定所导致。西北地区面积广阔,区域内不同的地理气候因素对模型计算精度会造成一定的影响,未来还需对此进行深入研究以期进一步提高模型计算精度。
4 结 论
1)基于西北地区1993-2010年气象数据采用非线性回归分析法(最小二乘法)对B-C模型进行参数属地化修正,并通过2011—2016年数据对其进行验证,最终提出B-C校正模型在西北地区各代表性站点的参数率定值,率定后晴空a衰减比例系数较原始值偏大,晴空a衰减幅度调整系数较原始值偏大,而晴空a衰减幅度调整系数较原始值偏小。
2)9种经验辐射模型在西北地区10个代表性站点日尺度上s模拟值与实测值拟合结果较好,均呈极显著相关(<0.01),且总体上基于日照时数的模型计算精度高于基于温度的模型,其2取值分别介于0.875~0.954和0.652~0.813;9种经验模型中BA模型为精度最高的基于日照时数的模型,其次是OG模型和G-M模型;B-C校正模型为精度最高的基于温度的辐射模型。
3)西北地区9种经验辐射模型月尺度上s模拟值与实测值的年内变化趋势相同,1-6月均呈增大趋势,7-12月均呈减小趋势。9种模型在月尺度上计算精度差异明显,但绝大多数相对误差小于15%。基于日照时数的模型中BA模型月尺度上s模拟精度最高,其次是OG模型和G-M模型;基于温度的模型中B-C校正模型精度最高,且相对误差小于BA模型。
4)综合考虑西北地区9种辐射模型在日尺度和月尺度上s模拟精度,当具有日照时数资料时,推荐使用BA模型计算西北地区日总辐射值,当仅有温度资料时推荐使用率定参数后的B-C校正模型。
[1] Almorox J, Bocco M, Willington E. Estimation of daily global solar radiation from measured temperatures at Cañada de Luque, Córdoba, Argentina[J]. Renewable Energy, 2013, 60: 382-387.
[2] 郑祚芳,张秀丽. 北京地区地面太阳辐射长期演变特征[J]. 太阳能学报,2013,34(10):1829-1834.
Zheng Zuofang, Zhang Xiuli. Long-term variation features of global solar radiation in Beijing[J]. Acta Energiae Solaris Sinica, 2013, 34(10): 1829-1834. (in Chinese with English abstract)
[3] Wang L C, Kisi O, Zounemat-Kermani M, et al. Solar radiation prediction using different techniques: Model evaluation and comparison[J]. Renewable and Sustainable Energy Reviews, 2016, 61: 384-397.
[4] Liu X Y, Mei X R, Li Y Z, et al. Variation in reference crop evapotranspiration caused by the Angstrom-Prescott coefficient: Locally calibrated versus the FAO recommended[J]. Agricultural Water Management, 2009, 96: 1137-1145.
[5] Liu X Y, Mei X R, Li Y Z, et al. Evaluation of temperature-based global solar radiation models in China[J]. Agricultural and Forest Meteorology, 2009, 149: 1433-1446.
[6] Li H S, Ma W, Lian Y W, et al. Estimating daily global solar radiation by day of year in China[J]. Applied Energy, 2010, 87: 3011-3017.
[7] 武伟,范莉,李茂芬,等. 不同时间尺度太阳辐射数据对作物生长模型的影响[J]. 农业工程学报,2012,28(3):123-128.
Wu Wei, Fan Li, Li Maofen, et al. Sensitivity analysis of crop growth models to multi-temporal scale solar radiation[J]. Transactions of the Chinese Society of Agricultural Engineering (Transactions of the CSAE), 2012, 28(3): 123-128. (in Chinese with English abstract)
[8] 任鸿瑞,罗毅,谢贤群. 几种常用净辐射计算方法在黄淮海平原应用的评价[J]. 农业工程学报,2006,22(5):140-146.
Ren Hongrui, Luo Yi, Xie Xianqun. Evaluation of application of several net radiation calculation methods in Huanghuaihai Plain[J]. Transactions of the Chinese Society of Agricultural Engineering (Transactions of the CSAE), 2006, 22(5): 140-146. (in Chinese with English abstract)
[9] Feng Y, Cui N B, Zhang Q W, et al. Comparison of artificial intelligence and empirical models for estimation of daily diffuse solar radiation in North China Plain[J]. International journal of hydrogen energy, 2017, 42: 14418-14428.
[10] Belaid S, Mellit A. Prediction of daily and mean monthly global solar radiation using support vector machine in an arid climate[J]. Energy Conversion and Management, 2016, 118: 105-118.
[11] Besharat F, Dehghan A A, Faghih A R. Empirical models for estimating global solar radiation: A review and case study[J]. Renewable and Sustainable Energy Reviews, 2013, 21: 798-821.
[12] Pan T, Wu S H, Dai E F, et al. Estimating the daily global solar radiation spatial distribution from diurnal temperature ranges over the Tibetan Plateau in China[J]. Applied Energy, 2013, 107: 384-393.
[13] 吴立峰,刘惠英,张富仓. 辐射模型不同率定方法总辐射数据缺失插补比较[J]. 农业机械学报,2016,47(10):172-180.
Wu Lifeng, Liu Huiying, Zhang Fucang. Comparison of different calibration methods on Ångström-Prescott model for missing data interpolation[J]. Transactions of the Chinese Society for Agricultural Machinery, 2016, 47(10): 172-180. (in Chinese with English abstract)
[14] 向友珍,吴立峰,张富仓,等. 基于常规气象资料估算南方地区日辐射总量方法比较[J]. 农业机械学报,2016,47(10):181-192.
Xiang Youzhen, Wu Lifeng, Zhang Fucang, et al. Comparison of total radiation estimation methods in south area based on conventional meteorological data[J]. Transactions of the Chinese Society for Agricultural Machinery, 2016, 47(10): 181-192. (in Chinese with English abstract)
[15] Hassan G E, Youssef M E, Mohamed Z E, et al. New temperature-based models for predicting global solar radiation[J]. Applied Energy, 2016, 179: 437-450.
[16] Angstrom A. Solar and terrestrial radiation[J]. Quarterly Journal of Royal Meteorological Society, 1924, 50: 121-125.
[17] Prescott J A. Evaporation from a water surface in relation to solar radiation[J]. Transactions of the Royal Society Science of Australia, 1940, 64: 114-125.
[18] Chelbi M, Gagnon Y, Waewsak J. Solar radiation mapping using sunshine duration-based models and interpolation techniques: Application to Tunisia[J]. Energy Conversion and Management, 2015, 10: 203-215.
[19] Bahel V, Bakhsh H, Srinivasan R. A correlation for estimation of global solar radiation[J]. Energy, 1987, 12: 131-135.
[20] Ogelman H, Ecevit A, Tasdemiroglu E. A new method for estimating solar radiation from bright sunshine data[J]. Solar
Energy, 1984, 33: 619-625.
[21] Quej V H, Almorox J, Ibrakhimov M, et al. Empirical models for estimating daily global solar radiation in Yucatán Peninsula, Mexico[J]. Energy Conversion and Management, 2016, 110: 448-456.
[22] Hargreaves G H, Samani Z A. Estimating potential evapotranspiration[J]. Journal of Irrigation and Drainage Engineering, 1982, 108: 225-230.
[23] Annandale J G, Jovanovic N Z, Benadé N, et al. Software for missing data error analysis of Penman-Monteith reference evapotranspiration[J]. Irrigation Science, 2002, 21: 57-67.
[24] Bristow K L, Campbell G S. On the relationship between incoming solar radiation and daily maximum and minimum temperature[J]. Agricultural and Forest Meteorology, 1984, 31: 159-166.
[25] Chen R S, Kang E, Yang J P, et al. Validation of five global radiation models with measured daily data in China[J]. Energy Conversion and Management, 2004, 45: 1759-1769.
[26] 曹雯,申双和,段春锋. 西北地区生长季参考作物蒸散变化成因的定量分析[J]. 地理学报,2011,66(3):407-415.
Cao Wen, Shen Shuanghe, Duan Chunfeng. Quantification of the causes for reference crop eapotranspiration changes in growing season in Northwest China[J]. Acta Geographica Sinica, 2011, 66(3): 407-415. (in Chinese with English abstract)
[27] 李净,冯姣姣,王卫东,等. 基于LM-BP 神经网络的西北地区太阳辐射时空变化研究[J]. 地理科学,2016,36(5):780-786.
Li Jing, Feng Jiaojiao, Wang Weidong, er al. Spatial and temporal changes in solar radiation of Northwest China based LM-BP neural network[J]. Scientia Geographica Sinica, 2016, 36(5): 780-786. (in Chinese with English abstract)
[28] 段春锋,缪启龙,曹雯. 西北地区参考作物蒸散变化特征及其主要影响因素[J]. 农业工程学报,2011,27(8):77-83.
Duan Chunfeng, Miao Qilong, Cao Wen. Changing characteristics of reference crop evapotranspiration and main causes in the Northwest China[J]. Transactions of the Chinese Society of Agricultural Engineering(Transactions of the CSAE), 2011, 27(8): 77-83. (in Chinese with English abstract)
[29] Meza F, Varasb E. Estimation of mean monthly solar global radiation as a function of temperature[J]. Agricultural and Forest Meteorology, 2000, 100: 231-241.
[30] 李曼曼,梅旭荣,钟秀丽,等. 云南省Ångström-prescott 辐射模型的参数化研究[J]. 农业工程学报,2012,28(6):100-105.
Li Manman, Mei Xurong, Zhong Xiuli, et al. Parameterization of Ångström-prescott radiation model in Yunnan province[J]. Transactions of the Chinese Society of Agricultural Engineering (Transactions of the CSAE), 2012, 28(6): 100-105. (in Chinese with English abstract)
[31] Louche A, Notton G, Poggi P, et al. Correlations for direct normal and global horizontal irradiation on a French Mediterranean site[J]. Solar Energy, 1991, 46: 261-266.
[32] Almorox J, Hontoria C. Global solar radiation estimation using sunshine duration in Spain[J]. Energy Conversion and Management, 2004, 45: 1529-1535.
[33] Glower J, McGulloch J S G. The empirical relation between solar radiation and hours of sunshine[J]. Quarterly Journal of the Royal Meteorological Society, 1958, 84: 172-175.
[34] Hargreaves G H, Samani Z A. Estimating potential evapotranspiration[J]. Journal of Irrigation and Drainage Engineering, 1982, 108: 223–230.
[35] Trnka M, Zalud Z, Eitzinger J, et al. Global solar radiation in Central European lowlands estimated by various empirical formulae[J]. Agricultural and Forest Meteorology, 2005, 131: 54-76.
[36] Mecibah M S, Boukelia T E, Tahtah R, et al. Introducing the best model for estimation the monthly mean daily global solar radiation on a horizontal surface (Case study: Algeria)[J]. Renewable and Sustainable Energy Reviews, 2014, 36: 194-202.
[37] 刘玉洁,潘韬. 中国地表太阳辐射资源空间化模拟[J]. 自然资源学报,2012,27(8):1392-1403.
Liu Yujie, Pan Tao. Spatial simulation of China land surface solar radiation resources[J]. Journal of natural resources, 2012, 27(8): 1392-1403. (in Chinese with English abstract)
[38]Al-Mostafa Z A, Maghrabi A H, Al-Shehri S M. Sunshine-based global radiation models: A review and case study[J]. Energy Conversion and Management, 2014, 84: 209-216.
Evaluation on applicability of daily solar radiation model in Northwest China based on meteorological data
Zhang Qingwen1, Cui Ningbo1,2※, Feng Yu1,3, Jia Yue1, Li Chen1, Gong Daozhi3, Hu Xiaotao4
(1.,610065,; 2.,610066,; 3.,,, B100081,; 4.)
Complete and accurate global solar radiation data at a specific region are highly crucial to regional crop modeling, evapotranspiration estimation, irrigation system development and utilization of solar energy resources. In order to improve the utilization efficiency of facility agriculture technology on radiation resources, daily climatic data in 10 meteorological stations in Northwest China from 1993 to 2016 were used to calculate dailyglobal solar radiation. The applicability of 6 solar radiation models based on sunshine (Ångström-Prescott, Ogelman, Bahel, Louche, Almorox-Hontoria and Glower-McCulloch model) and 3 solar radiation models based on temperature (Hargreaves-Samani, Annandale and Bristow-Campbell model) was evaluated using the coefficient of determination (2), root mean square error (RMSE), normalized root mean square error (RMSE), Nash-Sutcliffe coefficient (NS), mean absolute error (MAE) and relative error (RE). In addition, the parameters of Bristow-Campbell (B-C) model were calibrated based on least square method using the daily meteorological data from 1993 to 2010, and the daily meteorological data from 2011 to 2016 were adopted to evaluate the applicability of B-C model. The results showed that the estimated and measured daily global solar radiationhad statistically significant correlations (<0.01) for all the 9 models at the 10 stations. Generally, the models based on sunshine (with2ranging from 0.875 to 0.954 for the 10 stations) were more accurate to estimate daily global solar radiationthan the models based on temperature (with2from 0.652 to 0.813). In Northwest China, the Bahel model showed the best performance for daily global solar radiationestimation among the 6 models based on sunshine, followed by Ogelman model and Glower-McCulloch model, with average RMSE of 2.282, 2.309 and 2.313 MJ/(m2·d), averageRMSE of 14.0%, 14.2% and 14.2%, average MAE of 1.666, 1.701 and 1.697 MJ/(m2·d), and average NS of 0.905, 0.903 and 0.902, respectively. The best model based on temperature for estimation of daily global solar radiationwas the calibrated B-C model,followed by Hargreaves-Samani model and Annandale model, with average RMSE of 3.819, 4.167 and 4.368 MJ/(m2·d), averageRMSE of 23.3%, 25.5% and 26.6%, average MAE of 2.680, 3.068 and 3.378 MJ/(m2·d), and average NS of 0.741, 0.688 and 0.656 respectively. On the monthly scale, the estimated and measured monthly average daily global solar radiationhad good agreement, and the monthly average daily global solar radiationall increased from January to June and decreased from July to December. The Bahel model also showed the best performance for monthly average daily global solar radiationestimation among the 6 models based on sunshine, followed by Ogelman model and Glower-McCulloch model, with average RE of 5.350%, 5.375% and 5.679%, respectively. The calibrated B-C model had the best estimation accuracy among the models based on temperature, with average RE of 4.254%. It meant that the B-C model was more accurate than the Bahel model for global solar radiationestimation in monthly scale. Overall, the Bahel model is recommended to estimate daily global solar radiationwhen the sunshine hours are available, and the calibrated B-C model is recommended to estimate daily global solar radiationin Northwest China when only temperature data are available. This paper provides valuable information for global solar radiationestimation method in Northwest China, and also provides the theoretical basis and technical support for accurate estimation of daily global solar radiation.
solar radiation; models; temperature; sunshine duration; Northwest China; parameter calibration
10.11975/j.issn.1002-6819.2018.02.026
P422.1
A
1002-6819(2018)-02-0189-08
2017-07-14
2017-12-22
“十三五”国家重点研发计划课题(2016YFC0400206);国家自然科学基金项目(51779161);“十二五”国家科技支撑计划课题(2015BAD24B01);2017年中央高校基本科研业务费专项资金。
张青雯,女,云南曲靖人,研究方向为节水灌溉理论与技术。Email:zhangqwSCU@163.com
崔宁博,男,陕西凤翔人,副教授,博士。研究方向为节水灌溉理论与技术。Email:cuiningbo@126.com
张青雯,崔宁博,冯 禹,贾 悦,李 晨,龚道枝,胡笑涛. 基于气象资料的日辐射模型在中国西北地区适用性评价[J]. 农业工程学报,2018,34(2):189-196. doi:10.11975/j.issn.1002-6819.2018.02.026 http://www.tcsae.org
Zhang Qingwen, Cui Ningbo, Feng Yu, Jia Yue, Li Chen, Gong Daozhi, Hu Xiaotao. Evaluation on applicability of daily solar radiation model in Northwest China based on meteorological data[J]. Transactions of the Chinese Society of Agricultural Engineering (Transactions of the CSAE), 2018, 34(2): 189-196. (in Chinese with English abstract) doi:10.11975/j.issn.1002-6819.2018.02.026 http://www.tcsae.org
