Analysis of Autopilot Disengagements Occurring During Autonomous Vehicle Testing
2018-01-26ChenLvDongpuCaoYifanZhaoDanielAugerSeniorMarkSullmanHuajiWangLauraMillenDutkaLeeSkrypchukandAlexandrosMouzakitis
Chen Lv,,Dongpu Cao,,Yifan Zhao,Daniel J.Auger,Senior ,Mark Sullman,Huaji Wang,Laura Millen Dutka,Lee Skrypchuk,and Alexandros Mouzakitis
I.INTRODUCTION
AUTOMATED vehicles have been gaining increasing attention from both academia and industry[1].The field of automated vehicles is multidisciplinary,involving transportation system,automotive engineering,human factors,information technology,control,robotics,communications,energy,security,and social sciences[2]−[5].
While fully autonomous driving is often considered the“end goal”,intermediate “highly automated”vehicles(HAVs)thatare capable of driving autonomously in some scenarios(but not all)are likely to arrive sooner:HAVs the next few years.In support of this,the USA’s National Highway Traffic Safety Administration(NHTSA)issued its“Federal Automated Vehicles Policy”in September,2016.In this document,the NHTSA adopted the approach of SAE for describing levels of vehicle automation.The SAE definitions divide vehicles into six levels based on “who does what,when”[6],[7].SAE Level 1 corresponds to “driver assistance”systems;SAE Level 4 describes vehicles with “high automation”with the ability to manage safety-critical functions such as steering,accelerating and braking.SAE Level 2(“partial automation”)and Level 3(“conditional automation”)represent the transitional region between driver assistance and high automation,and they are a significant focus of emerging work.
In Level 2 and Level 3 automation,the driver cedes longitudinal and lateral control of the vehicle to a varying degrees[8].When there are driving tasks that the vehicle’s automation systems can no longer handle,the automated control mode disengages and control authority is given back to the driver.The disengagement process,along with the take-over(TO)operation,is of key importance and greatly affects automated vehicle’s safety and comfort.To address these challenges in driver-vehicle interactions at Level 2 and Level 3 automation,many researchers have explored advanced driver assistance systems(ADAS)and human-machine interfaces(HMIs)from a variety of viewpoints[9]−[12].However,disengagement events and their associated take-over events have rarely been investigated in real vehicle testing scenarios.
The US state of California is noted for its encouragement of autonomous vehicle technology and it allows manufacturers to perform testing on public roads.California’s Autonomous Vehicle Testing Regulations require every manufacturer testing vehicles on the state’s public roads to submit an annual report summarizing the disengagements experienced during testing.These disengagement reports are due by January 1 of each year.Seven manufacturers,namely Bosch,Delphi,Google,Nissan,Mercedes-Benz,Volkswagen,and Tesla Motors submitted their first disengagement reports on January 1,2016[13]−[19].To better understand the mechanisms of driver-vehicle interactions during the disengagement process,and to improve the Level 2 and Level 3 automation technology,this paper reviews the seven publicly reported disengagement files.The disengagement events with their various causes are investigated and compared in detail.Take-over mechanism and time are also examined through the vehicle tests.These findings shed light on the refinement of automated technology and driver-automation collaboration.
To present the details,the rest of this paper is arranged as follows:Section II defines and classifies the disengagement events focused on in this study,and presents the overall conditions of the disengagement reported by manufacturers;Section III analyses the main reasons of these disengagements;Section IV discusses the disengagement cases of stage-I and stage-II manufacturers,respectively;Section V investigates the take-over mechanism and time reported in the disengagements;Section VI proposes recommendations to original equipment manufacturers(OEMs),manufacturers,and government organizations,respectively,and discusses the opening challenges associated with driver-vehicle interactions;Section VII concludes the findings and discusses possible future work.
II.DISENGAGEMENT OVERVIEW
A.Definition of Disengagement
The California Department of Motor Vehicles(DMV)rule defines the disengagement which needs to be reported as a deactivation of the autonomous mode when a failure of the autonomous technology is detected,or when the safe operation of the vehicle requires that the autonomous vehicle test driver disengages autonomous mode and takes immediate manual control of the vehicle[20].
Remark 1:The above definition is necessary to ensure that manufacturers are not reporting every common or routine disengagement.And since these reported disengagements refer to those immediate ones,the automated technology where disengagements events occurred corresponds to SAE Level 2 automation,rather than Level 3(Level 3 automation is able to give driver a sufficiently comfortable transition time to take over the manual control).
B.Classification of Disengagement
The above defined disengagements of autonomous mode can be divided into:
1)Passive disengagement(PDE):When a failure of the autonomous technology is detected,disengagement is required by the automation system,and the driver undertakes an immediate take-over.
2)Active disengagement(ADE):Automation system does not recognize any failure,but the driver monitors the situation and actively takes an immediate manual control of the vehicle,disengaging the autonomous mode.
C.Overview of Automated Testing and Disengagements
An overview of the number of disengagements,with the number of automated driving miles for the seven manufacturers(represented as A-G),are listed below.
1)Manufacturer A reported 341 disengagements in 424331 miles driven[15];
2)Manufacturer B reported 405 disengagements in 16662 miles driven[14];
3)Manufacturer C reported 261 disengagements in 14945 miles driven[18];
4)Manufacturer D reported 1031 disengagements in 1739 miles driven[17];
5)Manufacturer E reported 106 disengagements in 1485 miles driven[16];
6)Manufacturer F reported 625 disengagements in 935 miles driven[13];
7)Manufacturer G reported zero disengagements(No testing on public streets)[19].
Based on the results in Fig.1,Company A is along way ahead in terms of autonomous vehicle testing miles on public roads.Detailed data can be found in Table I.As the automated driving technology being developed and re fined constantly,for most of these manufacturers,the number of disengagements occurring each month is steadily decreasing over time,as shown in Fig.2.The number of these disengagements,each month,by company can be found in Table II.
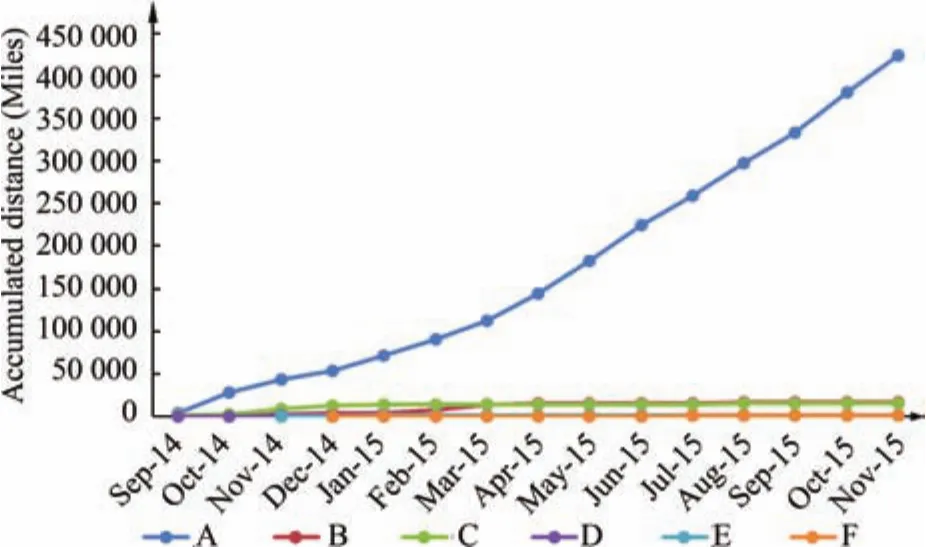
Fig.1.Automated driving miles on public roads for the six companies.
The environments that the automated cars operate are very important.Mastering autonomous driving in various conditions,including different locations,weather,and multi-type road surfaces,requires the automated technology to be smart and robust enough to handle all possible road circumstances[21],[22].
1)Locations:Street,Interstate way,freeway/highway;rural road,parking facility.

TABLE I REPORTED AUTOMATED TESTING MILES ON PUBLIC ROADS

TABLE II REPORTED NUMBER OF DISENGAGEMENTS DURING AUTOMATED TESTING

Fig.2.Number of disengagements by month.
2)Weather:Sunny,cloudy,rainy,clear(night)[16].
3)Road surface conditions:Dry,wet,poor road conditions with holes or bumps[17],poor lane markings,such as faded markings,and freshly paved roadway[14].
In order to comprehensively evaluate automated driving miles and disengagements,“miles per disengagement(MPD)”is adopted as an indicator to evaluate the maturity of the autonomous technology.MPD is defined as follows.

whereSis the automated driving miles during testing,andnis the number of disengagements occurred during testing.
According to Fig.3,at the end of 2015 the MPD of Company A remains stable at around 3000,while other companies’MPDs were typically within 100.Based on the MPD value,we define two stages to indicate different maturities of Level 2 automation technology.
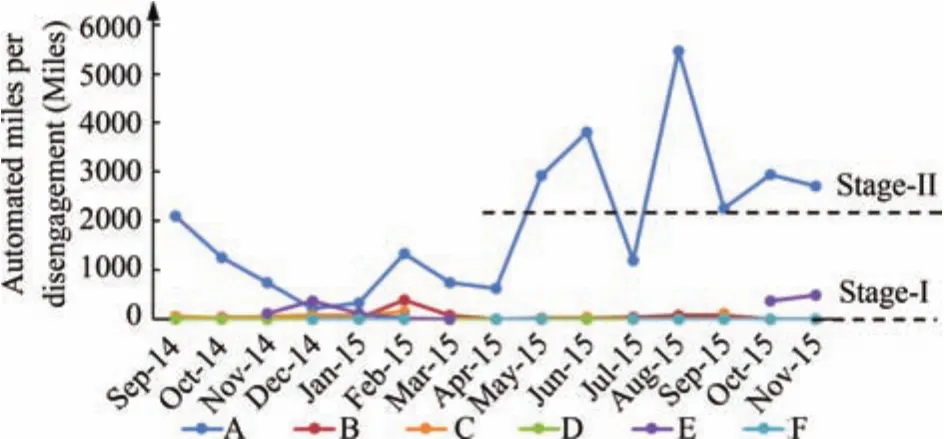
Fig.3.Automated miles per disengagement of the six manufacturers.
Stage 1:MPD below 2000,indicating the initial stage of Level 2 automation,with a lot of fundamental functions of automated system needing to be re fined and improved.
Stage 2:MPD above 2000,corresponding to the advanced level with matured Level 2 automation system,approaching Level 3 automation.
Thus,the six manufacturers covered in this report can be clearly classified into two groups with different stages of maturity in automated driving technology.
1)Stage-I manufacturers:B,C,D,E,and F;
2)Stage-II manufacturer:A.
III.MAIN REASONS FOR DISENGAGEMENTS
Many factors can impact autonomous control performance,and result in disengagements.These reasons include(but are not limited to)those listed in Table III and Fig.4.

TABLE III CAUSES OF THE DIFFERENT TYPES OF DISENGAGEMENTS
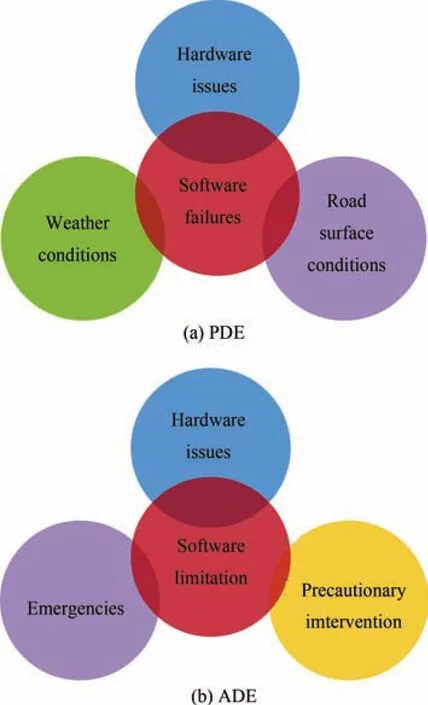
Fig.4.Main causes of PDEs and ADEs.
A.Typical causes of PDE
1)Hardware issues
Hardware discrepancy indicates that a hardware element failed or it is not performing as expected.Some typical reported causes have been listed as follows.
A failure occurred in the vehicle controller[16];
Damage to sensors,wires,actuators,and other physical devices.
2)Software issues
Software discrepancy covers inadequacies,involving issues of environment perception,object recognition,vehicle positioning and localization,decision making,path planning,trajectory generation,and vehicle control.Some typical causes reported are:
Perceiving overhanging branches as an obstacle[15];Another vehicle approached from the side but was undetected by the perception system[16];
The recognition system lost the trajectory of the preceding vehicle[16];
Generation of route goal failed[16];
Localization of the automated vehicle failed[16];
Position estimation logic failure caused the automated vehicle to begin traveling outside of its lane[16];
Departure logic failed,and the automated vehicle would not begin moving[16];
Problems with controller area network(CAN)bus data rate and data transmission causing the automated control to shut off[16];Watchdog error;
System tuning and calibration[16].
3)Weather conditions
Problems with weather conditions during testing caused the autonomous controller to shut off.
Traffic light detection fault due to poor lighting conditions[16];
Object detection failure due to sun glare,rain,or twilight[17];
Failures with poor visibility due to heavy rain,snow,fog,etc.;
Failures with bright light,such as oncoming headlights or direct sunlight;
Failures due to extremely hot or cold temperatures.
4)Road surface conditions
Problems causing autonomous control to shut off due to poor road surface conditions.
Road with holes or bumps[17];
Poor lane markings,such as faded markings,and freshly paved roadway[14].
B.Typical causes of ADE
Typical causes of ADE include software limitation,hardware issues,emergencies,and precautionary interventions.Detailed descriptions and related example cases are listed as follows.
1)Software limitations
Although there was no failure detected,the automated system was unable to handle high-stage tasks in complex situations,or object perceptions,vehicle’s trajectories,maneuvers,and behaviors made by the automated system were undesirable due to the limitation of software,resulting in an active takeover.Some typical cases are:
Complete lane change in heavy traffic[14];
Too many pedestrians and vehicles at the intersection for the system to predictably handle[16];
The automated vehicle moved uncomfortably close to a parked car[15];
The automated vehicle drove too close to the left or right side of the lane[16];
The automated vehicle did not recognize a vehicle that stopped in front of it and failed to slow down[16];
A vehicle pulling out of a parking lot was not recognized by the automated vehicle perception system[16];
System incorrectly recognized the preceding vehicle as a vehicle in the next lane[16];
The automated vehicle began to merge into a lane behind another vehicle very closely[16];
A vehicle stopped suddenly in front of the automated vehicle at an intersection[16];
The automated vehicle was slowly encroaching on the preceding vehicle[16];
The driver felt a delay in deceleration,so the driver took over the brake operation[16];
The automated vehicle did not enter the correct lane[16].
2)Hardware issues
Hardware issues that made the driver feel to immediately take over manual control of the vehicle.
3)Emergencies
Emergency situations that make the driver actively take over the control authority of the vehicle from the automation system for safety reasons.Typical cases include:
Emergency vehicles[14],[15](To solve this issue,recently Google proposed a system and method for detecting and responding to emergency vehicles[23]);Accidents or collisions[13];
Unexpected or reckless behaviors from other vehicles.For example:While the automated vehicle was merging autonomously,another vehicle approached in front of the automated vehicle suddenly,and it was undetected by the perception system;Another vehicle was about to rear-end the automated vehicle due to sudden deceleration of the automated vehicle.
4)Precautionary intervention
Problems causing autonomous control to shut off due to poor road surface conditions.
To avoid construction zones[13]−[17];To give extra space for a cyclist[14];
Precautionary intervention due to pedestrian traffic[14];To ensure vehicle safety in bad weather conditions[17].
Remark 2:The above does not represent an exhaustive list of situations that may interfere with proper operation of automated control.In the initial stages of automated driving(e.g.,Level 1 and Level 2 automation),operators should never completely depend on these components to remain safe.It is the driver’s responsibility to stay alert,and be ready to take control of the vehicle at all times.
IV.CASE STUDY OF MANUFACTURERS
A.Analyses of Stage-II Disengagement(DE)Cases
As a leading company,the Stage-II manufacturer A’s disengagement cases are presented in order to analyze the development course of the automated driving technology.
1)An overview:The numbers of the Stage-II manufacturer’s PDE and ADE cases in each month have been listed in Fig.5.According to the data,PDEs dominate the disengagement cases.After experiencing a significant increase with almost 50 cases per month before May 2015,the amount of PDEs start to decrease considerably,and remains table at below 20 per month,indicating that the automation control system has been gradually re fined.In contrast,the number of ADEs remains stable with less than 10 cases per month.
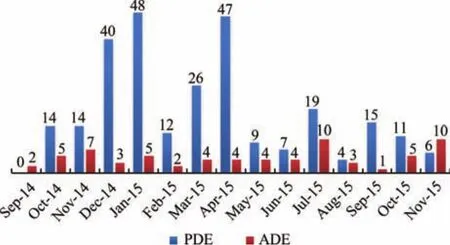
Fig.5.Numbers of PDE and ADE for Company A each month.
Fig.6 displays how the number of autonomous miles driven between disengagements has changed over time.In general,the number of autonomous miles between each disengagement is increasing steadily.The rate of DE has dropped from 744 miles per disengagement in Q4 of 2014 to over 2800 miles per disengagement in Q4 of 2015.Specifically,the rates of PDE and ADE have dropped from 1026 miles and 3398 miles per disengagement in the Q4 of 2014 to 5749 miles and 6878 miles per disengagement in Q4 of 2015,respectively.These also demonstrate the gradual improvements and maturity of the automated driving technology that company A achieved during this period.

Fig.6.Automated miles per disengagement for Company A each month.
2)PDE of Stage-II Manufacturer’s Cases:Taking a detailed look at the data,the main reasons causing PDEs can be placed into four categories,namely:hardware issues,software failures,weather conditions,and road surface conditions.As shown in Fig.7,software failures dominate the PDE causes each month.These software issues include initial stage problems of perception,decision making,and control,corresponding to Level 1 and Level 2 automation functions.However,the number of PDEs decreases significantly following April 2015,indicating the continuous refinement and development of the software.

Fig.7.Company A’s PDEs causes by month.
According to Fig.8,it can be clearly seen that the software problems take up over 80%of the proportion among the four PDE reasons for failure during the entire testing process.Furthermore,the proportion of hardware failures,poor weather and road conditions are 13.97%,4.04%,and 0.37%,respectively.
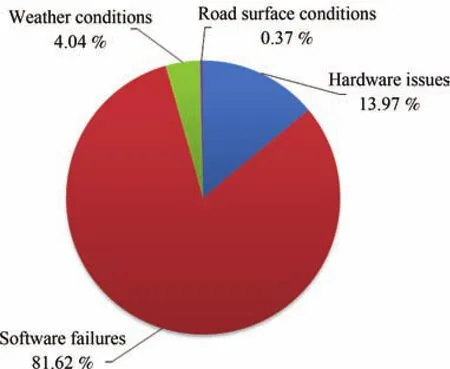
Fig.8.Proportion of different causes of Company A’s PDEs.
3)ADE of Stage-II manufacturer’s cases:The main causes of ADE failures were software limitations,hardware issues,emergencies,and precautionary interventions,respectively.

Fig.9.Company A’s ADEs causes by month.
As shown in Fig.9,it is software limitations that dominate the causes of ADE each month.The number of ADEs caused by software problems has not obviously decreased during this period of time.This is because that these ADE software problems usually correspond to Level 3 Automation functions,which is much more difficult to improve.Besides this,the essence of disengagements caused by emergencies and precautionary interventions are also closely related to software limitations.Since the automation technology is not robust and intelligent enough so far,the software lack capability to handle advanced driving tasks in complex situations,such as tackling emergencies.Thus,the human operators still do not fully trust the automation control,and they intervene in some cases to guarantee safety.
Fig.10 shows that software problems account for over 75%of ADEs’.Combining software failures,emergencies and precautionary interventions together account for 98%of ADE cases.
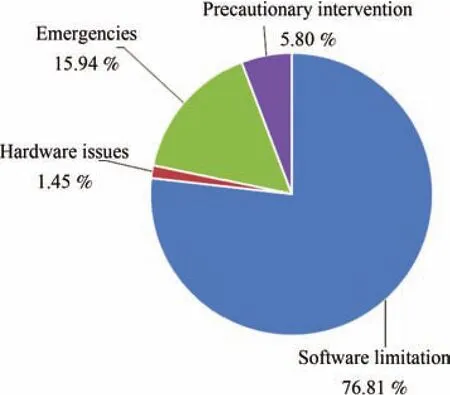
Fig.10.Proportion of each cause of Company A’s ADEs.
B.Detailed Analysis of Stage-I Manufacturers’DE Cases
The numbers of disengagement events for the five Stage-I companies manufactures are analysed together,in order to find some commonalities and characteristics based on a larger dataset.
1)An overview:Fig.11 shows that PDE dominates the disengagement cases in each month from Q4 of 2014 to Q1 of 2015.However,since Jan 2015,the absolute number of PDEs steadily decreases to within 50 per month at the end of the year.
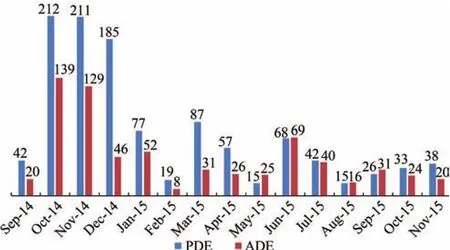
Fig.11.Number of PDE and ADE of Stage-I companies by month.
However,considering the distance driven,as shown in Fig.12,the overall automated driving miles of these five Stage-I companies are less than 1/10 of Company A’s total autonomous driving miles on public roads.Therefore,number of autonomous miles between disengagements is only around 10 miles(Company A:around 2800 miles),which clearly shows their immaturity in automated driving technology,and also indicates the importance of on-road testing for the development of highly automated vehicles.
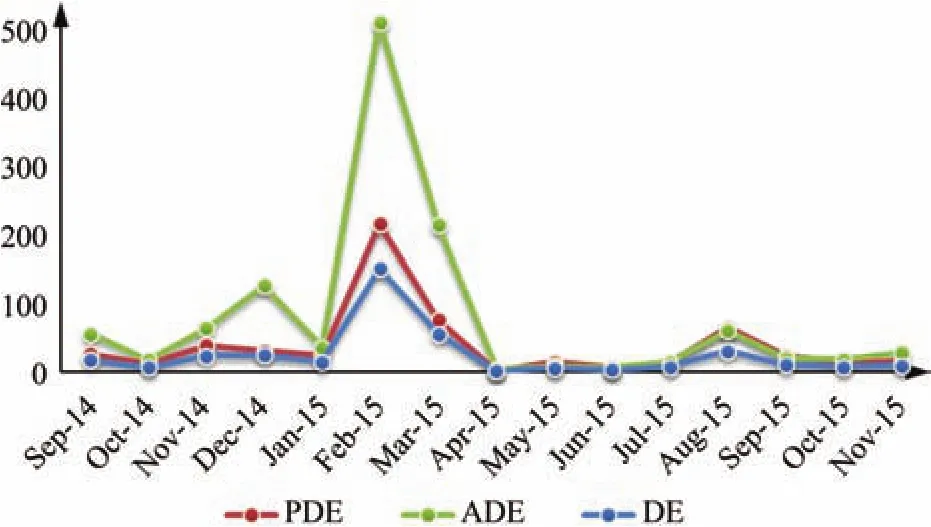
Fig.12. Automated miles per disengagement of Stage-I companies by month.
2)PDE of Stage-I manufacturers’cases:The reasons for PDEs among Stage-I manufacturers are also due to hardware issues,software failures,weather conditions,and road surface conditions.As shown in Fig.13,the most common cause was software failures,but the other three causes always contributed to the number of PDEs.

Fig.13. PDE causes for Stage-I companies by month.
Based on the pie chart in Fig.14,weather conditions and road surface conditions account for over 9%of PDE cases,indicating a deficiency in the Level 2 and Level 3 automation functions of these Stage-I companies.
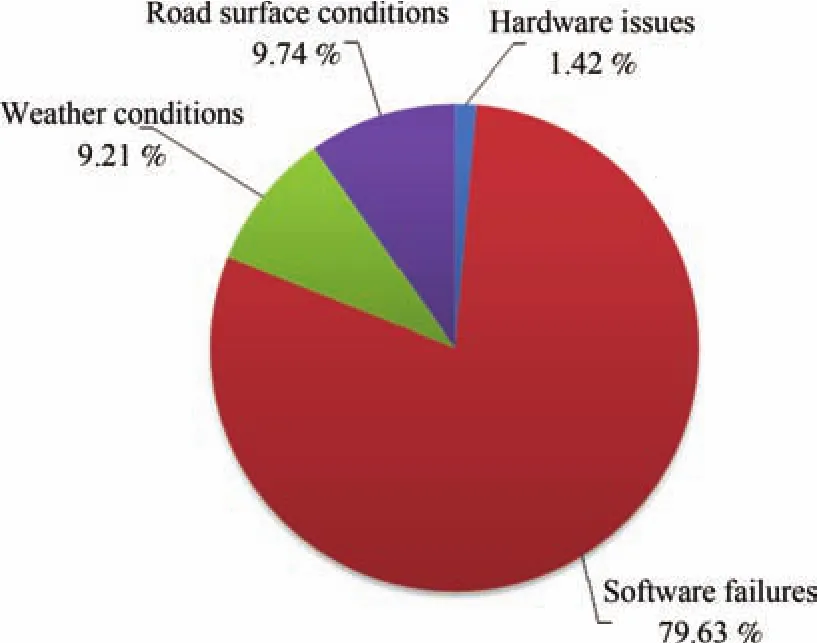
Fig.14. Proportion of PDEs causes for Stage-I companies.
3)ADE of Stage-I manufacturers’cases:Based on the data shown in Fig.15,similar to Company A,software failures were the most common causes of ADE in Stage-I manufacturers.As previously mentioned,the disengagements caused by emergencies and precautionary intervention are actually closely related to software failures.

Fig.15.Causes of ADEs for Stage-I companies’by month.
For Stage-I companies,which three causes account for almost 100%of the ADEs(see Fig.16).This phenomenon shows the difficulty in developing high level automation technology,and also indicates the huge gap between their current status and the high automation target of the Stage-I players.
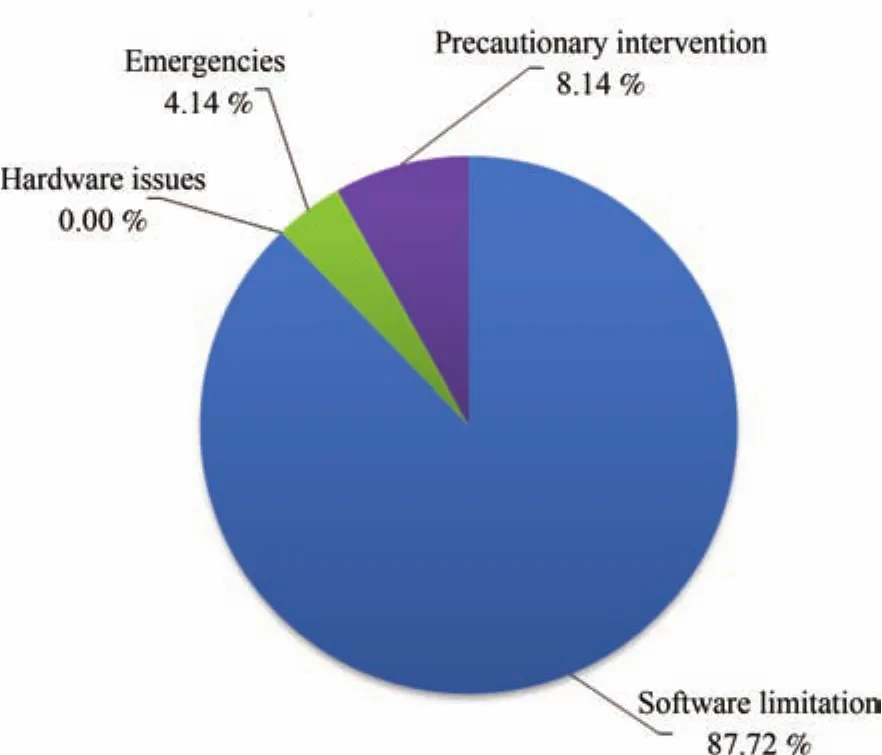
Fig.16. Proportion of different causes of Stage-I companies’ADEs.
Remark 3:According to the above analysis,the software issues or limitations are the main causes of the disengagements.To improve and re fine the software,manufacturers and other entities should follow guidance,best practices,design principles,and standards developed by established standardization organizations such as the International Standards Organization(ISO)and SAE International[24].The NHTSA also pointed out that the automotive industry should monitor the evolution,implementation,and safety assessment of artificial intelligence(AI),machine learning,and other relevant software technologies and algorithms in order to improve the effectiveness and safety of HAVs[17].
V.TAKE-OVER MECHANISM AND TIME
As long as there are situations that cannot be handled by automation,the driver has to be available to take over the driving task in a safe manner.Research on the mechanism and elapsed time of the take-over actions can help us to better understand at which point a driver’s attention must be directed back to the driving task,and to synthesize suitable shifting control algorithms.
A.Take-Over Mechanism
A take-over action can either be requested by the automation system or directly triggered by manual input from driver or operator.
1)Take-over request:The take-over request is usually alerted through distinct audio and/or visual feedback after failures have been detected,indicating that immediate manual control is needed by the driver.
2)Take-over operation:After receiving the take-over request alerted by the automation system,or when the driver wants to manually control the vehicle,the take-over transition can be triggered by driver through actions,including pressing the auto/manual switch,or manipulating the steering wheel,brake or accelerator.The take-over processes of each manufacturer are outlined below.
a)Manufacturer A:the test driver is given a distinct audio and visual signal,indicating that immediate take-over is required[15].
b)Manufacturer B:any hardware failure triggers a buzzer to alert the vehicle operator that he/she needs to take over.The vehicle operator always has one hand on the steering wheel and one hand on the auto/manual toggle switch on the vehicle’s central console.Pressing the auto/manual switch kills all power to the automated system actuators(throttle,steering,brakes,and shifter)and allows the operator to instantaneously take full control[14].
c)Manufacturer E:test driver is alerted to technology failure,or the driver actively overrides the system with manual brake/accelerator/steering input,causing the controller to disengage[16].
d)Manufacturer F:when a disengagement from automated mode occurs,the driver is immediately alerted audibly and visually and then immediately reassumes control.However,reassuming control does not necessarily mean the driver must apply an immediate,measurable input on the steering wheel,brake or gas pedal or any other input device[13].
e)Manufacturer G:The warning is designed to provide both visual and audible alerts.The automated system does not attempt to apply the brakes or decelerate the vehicle.When seeing and/or hearing a warning,it is the driver’s responsibility to take corrective action immediately.Disengaging automated control can be realized by pressing the brake or briefly pushing the cruise control lever away from the driver[25].
B.Take-Over Time
In general,the take-over time can be defined as the period of time elapsed from when the driver was alerted of a technology failure to when the driver assumed manual control of the vehicle[15].Currently there is no standard methodology for measuring the take-over time.Furthermore,manufacturers’reports did not adequately describe their methods for logging this data.Take-Over elapse time reported in the disengagement events of each manufacturer is reported in Table IV.

TABLE IV TAKE-OVER TIME REPORTED IN DISENGAGEMENTS OF EACH MANUFACTURER
1)Manufacturer A:Our test drivers are trained and prepared for these events and the average driver response time for all measurable events was 0.84s[15].
2)Manufacturer B:In all cases that have a record of the disengagement time,this time was measured as<1s(no detailed duration).In all remaining cases the disengagement time was recorded as N/A[14].
3)Manufacturer C:The average take-over time was 3.06s[18].
4)Manufacturer D:In general,the average recorded reaction time in disengagement cases was 0.875s.However,according to the details of their report,only automatic disengagements recorded the reaction time,while the reaction time of disengagements was not provided[19].
5)Manufacturer E:Generally less than 1s on average.In all the driver over ride cases,the time was recorded as 0s;in almost all the cases of automation system fails,the time was recorded as<1s.In one exception the elapsed time was 4s.
6)Manufacturer F:We are unable to measure the time period for every single disengagement because not all driving situations require measurable driver input.Our test vehicle safety approach,therefore,includes the process of transition from automated to manual mode in a specific test driver training.Only trained drivers are allowed to operate a test vehicle and they constantly monitor the vehicle’s operation.This safety approach has been reviewed by an independent 3rd party safety organization[13].
Remark 4:Although most of the average values of the reported take-over time are within 1 s,a take-over transition is never an easy task that can be rapidly and easily completed.In all reported automated vehicle tests the test drivers were well-trained and experienced ones,who were concentrating and prepared to take over the vehicle’s control.However,in daily life driving,we are unable to guarantee all the drivers are well trained and concentrate enough to resume the manual control so quickly.Furthermore,the take-over performance is closely related to driving scenarios,driver’s workload,attention,drowsiness,whether they have situational awareness,etc.Thus,how to accurately detect driver’s behaviors and attention,and the design of the HMI remain important challenges that require exploring.The NHTSA also pointed out that manufacturers and other entities should consider whether it is reasonable and appropriate to incorporate driver engagement monitoring into Level 3 HAV systems[17].
VI.DISCUSSION AND RECOMMENDATIONS
Disengagement is a key indicator reflecting the maturity of the automated driving technology.Based on the above analyses,we believe that different types of disengagements correspond to distinguished maturity stages of the developed automation technology.
As shown in Fig.17,PDE and ADE fit the characteristics in between Level 2 and Level 3 automation.Specifically,PDE corresponds to the initial development stage of Level 2.Adequately resolving PDE failures will lead to the manufacturer reaching the maturity-I stage of Level 2 automation.Beyond PDE,those ADE cases can be mapped into the higher stages of Level 2.The causes of ADEs usually indicate more difficult to solve problems of the automated functions.If the ADEs’issues can be well handled,the technology is almost reaching Level 3 automation.
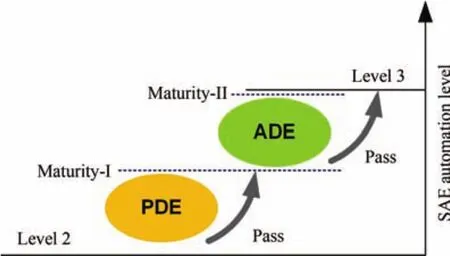
Fig.17. Relations between reported disengagements and automation levels.
A.Recommendations
Based on the above analysis,in order to help develop and re fine automated driving technologies,especially the Level 2 and Level 3 automation technologies,some recommendations for OEMs,manufacturers,and government organizations are provided below.
1)For OEMs:Disengagement with driver take-over is a complex process which is crucial to driving safety and ride comfort during automated driving.According to the analysis of disengagement data,the dominant causes for both PDE and ADE are software issues,which cover the inadequacies of perception,decision making,path planning,and vehicle control.Heading toward higher automation,the performance and robustness of the software needs to be improved urgently.OEMs should follow a robust software design and validation process based on a systems-engineering approach with the goal of designing HAV systems free of unreasonable safety risks.Also as the NHTSA recommended,OEMs should monitor the evolution,implementation,and safety assessment of artificial intelligence,machine learning,and other relevant software technologies and algorithms to improve the effectiveness and safety of HAVs[6].
In addition,understanding the interaction between the vehicle and the driver is of great importance.Especially in systems of SAE Level 2 and Level 3,human drivers are expected to return to the driving tasks and take over driving responsibilities,but drivers’ability to do so is limited by human capacity to stay vigilant when disengaged from the driving task.OEMs should consider how to incorporate driver attention,inattention,and engagement monitoring into automated systems.Furthermore,how HAVs will signal intentions to the environment around the vehicle,including pedestrians,bicyclists,and other vehicles,these factors should also be considered by OEMs documented processes for the assessment,testing,and validation of the vehicle HMI are needed.
2)For manufacturers:For integrating all the components in an automated vehicle,manufacturers should suitably determine their system’s AV level in conformity with SAE International’s published definitions.For all HAV systems,the manufacturer should address the cross-cutting items as a vehicle or equipment is designed and developed to ensure that HMI design best practices have been followed;that appropriate crash/occupant protection has been designed into the vehicle;and that consumer education and training have been addressed[6].
Especially for handling the disengagements with human driver take-overs,manufacturers should have a documented process for transitioning to a minimal risk condition when a problem is encountered.HAVs operating on the road should be capable of detecting HAV system issues,and informing the human driver in a way that enables the driver to regain adequate control of the vehicle as swiftly and safely as possible.Fall back strategies should take into account that human drivers may be inattentive,under the influence of alcohol or other substances,drowsy,or physically impaired in some other manner.The fall back actions should be administered in a manner that will facilitate safe operations of the vehicle and minimize erratic driving behavior,and should also minimize the effects of errors in human driver recognition and decisionmaking during and after transitions to manual control.Besides this,disengagement events should also be well analysed and utilized after happening.A good example is given by Google.They employs a powerful simulator that allows them to“replay”each disengagement with the behavior of the vehicle as well as the behavior and positions of other road users in the vicinity[15].
3)For government organizations:Government organizations play an important role in facilitating automated vehicles,such as ensuring they are safely deployed,and promoting their life-saving features.
To help develop and improve automated technology,governments should retain their traditional responsibilities for vehicle licensing and registration,traffic laws and enforcement,and motor vehicle insurance and liability regimes for automated vehicles.More testing areas and facilities should be established and upgraded for supporting the development of automated technology[6].
Adequate education and training is imperative to ensure safe deployment of automated vehicles.Apart from manufacturers and other entities,government organizations should also develop and organise activities,such as education and training programs,workshops,and vehicle demonstrations,to helping civics address the basic principles of automated vehicles,and the anticipated differences in the use and operation of automated vehicles from those of conventional vehicles that the public owns and operates today.
VII.CONCLUSION
In order to better understand driver-vehicle interactions,and help improve Level 2 and Level 3 automation technology,this paper reviewed seven disengagement files reported by major companies that ran automated vehicle tests on public roads.The definition of the disengagement events focused in this study was claimed at first.Based on their different attributes,the disengagement events were classified into two types,namely PDE and ADE.The overall conditions of the disengagement reported by manufacturers were presented.Then,the main reasons of disengagement events were revealed.Among these reasons,the software issues and limitations were the most common.Cases of manufacturers’disengagements were also investigated in detail.The take-over mechanism and time reported in each company’s disengagement events were discussed.Based on the analyses,recommendations to OEMs,manufacturers,and government organizations have been provided.Future work will include a comparison of the present disengagement data with those published in the following year,an investigation of driver attention and cognition when interacting with automated driving,and the development of haptic feedback HMI which considers driver cognition state.
APPENDIX NOMENCLATURE
[1]F.Y.Wang,“Control 5.0:From newton to Merton in popperś cybersocial-physical spaces,”IEEE/CAA J.Automat.Sin.,vol.3,no.3,pp.233−234,Jul.2016.
[2]M.Da Lio,F.Biral,E.Bertolazzi,M.Galvani,P.Bosetti,D.Windridge,and F.Tango,“Artificial co-drivers as a universal enabling technology for future intelligent vehicles and transportation systems,”IEEE Trans.Int.Trans.Syst.,vol.16,no.1,pp.244−263,Feb.2015.
[3]L.Li,Y.S.Lv,and F.Y.Wang,“Traffic signal timing via deep reinforcement learning,”IEEE/CAA J.Automat.Sin.,vol.3,no.3,pp.247−254,Jul.2016.
[4]T.Qu,H.Chen,D.P.Cao,H.Y.Guo,and B.Z.Gao,“Switchingbased stochastic model predictive control approach for modeling driver steering skill,”IEEE Trans.Int.Trans.Syst.,vol.16,no.1,pp.365−375,Feb.2015.
[5]G.Xiong,F.H.Zhu,X.W.Liu,X.S.Dong,W.L.Huang,S.H.Chen,and K.Zhao,“Cyber-physical-social system in intelligent transportation,”IEEE/CAA J.Automat.Sin.,vol.2,no.3,pp.320−333,2015.
[6]National Highway Traffic Safety Administration,Federal automated vehicles policy,Department of Transportation,pp.1−112,Sep.2016.
[7]SAE On-Road Automated Vehicle Standards Committee,Taxonomy and definitions for terms related to on-road motor vehicle automated driving systems,”2014.
[8]National Highway Traffic Safety Administration,“Human factors evaluation of level 2 and level 3 automated driving concepts,”National Highway Traffic Safety Administration,Washington,DC,USA,Report No.DOT HS 812 044,pp.1−300,2014.
[9]M.Johns,B.Mok,D.M.Sirkin,N.M.Gowda,C.A.Smith,W.J.Jr.Talamonti,and W.Ju,“Exploring shared control in automated driving,”inProc.11th ACM/IEEE International Conf.Human-Robot Interaction,Christchurch,New Zealand:IEEE,2016,pp.91−98.
[10]L.Lorenz,P.Kerschbaum,and J.Schumann,“Designing take over scenarios for automated driving:How does augmented reality support the driver to get back into the loop?”Proc.Human Factors Ergonomics Soc.Ann.Meet.,vol.58,no.1,pp.1681−1685,Sep.2014.
[11]B.Mok,M.Johns,K.J.Lee,D.Miller,D.Sirkin,P.Ive,and W.Ju,“Emergency,automation off:Unstructured transition timing for distracted drivers of automated vehicles,”inProc.18th International Conf.Intelligent Transportation Systems,Las Palmas,Brazil:IEEE,2015,pp.2458−2464.
[12]C.Lv,Y.H.Liu,X.S.Hu,H.Y.Guo,D.P.Cao,and F.Y.Wang,“Simultaneous observation of hybrid states for cyber-physical systems:A case study of electric vehicle powertrain,”IEEE Trans.Cybern.,2017,doi:10.1109/TCYB.2017.2738003.(to be published)
[13]Robert Bosch, LLC, “Annual report of autonomous mode disengagements,” [Online]. Available:https://www.dmv.ca.gov/ portal/ wcm/connect/e1e48704-583e-4cfdaa9a-fa464cb6903d/bosch disengagemen_treport.pdf?MOD=AJPERES.Accessed on:Sep.21,2016.
[14]Delphi Automotive Systems,LLC,“Summary of autonomous vehicle disengagements,”[Online]. Available: https://www.dmv.ca.gov/portal/wcm/connect/851838fb-da8b-45da-bd95-0ae0451de988/2015_Delphi_DMV_Summary.pdf?MOD=AJPERES. Accessed on:Sep.21,2016.
[15]Google Auto, “Google self-driving car testing report on disengagements of autonomous mode,” [Online]. Available:https://www.dmv.ca.gov/portal/wcm/connect/dff67186-70dd-4042-bc8cd7b2a9904665/google_disengagemen_treport.pdf?MOD=AJPERES.Accessed on:Sep.21,2016.
[16]Nissan North America,Inc.,“Nissan autonomous vehicle disengagement report 2015,”[Online].Available:https://www.dmv.ca.gov/portal/wcm/connect/0170b0e7-7992-45f6-918d-8d3cc5bce9ee/nissan_disengagemen_treport.pdf?MOD=AJPERES.Accessed on:Dec.23,2015.
[17]Mercedes-Benz Research & Development North America,“Disengagements of autonomous vehicle system,”[Online].Available:https://www.dmv.ca. gov/portal/wcm/connect/fdea 0433-4935-414f-84a2-1e815e416964/MercedezBenz_disengage repor_t2016.pdf?MOD=AJPERES.Accessed on:Sep.21,2016.
[18]Volkswagen Group of America,“Volkswagen group of America,Inc.’s disengagement reports,”[Online].Available:https://www.dmv.ca.gov/portal/wcm/connect/9221a5cd-e67a-4e98- aa6c-6e958c721d83/Volkswagen_disengage repor_t2016.pdf?MOD=AJPERES.Accessed on:Sep.21,2016.
[19]Tesla Motors Inc.,“Reporting disengagement of autonomous mode,” [Online]. Available: https://www.dmv. ca.gov/portal/wcm/connect/d4114e78-4c45-4328-a6b9-428e400bf067/tesla_disengagement_report.pdf?MOD=AJPERES.Accessed on:Sep.21,2016.
[20]California DMV, “Final statement of reasons,”[Online].Available:https://www.dir.ca.gov/oshsb/documents/Reinforcing-Steel-Concrete-Construction-and-Post-Tensioning-Operations-FSOR.pdf.Accessed on:Sep.21,2016.
[21]K.Kritayakirana and J.C.Gerdes,“Autonomous vehicle control at the limits of handling,”Int.J.Veh.Auton.Syst.,vol.10,no.4,pp.271−296,2012.
[22]C.Urmson,J.Anhalt,D.Bagnell,C.Baker,R.Bittner,M.N.Clark,J.Dolan,D.Duggins,T.Galatali,C.Geyer,M.Gittleman,S.Harbaugh,M.Hebert,T.M.Howard,S.Kolski,A.Kelly,M.Likhachev,M.McNaughton,N.Miller,K.Peterson,B.Pilnick,R.Rajkumar,P.Rybski,B.Salesky,Y.W.Seo,S.Singh,J.Snider,A.Stentz,W.R.Whittaker,Z.Wolkowicki,J.Ziglar,H.Bae,T.Brown,D.Demitrish,B.Litkouhi,J.Nickolaou,V.Sadekar,W.D.Zhang,J.Struble,M.Taylor,M.Darms,and D.Ferguson,“Autonomous driving in urban environments:Boss and the Urban Challenge,”J.Field Rob.,vol.25,no.8,pp.425−466,Aug.2008.
[23]Y.Tian,W.Y.Lo,and D.Ferguson.“Real-time active emergency vehicle detection,”U.S.Patent Application No.14/471,640,2014.
[24]Road vehicles-functional safety,ISO 26262-1:2011,2011.
[25]Tesla Motors Inc., “Tesla model S-owner’s manual,” [Online].Available:https://carmanuals2.com/tesla/model-s-2016-owner-s-manual-89478.Accessed on:Sep.21,2016.
杂志排行
IEEE/CAA Journal of Automatica Sinica的其它文章
- Encoding-Decoding-Based Control and Filtering of Networked Systems:Insights,Developments and Opportunities
- Internet of Vehicles in Big Data Era
- Residential Energy Scheduling for Variable Weather Solar Energy Based on AdaptiveDynamic Programming
- From Mind to Products:Towards Social Manufacturing and Service
- A Methodology for Reliability of WSN Based on Software De fined Network in Adaptive Industrial Environment
- Data Gathering in Wireless Sensor Networks Via Regular Low Density Parity Check Matrix
