Influences of Cu Content on the Cu/Co/Mn/Al Catalysts Derived from Hydrotalcite-Like Precursors for Higher Alcohols Synthesis via Syngas
2017-12-18LIAOPeiYiZHANGChenZHANGLiJunYANGYanZhangZHONGLiangShuGUOXiaoYaWANGHuiSUNYuHan
LIAO Pei-Yi ZHANG Chen ZHANG Li-Jun YANG Yan-Zhang ZHONG Liang-Shu GUO Xiao-Ya WANG Hui,* SUN Yu-Han
Influences of Cu Content on the Cu/Co/Mn/Al Catalysts Derived from Hydrotalcite-Like Precursors for Higher Alcohols SynthesisSyngas
LIAO Pei-Yi1,2ZHANG Chen1,2ZHANG Li-Jun1YANG Yan-Zhang2ZHONG Liang-Shu2GUO Xiao-Ya1WANG Hui2,*SUN Yu-Han2
(1;2)
A series of Cu/Co/Mn/Al catalysts derived from hydrotalcite precursors with different Cu/Co molar ratios (0, 0.1, 0.5, 1.0, and 2.0) were prepared and used for the synthesis of higher alcohols from syngas. N2physical adsorption desorption, inductively coupled plasma atomic emission spectrometry (ICP-AES), X-ray diffraction (XRD), scanning electron microscopy (SEM), hydrogen temperature- programmed reduction (H2-TPR), thermogravimetry (TG), and high-resolution transmission electron microscopy (HRTEM) techniques were employed to investigate the physical and chemical properties of the Cu/Co/Mn/Al catalysts. The results show that the optimum Cu content can increase specific surface area, improve reducibility, and form regular layered structure to provide more uniform distribution of active sites, thereby enhancing catalytic activity and alcohol selectivity. When the Cu/Co molar ratio was 0.5, the yield of alcohol and the alcohol selectivity reached the maximum values of 0.071 g∙g−1∙h−1and 35.9%, respectively.
Higher alcohols synthesis; Layered-double hydroxide; Cu/Co/Mn/Al catalyst; Cu/Co molar ratio; Syngas conversion
1 Introduction
Higher alcohols synthesissyngas (CO + H2) derived from coal, natural gas or renewable biomass has gained renewed interest due to its potential applications in alternative fuels, fuel additives, and intermediates for value-added chemicals including medicines, detergents, cosmetics and polyesters1−4. Much progress has been achieved in the past and four main types of catalysts have been reported5. The Rh based noble nanocatalysts exhibit good catalytic activity and selectivity for higher alcohol synthesissyngas, but the high price and scarcity on earth of Rh hinder its large-scale application6−8. Therefore, non-noble metal catalysts have attracted much attention due to their low cost and easy availability. Compared with modified methanol synthesis catalysts and Mo-based catalysts9−13, the modified Fischer-Tropsch synthesis catalysts are recognized as the most promising candidates for higher alcohol synthesis from syngas14−16. For efficient synthesis of higher alcohols, bifunctional sites responsible for both non-dissociative insertion and dissociative activation of CO are required. Especially, CuCo bimetallic catalysts with bifunctional sites show good catalytic performance in high alcohol synthesis from syngas17,18. However, they suffer low stability due to the intrinsic physical-chemical properties of copper and cobalt19. Hence, much effort has been made to develop stable CuCo bimetallic catalysts system for higher alcohol synthesis20. Among them, adding other metals in the CuCo bimetallic catalysts system is one of the effective methods to improve the catalytic performance. It was found that Al2O3was beneficial to the formation of higher alcohols in the study of the synthesis of mixed alcohols21. Moreover, MnOis also a very promising electronic and structure promoter to increase the selectivity of higher alcohols22.
Many researchers proposed that Cu2+ions exist in Cu-containing hydrotalcite-like materials in a highly dispersed form, implying that the structure can enhance the interaction between copper and cobalt in CuCo catalysts27,28and the content of Cu may has an important effect on the synergistic effect between Cu and Co. Research suggests thatCO conversion, the selectivity and distribution of alcohols changed with the increase of Cu/Co molar ratio29,30. Therefore, exploring the influence of Cu/Co molar ratio on Cu/Co/Mn/Al catalyst derived from hydrotalcite precursor for mixed alcohols synthesis from syngas has certain significance. The effect of the different Cu content on the evaluation results of higher alcohol synthesis from syngas is explained through discussing the role and function of Cu in the catalytic system.
In this work, a series of Cu/Co/Mn/Al catalysts derived from Cu/Co/Mn/Al hydrotalcite-like precursors were synthesized with Cu/Co molar ratios ranging from 0 to 2. The catalysts were prepared by co-precipitation method and characterized by a wide range of spectroscopic techniques. The catalytic performance of the catalysts was evaluated in a fixed bed reactor. The focus of the present research is to investigate the impact of Cu/Co molar ratio on the catalytic activity and selectivity.
2 Experimental and computational section
2.1 Catalyst preparation
Cu/Co/Mn/Al catalysts derived from hydrotalcite-like precursors with different Cu/Co molar ratios were synthesized by co-precipitation method at room temperature. In a typical experiment, a mixture of Cu(NO3)2·3H2O (Aladdin 99%), Co(NO3)2·6H2O (Aladdin 99%), Al(NO3)3·9H2O (Aladdin 99%)and Mn(NO3)2solution (Aladdin 50% () in H2O)with respective molar ratios were dissolved in deionized water and a mixed aqueous solution of NaOH (Aladdin 96%) and Na2CO3(Aladdin 96%)were simultaneously added dropwise to 500 mL of deionized water under vigorous stirring. All chemicals were purchased from commercial suppliers and used as received. The pH value was maintained at 9.5 ± 0.1. After the precipitation was completed, the slurry was aging for 12 h, followed by filtration to obtain the solid. The solid was then washed with deionized water until the pH value of solution below 8. After drying at 80 °C for 12 h followed by calcination in air at 350 °C for 3 h, the desired oxide catalysts were obtained. For convenience, the catalysts were denoted as CCMA-, whereis 1, 2, 3, 4, 5, representing the Cu/Co molar ratio of 0, 0.1, 0.5, 1.0 and 2.0, respectively.
2.2 Catalyst characterizations
ICP-AES was performed for the determination of the bulk metal content in each sample. The ICP-AES measurements were carried out on a TJA atomscan 16 inductively coupled plasma atomic emission spectrometer. BET surface area, pore volume and average pore diameter of the catalysts was measured by N2physisorption at −196 °C using a Quantachrome Autosorb-iQ2-MP apparatus. These samples were degassed under vacuum at 200 °C for 8 h prior to measurement. The specific surface area was calculated by Brunauer-Emmett-Teller (BET) method by processing the adsorption data in the relative pressure (/0) from 0.04 to 0.3. Pore volume and pore size distribution was calculated by Barrett-Joyner-Halenda (BJH) method. Powder X-ray diffraction (XRD) was recorded on a Germany Bruker D8 Advance diffractometer, using CuKradiation and in a 2angle range from 10° to 80°. Phase identification was analyzed by comparing the obtained patterns with JCPDS standard card.
Hydrogen temperature-programmed reduction (H2-TPR) was carried out in a U-tube quartz micro-reactor with a gas mixture of 5% (volume fraction) H2in Ar as the reductive gas. The catalyst (100 mg) was reduced by raising the temperature from room temperature to the reduction temperature (800 °C) at a heating rate of 10 °C∙min–1in 5% (volume fraction) H2in Ar flow (30 mL∙min–1). Field emission scanning electron microscopy (SEM) was conducted on a JEOL JSM-6300F microscope with an accelerating voltage of 20 kV. Thermal decomposition of the catalyst precursors was studied by the thermogravimetric (TG) method using a NETZSCH TG209F1 thermal analyzer. Measurements were performed in the temperature range of 30−800 °C at a heating rate of 10 °C∙min−1in a continuous flow of air (50 mL∙min−1).
The catalytic performance testing was conducted in a fixed-bed flow reactor. Before testing, 1.5 g of the powder catalyst was mixed with 3 g of 40−60 mesh silicon carbide and placed in the reactor. The calcined catalysts werereduced at ambient pressure in flowing syngas ((H2) :(CO) :(N2) = 65 : 32 : 3) with gas hourly space velocity (GHSV) of 3600 h−1. The temperature was raised from room temperature to 300 °C at a heating rate of 1 °C∙min−1. The activation process was maintained for 8 h at atmospheric pressure. Then the reactor was cooled down to 180 °C and the pressure was raised to 6.0 MPa with the syngas. The temperature was then increased to a given value with a ramp of 1 °C∙min−1. The gas flow was controlled through a calibrated Brooks mass flow controller and the reaction was conducted with a GHSV of 5000 h−1.
The tail gas was analyzed on-line by GC after passing through a hot trap (120 °C external) and a cold trap (ice-water mixture bath). H2and CO were analyzed through a TDX-1 carbon molecular sieves column with a thermal conductivity detector (TCD) using Ar as the carrier gas. N2, CO, CH4and CO2were analyzed under similar conditions with H2and CO except that He was used as carrier gas. C1to C10hydrocarbons were analyzed with hydrogen flame ionization detector (FID) through a modified alumina packed column with Ar as carrier gas. The aqueous products including liquid oil products and solid wax products, collected from cold trap and hot trap, were analyzed off-line by GC. The aqueous products were analyzed through two Porapak Q column equipped with TCD and FID, for H2O & MeOH and C1to C5oxygenates analyses, respectively. The liquid oil products were analyzed through a HP-1 column with N2carrier and FID as detector. The solid wax products were dissolved in CS2and analyzed through a MXT-1 column with N2carrier and FID. All the dates were collected after 24 h on-stream under reaction conditions until a steady state was reached. The mass balance and carbon balance were kept (100 ± 5)%.
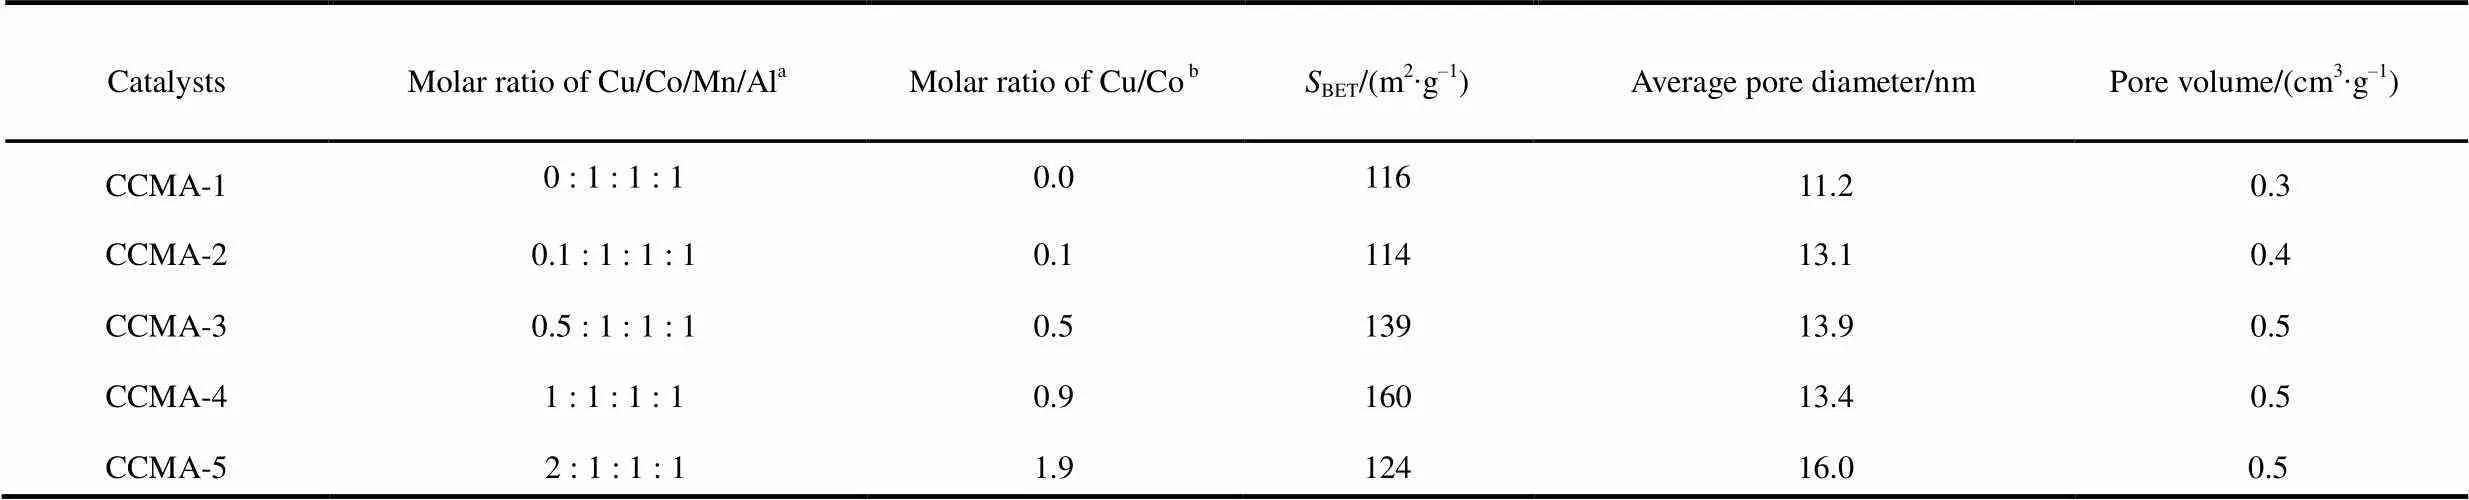
Table 1 Bulk composition and textural properties of catalysts.
aMolar ratio of Cu/Co/Mn/Alis theoretical ratio which was calculated from the initial precursor molar ratio.bMolar ratio of Cu/Co obtained by ICP-AES analysis.
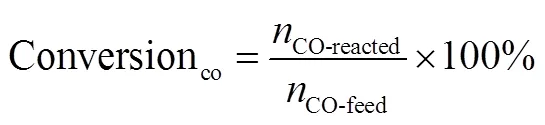
whereCOis the molar of CO,iis the weight of the i product,iis the molar of the i product, andiis the corresponding carbon atoms number of i product.
3 Results and discussion
3.1 Characterizations of catalyst
The actual metal compositionsof the calcined catalysts are listed in Table 1. The results of ICP-AES showed that the real bulk Cu/Co molar ratios of the catalysts were close to the theoretical value, suggesting the complete precipitation of Cu and Co cations.
The pore size distribution (Table 1) indicated that all samples possessed mesoporous characteristics with average pore size larger than 10 nm. The specific area and pore volume increased gradually with the increase of Cu/Co molar ratio and then began to decrease at Cu/Co molar ratio of 2.0, with maximum value at Cu/Co molar ratio of 1.0, suggesting the Cu/Co molar ratio affected the texture property of the catalyst.
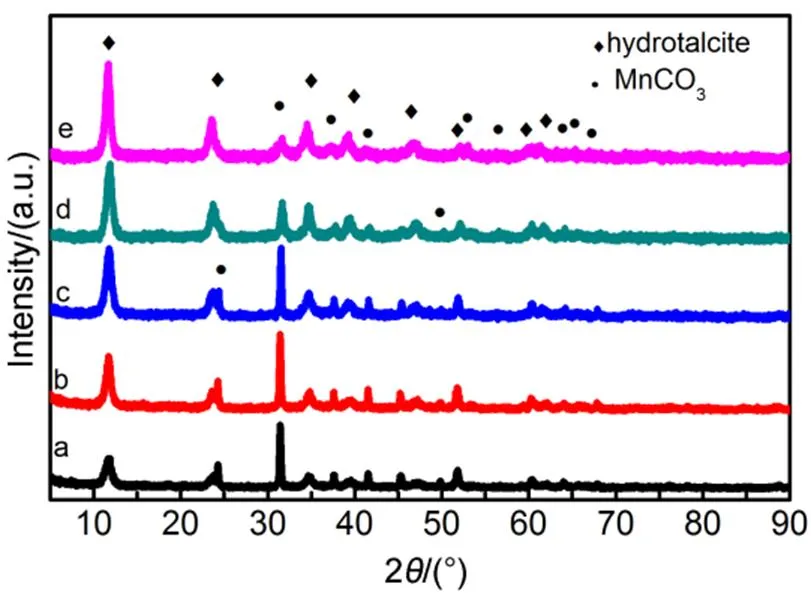
Fig.1 XRD patterns of the dried precursors.
(a) CCMA-1; (b) CCMA-2; (c) CCMA-3; (d) CCMA-4; (e) CCMA-5.
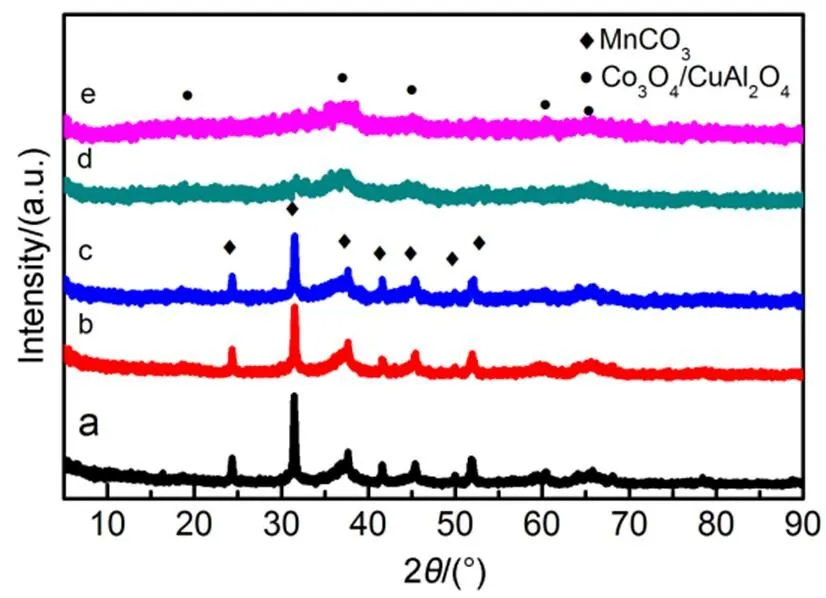
Fig.2 XRD patterns of the calcined catalysts.
(a) CCMA-1; (b) CCMA-2; (c) CCMA-3; (d) CCMA-4; (e) CCMA-5.
The XRD patterns of the precursors and calcined samples are shown in Fig.1 and Fig.2. It can be found from Fig.1 that the XRD patterns of the precursors show the main diffraction peaks at 2values of 12°, 24°, 36°, all of which are the characteristic diffraction peaks of typical hydrotalcite-like structure. The three strong sharp diffraction peaks correspond to the layered structure of (003), (006) and (009) crystal face diffraction31. The crystallinity of the samples increased with increase of Cu/Co molar ratio until the molar ratio of Cu/Co was greater than 1 : 1. In spite of the increased Cu content aggravated the Jahn-Teller effect, which led to the crystal lattice distortion of the hydrotalcite-like precursor. However, the increase of M2+/M3+ratio in a certain range was beneficial to the improvement of lattice regularity of the hydrotalcite-like precursor until M2+/M3+ratio exceeded the optimum proportion. The experimental results showed that when the molar ratio of Cu/Co was less than 1 : 1, the positive effect of M2+/M3+on crystallinity was stronger than that of the negative effect caused by crystal lattice distortion, which led to the gradual increase of crystallinity. Besides, other diffraction peaks assigned to MnCO3crystal (JCPDS card no. 99-0089) were also observed in Fig.1.
Fig.2 showed the XRD patterns of the samples after calcination. Clearly, the hydrotalcite-like structure was destroyed due to the calcination treatment since no characteristic reflections peaks of hydrotalcite-like structure were observed in the XRD patterns. CCMA-1, CCMA-2 and CCMA-3 presented more sharp diffraction peaks of MnCO3(JCPDS card No. 44-1472). While the other two catalysts mainly showed the diffraction peaks at 2of 32.4°, 38.7°, 45.1°, 60.2° and 65.7°, which maattribute to Co3O4(JCPDS card No. 42-1467) or spinel structures such as or CuAl2O4(JCPDS card No. 33-0448). This confused phenomenon is caused by the diffraction peaks of these three species appear almost overlap peak positions.
H2-TPR tests were performed to get an insight into reducibility of the catalysts and possible interaction among active components in the calcined samples32. The H2-TPR profiles of calcined samples are displayed in Fig.3. The reducibility was affected by the Cu/Co molar ratio for the catalysts. For CCMA-1 catalyst, three reduction peaks at 230, 358 and 618 °C were observed. The two peaks with relatively low temperature. (200−400 °C) was ascribed to reduction of Co components and the peak with highest temperature (500−700 °C) represented mainly reduction of Mn components. The low-temperature part consists of two reduction peaks associated with CoIIIto CoIIreduction followed by reduction of CoIIto Co033−35. Compared with CCMA-1, the reduction peaks of Co at CCMA-2 shifts to lower temperature, indicating the addition of a small amount of Cu promotes the reduction of cobalt oxides, and the peak around 433 °C was assigned to the reduction of Mn3O4to MnO36. In addition, Pei.37found that a new reduction peak at around 200 °C could be observed when Cu2+was introduced into CoMn catalytic system and attributed this new peak to the reduction of Cu2+to metallic Cu. Therefore, the low-temperature reduction peaks in CCMA-2 may also belong to the reduction of CuO to Cu. With further increase of Cu/Co molar ratio, the reduction temperature of the catalyst shifts to lower temperature, the reduction profiles of CCMA-(= 3−5) display a broad reduction peak with obvious shoulders in the temperature range of 100−250 °C. The peaks appearing in the lowest temperature were assigned to the reduction of CuO to metallic Cu, and the subsequent reduction from CuAl2O438. However, a little bit higher temperature is required for reduction of CCMA-5, which can be attributed to weakened regularity of lamellar structure derived from excessive copper doping characterized by SEM. Substantial numbers of Co species active sites were overlapped by excessive copper located outside the lamellar structure, which significantly increased the temperature required for the reduction of Co species. More Cu and Co being trapped in laminates,the interaction between Cu and Co enhances the required temperature of reduction39.
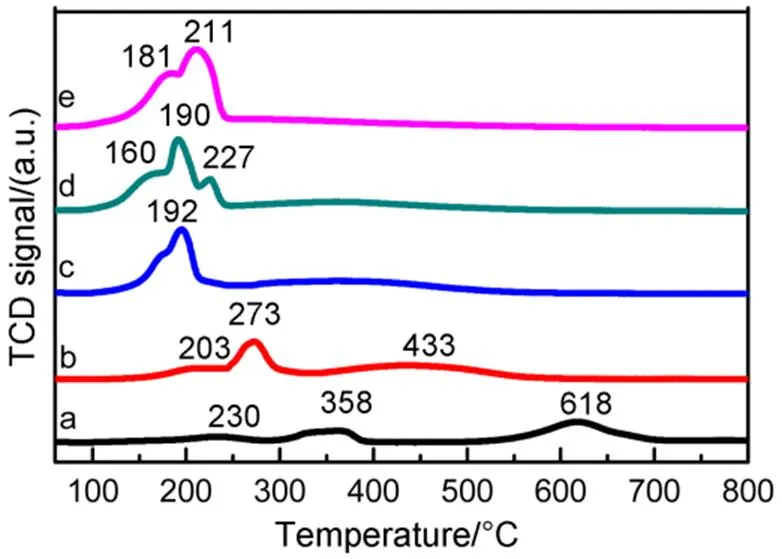
Fig.3 H2-TPR profiles of the catalysts.
(a) CCMA-1; (b) CCMA-2; (c) CCMA-3; (d) CCMA-4; (e) CCMA-5.
The morphology of dried precursors and calcined samples were investigated by SEM and the corresponding images are shown in Fig.4 and Fig.5. It can be seen that the precursors consist mainly of well-developed and thin plate-shaped crystals, indicating the formation of a layered structure. The precursors of CCMA-3 and CCMA-4 showed uniform crystal grain and well-defined layered structure, which is in accordance with the results of XRD, as revealed by the higher crystallinity of CCMA-3 and CCMA-4 than CCMA-1, CCMA-2 and CCMA-5. Fig.5 exhibited the SEM images of the catalysts after calcination. It can be seen that layered structure was destroyed after the heat treatment process to some extent with occurrence of agglomeration.
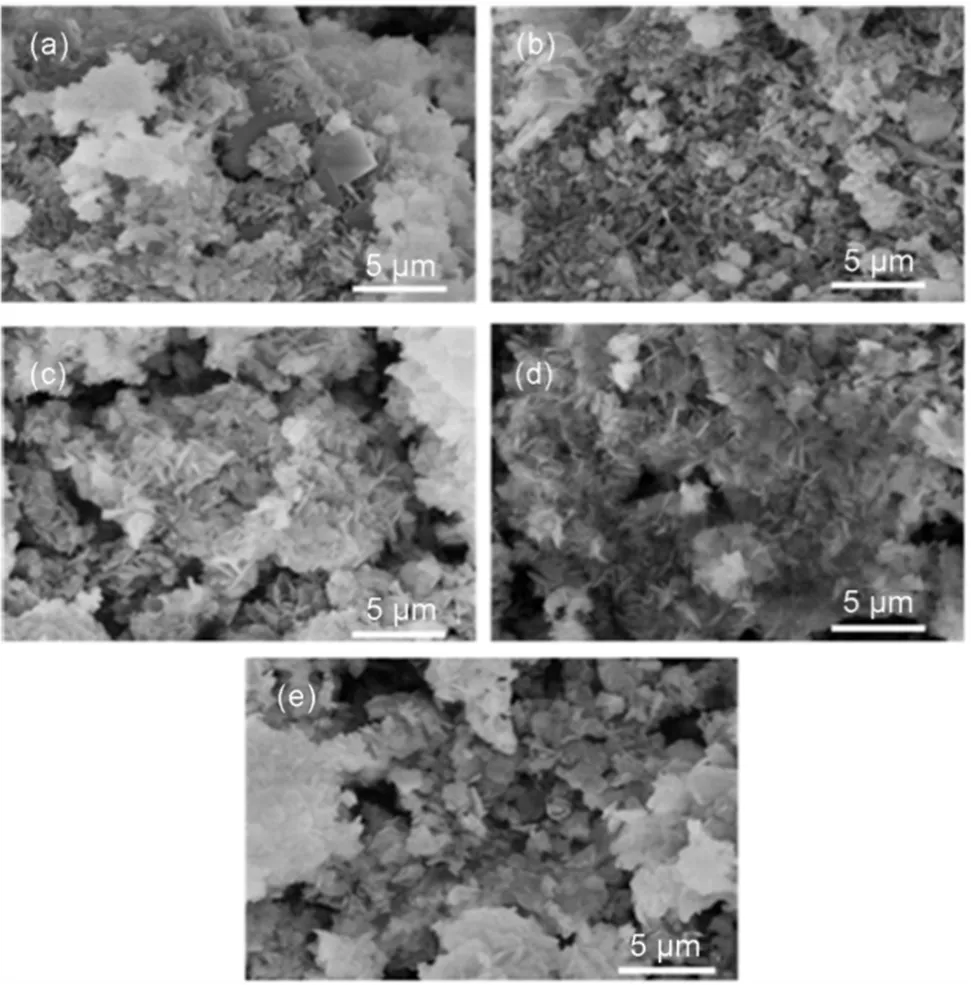
Fig.4 SEM images of uncalcined samples.
(a) CCMA-1; (b) CCMA-2; (c) CCMA-3; (d) CCMA-4; (e) CCMA-5.
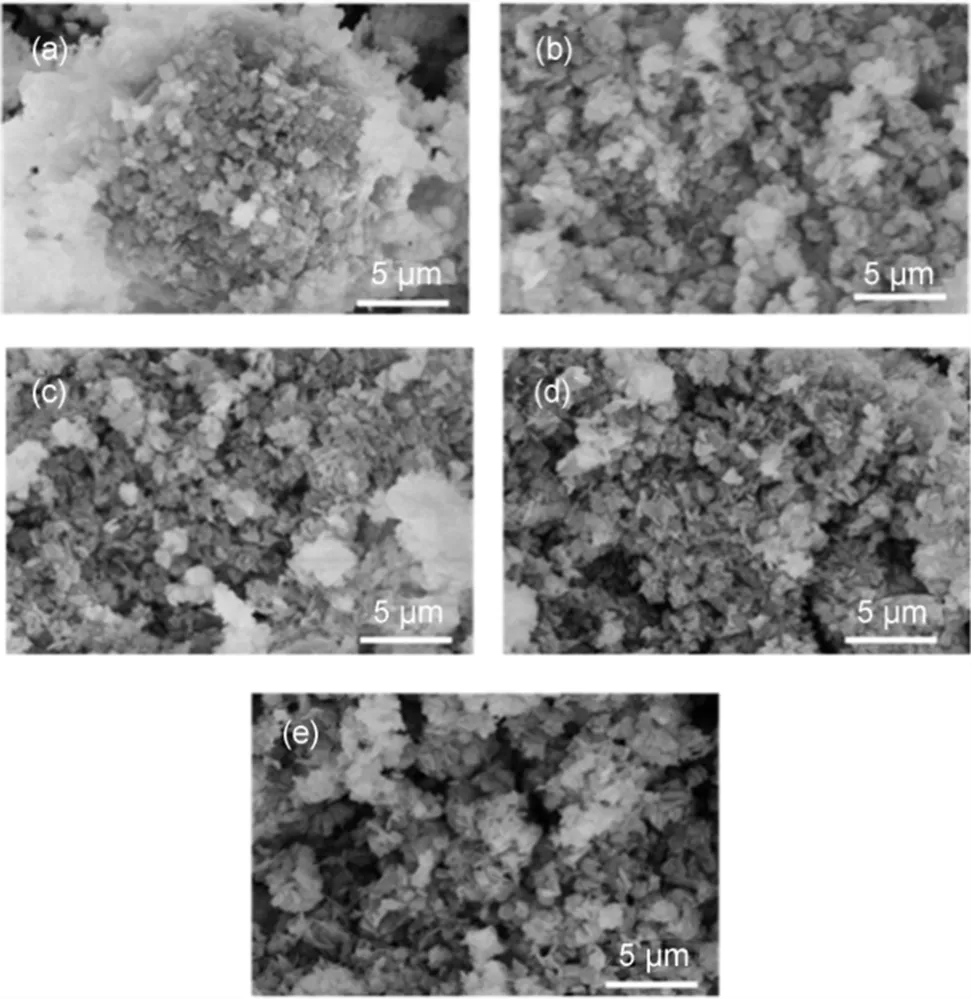
Fig.5 SEM images of uncalcined samples.
(a) CCMA-1; (b) CCMA-2; (c) CCMA-3; (d) CCMA-4; (e) CCMA-5.
The crystalline structures of calcined and reduced samples were further confirmed by HRTEM measurements. Fig.6 displayed the HRTEM micrographs of the calcined samples. In these images, the Mn species mainly existed in the form of MnCO3, and Co mainly existed in the form of Co3O4. In addition, Cu and Al almost presented as CuAl complex metal oxides. These results were consistent with the experiment of XRD. Fig.7 presented the HRTEM pictures of the reduced samples. As illustrated in Fig.7 of the samples after reduction, Co species mainly existed in the form of CoO in CCMA-1 without the addition of Cu. When the content of Cu increased, the interface of CuAlO2and CoO could be observed. However, further increase the proportion of Cu/Co to 2, the interface mentioned above disappeared owing to the aggregation of Cu species.
Fig.8 presented the weight losses and the weight loss rates of catalyst precursors during calcination process. Thermal decomposition temperature of each steps were marked in Fig.8. In general, the thermal decomposition of the catalyst precursors consists three steps. The first step at 100−200 °C can be assigned to the elimination of physically adsorbed water and the remove of the interlayer water molecules. Subsequently, the second weight loss at 200−350 °C may ascribed to the removal of both the hydroxyl groups from the HTl network and carbonate anions from the interlayer anion, resulting in the collapse of the layered structure40−42. A progressive weight loss was then observed between 350 and 500 °C, which can be attributed to the decomposition of mental oxocarbonates formed during the former steps of the thermal decomposition of the HTl structure43,44. The TG-DTG profiles in Fig.8 showed that the introduction of a small amount of Cu2+does not change the structure of hydrotalcite, and the thermal stability of CCMA-2 does not change obviously. With the increase of Cu content, a decrease of the decomposition temperatures for second step can be observed (e.g., CCMA-1: 233 °C; CCMA-2: 234 °C; CCMA-3: 208 °C; CCMA-4: 204 °C; CCMA-5: 204 °C), which reflected a gradual decrease of the thermal stability of the precursors from CCMA-1 to CCMA-5. Gao.45proposed that the introduction of Cu2+into a layered structure might decrease the strength of hydrogen bonds between water molecules and interlayer anions, and thus reduce the electrostatic interaction between the layers and the anions, which then would lead to lower the decomposition temperatures for the second step and the thermal stability.
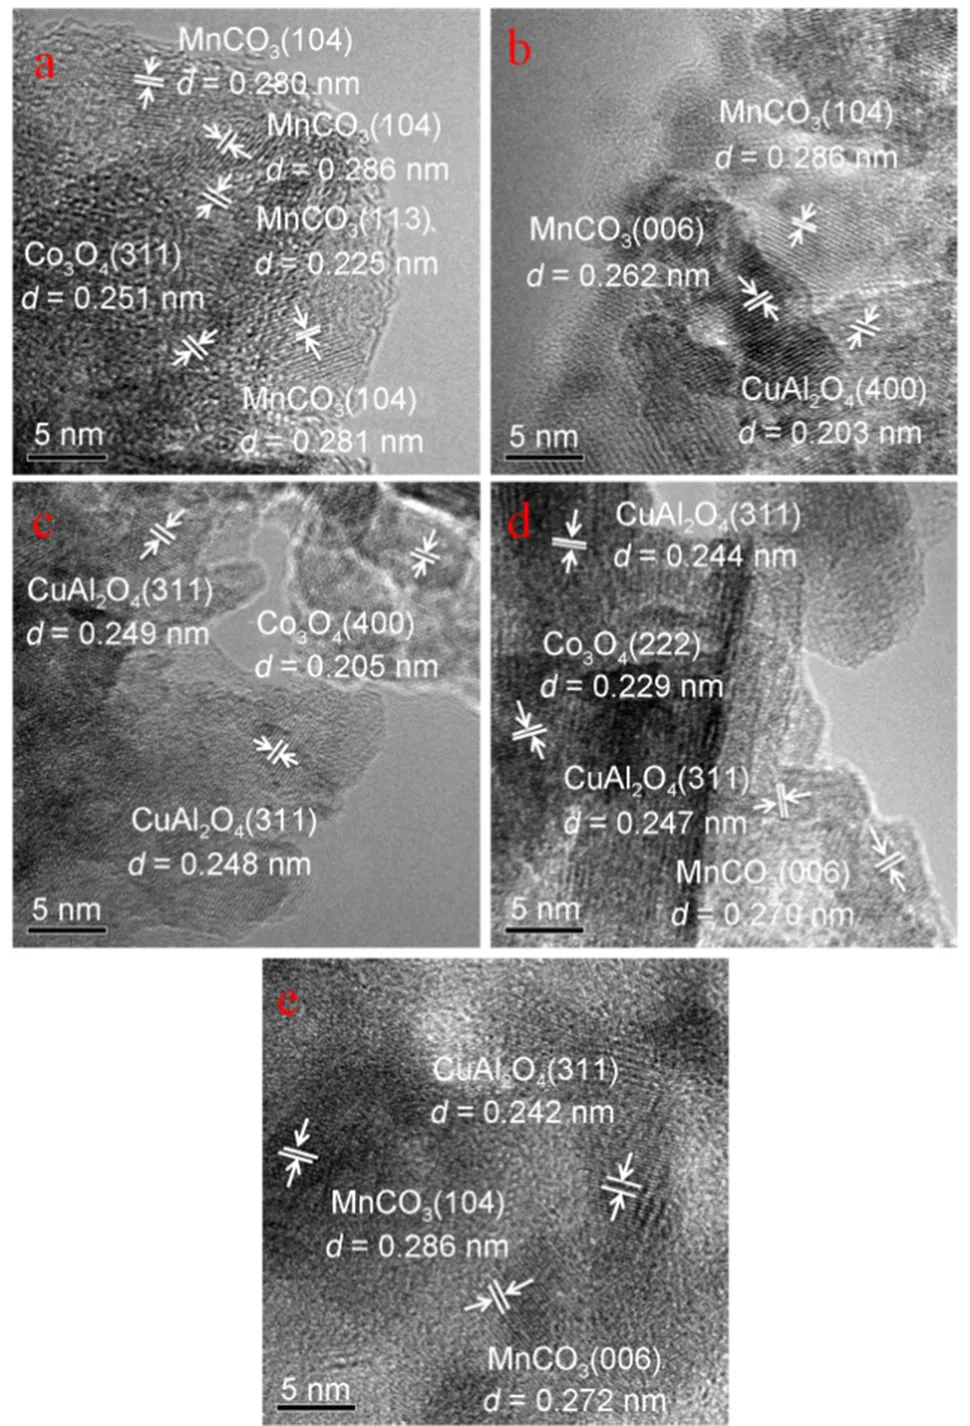
Fig.6 HRTEM images of calcined samples.
(a) CCMA-1; (b) CCMA-2; (c) CCMA-3; (d) CCMA-4; (e) CCMA-5.

Fig.7 HRTEM images of reduced samples.
(a) CCMA-1; (b) CCMA-2; (c) CCMA-3; (d) CCMA-4; (e) CCMA-5.
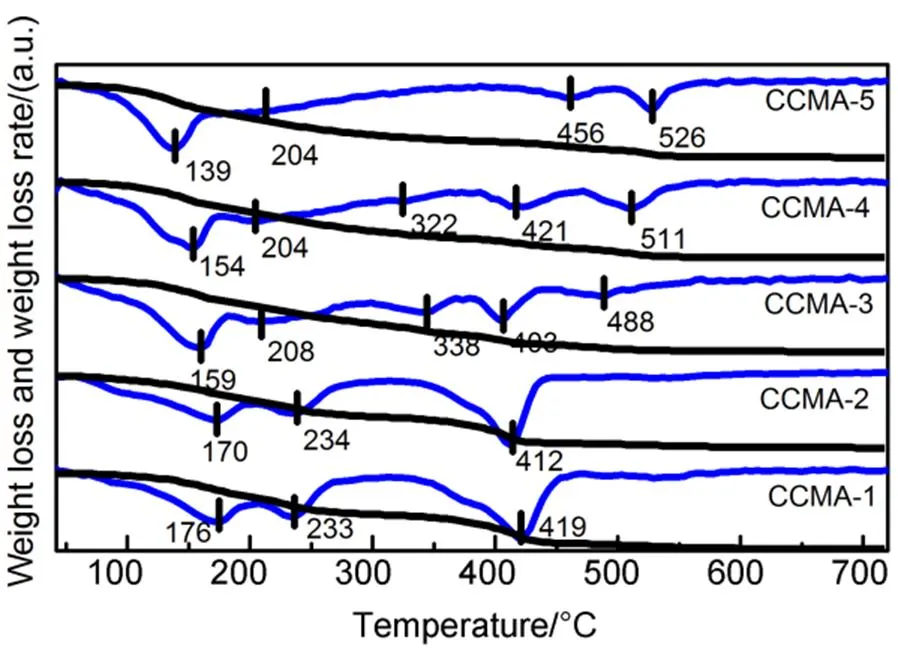
Fig.8 Thermogravimetry and differential thermogravimetry (TG-DTG) profiles of precursors in air.
3.2 Catalytic performances
The catalytic performance of Cu/Co/Mn/Al catalysts with the different Cu/Co molar ratios for higher alcohols synthesis was summarized. As shown in Fig.9, the CO conversion presented the trend of increased first and then decreased, and reached the maximum when the Cu/Co molar ratio was 0.1, implying that the presence of Cu promoted the CO conversion, which could be attributed to the improvement of crystallinity, calcined catalysts with the doping of Cu.
The selectivity to CO2had the similar trend to that of the CO conversion and reached the maximum (60.11%) when the ratio of Cu/Co molar ratio was 0.1, which could be ascribed to that adding appropriate amount of Cu was conducive to the water gas shift reaction so as to produce more CO2. When the doping amount of Cu was at relatively low level, the selectivity to alcohols and hydrocarbons decreased significantly until the Cu/Co molar ratio rose to 0.1 (Fig.(10)). With the further increase of Cu/Co molar ratio, the alcohol selectivity showed a trend of first increase to the maximum (35.9% ()) then decrease and the hydrocarbon selectivity increased, indicating that the Cu/Co molar ratio in the range of 0.1 to 1 was propitious to promote the formation of both the alcohol and hydrocarbon. Whatʹs more, the STY of alcohol reached the maximum when the Cu/Co molar ratio was 0.5.
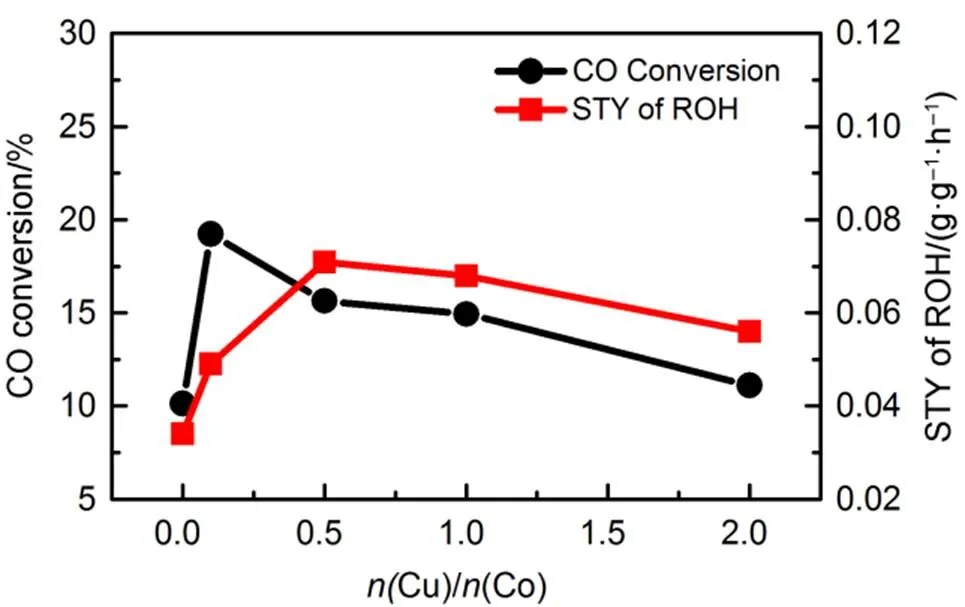
Fig.9 CO conversion and the space-time yield.
areaction conditions:= 250 °C,= 6 MPa, GHSV = 3600 h−1,(H2) :(CO) :(N2) = 65 : 32 : 3.bROH: total alcohol including methanol.

Fig.10 The products selectivity of ROH and CHn with Cu/Co molar ratio change.
areaction conditions:= 250 °C,=6 MPa, GHSV=3600 h−1,(H2) :(CO) :(N2) = 65 : 32 : 3.bCHn: total hydrocarbons including methane; ROH: total alcohol including methanol.
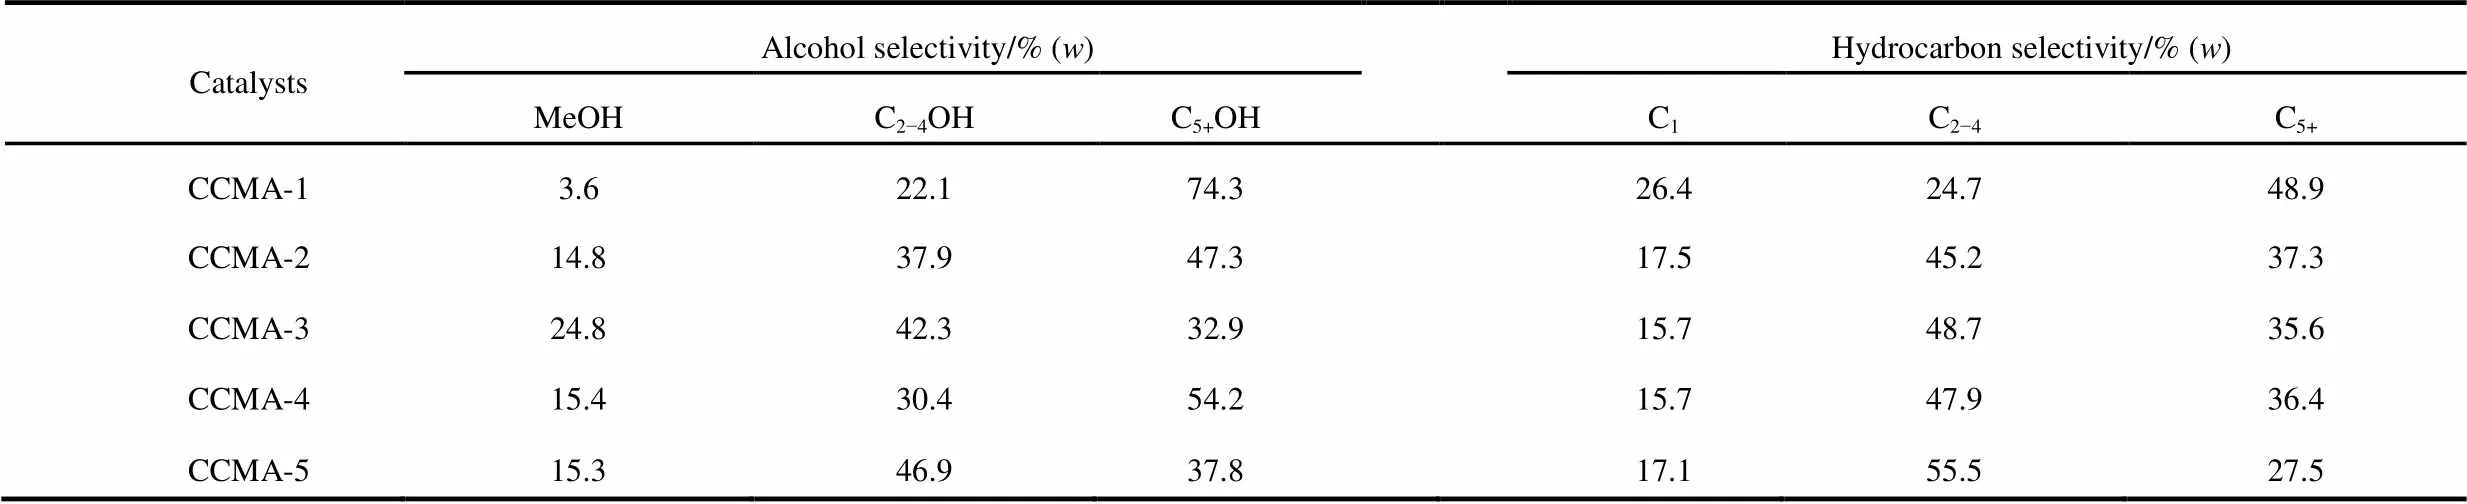
Table 2 Selectivity toward products with different Cu/Co ratio catalystsa.
areaction conditions:= 250 °C,= 6 MPa, GHSV = 3600 h−1,(H2) :(CO) :(N2) = 65 : 32 : 3
As illustrated in Table 2, the selectivity to CH4decreased with the increase of Cu/Co molar ratio until the Cu/Co molar ratio reached 1. Further increase of Cu/Co molar ratio had a positive impact on the selectivity to CH4. Illustrated that when the Cu/Co molar ratio increased from 0.1 to 1 would promote the formation of higher hydrocarbon. Whatʹs more the introduction of Cu brought about the increase of methanol selectivity and the decrease of C6+OH selectivity. Fig.11 showed that the STY distribution of alcohols with Cu/Co molar ratio change. It could be seen that the CH3OH and C2−4OH yield increased with the Cu/Co molar ratio rose to 0.5. The STY of methanol increased from 0.001 g·g−1·h−1to 0.018 g·g−1·h−1and the STY of C2−4OH from 0.007 g·g−1·h−1up to 0.028 g·g−1·h−1. When the Cu/Co molar ratio was in the range of 0 to 0.5, the doping of Cu coulpromote the alcohols formation, especially for the low-carbon alcohols. With the further increase of the molar ratio of Cu/Co, the STY of CH3OH and C2−4OH began to decrease, probably due to the excess presence of Cu covered part of Co active site.
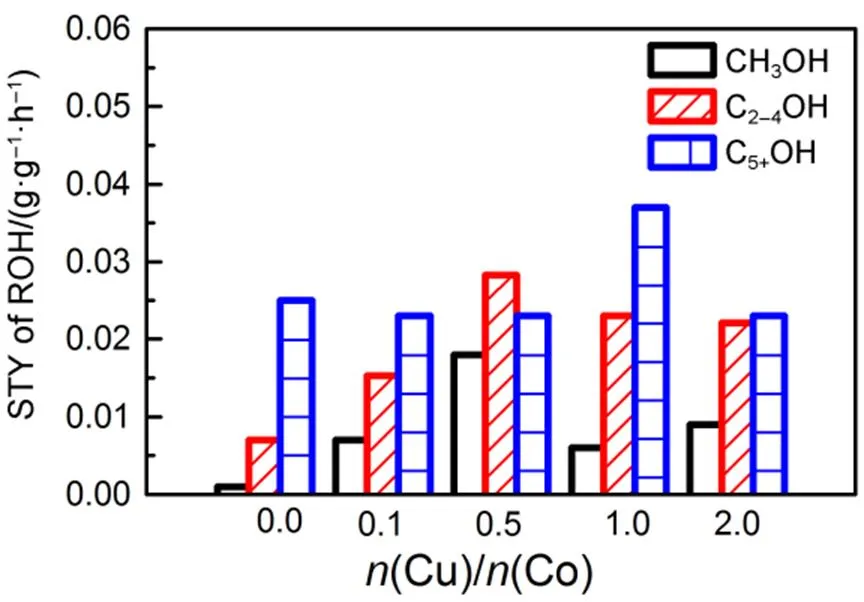
Fig.11 The STY of alcohols with Cu/Co molar ratio change.
The rule mentioned above was consistent with the chain growth factor in Table 3. When the Cu/Co molar ratio was in the range of 0.1−1, the doping of Cu could promote the chain growth in the reaction which produce hydrocarbon. However, further increase in Cu/Co molar ratio would hinder the formation of higher hydrocarbon. With the gradual introduction of Cu, the Cu-Co interface was gradually increased and highly dispersed until the regularity of the layered structure reached optimum, which favored the formation of higher hydrocarbons. However, the further introduction of Cu exacerbated the Jahn-Taller effect and crystal lattice distortion. The destruction of the lamellar structure and the reduction of the active interface hindered the formation of higher hydrocarbons. In summary, when Cu/Co molar ratio reached 0.5, the regularity of the layered structure and the interface effect of CuCo were improved, which were helpful to increase the selectivity to methanol and higher hydrocarbon.

Table 3 Growth factorsa for alcohols and hydrocarbons of catalysts with different Cu/Co molar ratios.
an/=α−1(1−)2.
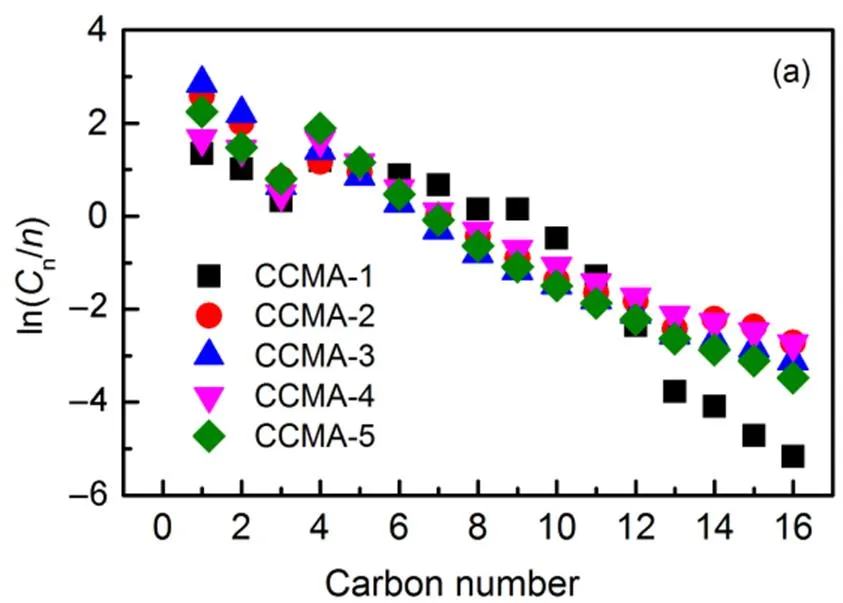
is the number of carbon atoms in a product,Cis the molar fraction of a product withnumber of carbon atoms.
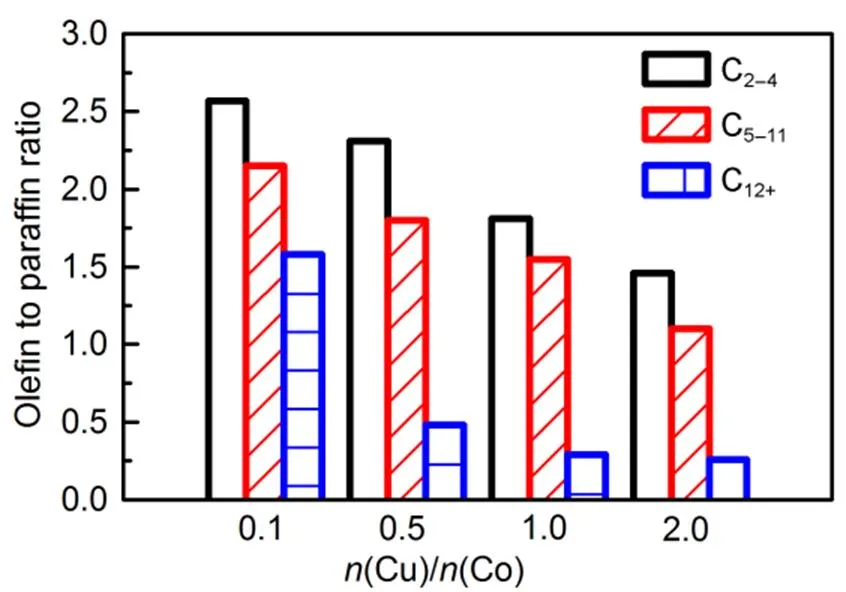
Fig.13 Olefin to paraffin ratio over catalysts.
The products distributions are shown in Fig.12. The alcohols and hydrocarbons obeyed Anderson-Schulz-Flory (ASF) carbon number distributions as the yield of each alcohol and hydrocarbon in the products decreased with the increasing carbon chain. The olefin to paraffin ratios (O/P) over Cu/Co/Mn/Al catalysts with varying molar ratio of Cu/Co is presented in Fig.13. The O/P ratios decreased gradually with the increase of atomic ratio of Cu/Co46,47, which may be ascribed to the enhanced hydrogenation capability of Cu/Co/Mn/Al catalysts48.
4 Conclusions
In summary, a series of Cu/Co/Mn/Al catalysts derived from hydrotalcite-like precursors with different molar ratio of Cu/Co were prepared and the Cu/Co molar ratio of Cu/Co/Mn/Al catalysts was found to exert great effect on the structure and performance of catalyst.
1. With the increase of copper content, the lamellar structure of precursors was changed. Surface area, thermal stability, reducibility, dispersion of Cu and morphology were affected by the change of the CuCo interaction.
2. Different Cu/Co molar ratios have significant effect on the alcohol selectivity and distribution of products. When Cu was introduced, the CO conversion significantly increased. With further increase of Cu/Co molar ratio from 0.1 to 0.5, the alcohol selectivity and STY of alcohol enhanced simultaneously. When Cu/Co molar ratio is 0.5, provides the highest alcohol selectivity up to 35.9% () and STY of alcohol reach 0.071g·g−1·h−1. While when the Cu/Co molar ratio more than 1, the further increase of Cu content would decrease both the C5+alcohol and C5+hydrocarbon, so that inhibited the growth of the chain. The Cu/Co molar ratio also impose great impact on the olefin to paraffin ratios (O/P), the olefin to paraffin ratios (O/P) decrease with the increase of Cu/Co molar ratio, indicating the enhanced hydrogenation capabilities as the Cu/Co molar ratio increased.
3. The lamellar structure catalyst CCMA-3 ((Cu) :(Co) = 0.5), which possessed highest alcohol selectivity and yield.
(1) Pan, X. L.; Fan, Z. L.; Chen, W.2007,, 507. doi: 10.1038/nmat1916
(2) Spivey, J. J.; Egbebi, A.2007,, 1514. doi: 10.1039/b414039g
(3) Subramani, V.; Gangwal, S. K.2008,, 814. doi: 10.1021/ef700411x
(4) Gupta, M.; Smith, M. L.2011,, 641. doi: 10. 1021/cs2001048
(5) Fang, K. G.; Li, D. B.; Lin, M. G.2009,, 133. doi: 10.1016/ j.cattod.2009.01.038
(6) Choi, Y. M.; Liu, P.2009,, 13054. doi: 10.1021/jacs.5b12087
(7) Prieto, G.; Concepción, P.2011,, 274. doi: 10.1016/j.jcat.2011.03.025
(8) Yang, N. Y.; Medford, A. J.; Liu, X.Y.2016,, 3705. doi: 10.1021/jacs.5b12087
(9) Sun, J.; Wan, S. L.; Wang, F.2015,, 7841. doi: 10.1021/acs.iecr.5b01927.
(10) Epling, W. S.; Minahan, D. M.1998,, 175. doi: 10.1006/jcat.1998.2005
(11) Xu, M. T.; Gines, M. J. L.; Hilmen, A. M.1997,, 130. doi: 10.1006/j cat.1997.1777
(12) Xiang, M. L.; Li, D. B.; Li, W. H.2007,, 503. doi: 10.1016/j.catcom.2006.08.049
(13) Shou, H.; Ferrari, D.2012,, 1408. doi: 10.1021/cs300083b
(14) Thao, N. T.; Niaki, M. H. Z.2007,, 348. doi: 10.1016/j.jcat.2006.10.026
(15) Subramanian, N. D.; Balaji, G.2009,, 100. doi: 10.1016/ j.cattod.2009.02.027
(16) Xu, H. Y.; Chu, W.; Deng, S. Y.2010,, 345. [徐慧远, 储 伟, 邓思玉. 物理化学学报, 2010,, 345.] doi: 10.3866/PKU.WHXB20100228
(17) Xiao, K.; Qi, X. Z.2013,, 1591. doi: 10.1039/c3cy00063j
(18) Wang, J. J.; Chernavskii, P. A.2012,, 51. doi: 10.1016/j.jcat. 2011 .10.012
(19) Yang, Y. Z.; Qi, X. Z.; Wang, X. X.2016,, 101. doi:10.1016/ j.cattod.2015.06.014
(20) Prieto, G. Z.; Beijer, S.2014,, 6397. doi: 10.1002/ anie.201402680
(21) Liu, Y. J.; Zuo, Z. J.2016, 144, 186. doi: 10.1016/ j.fuproc.2016.01.005
(22) Xiang, Y. Z.; Chitry, V.2013,, 7114. doi: 10.1021/ ja402512r
(23) Duan, X.2014,, 7040. doi: 10.1039/ c4cs00160e
(24) Gao, W.; Zhao, Y. F.; Liu, J. M.2013,, 324. doi: 10.1039/ c3cy00025g
(25) Grey, C. P.2008,, 113. doi: 10.1126/science. 1157581.
(26) Ma, K. Y.; Cheng, J. P.2016,, 277. doi: 10.1016/j.jallcom.2016.04.059
(27) Yuan, Z.; Wang, L.; Wang, J.2011,, 431. doi: 10. 1016/j.apcatb.2010.10.013
(28) Xia, S.; Nie, R.; Lu, X.2012,, 1. doi: 10.1016/j.jcat.2012.12.008.
(29) Anton, J.; Nebel, J.2015,, 326. doi: 10.1016/ j.apcata.2015.07.002
(30) Su, J. J.; Zhang, Z. P.2016,, 94. doi: 10.1016/j.jcat.2016.01.015
(31) Gao, P.; Li, F.; Zhan, H. J.2013,, 51. doi: 10. 1016/j.jcat.2012.10.030
(32) Wang, J. J.; Chernavskii, P. A.2012,, 51. doi: 10.1016/j.jcat.2011.10.012
(33) Deng, S. Y.; Chu. W.2008,, 369
(34) Alejandre. A.; Medina, F.; Salagre, P.1999,, 939. doi: 10.1021/ cm980500f
(35) Smith, M. L.; Campos. A.; Spivey, J. J.2012,, 60. doi: 10.1016 /j.cattod.2011.07.026
(36) Frantisek, K.; Tomas, R.; Jana, D.2006,, 812. doi: 10.1016/j.jssc.2005.12.004
(37) Pei, Y.; Jian, S.; Chen, Y.2015,, 76330. doi: 10.1039/c5ra10804g
(38) Byoung, K. K.; Dae, S. P.; Yang, S. Y.2012,, 90. doi: 10.1016/j.catcom.2012.03.029
(39) Ning, X.; An. Z.; He. J.2016,, 236. doi:10.1016/j.jcat.2016.05.014
(40) Xu, Z. P.; Zeng, H. C.2000,, 10206. doi: 10.1021/jp001963n
(41) Cheng. J.; Yu. J. J.; Wang. X. P.2008,, 2131. doi: 10.1021/ cs200294d
(42) Velu, S.; Sabde, D. P.1998,, 3451. doi: 10.1021/cm980185x
(43) Trujillano, R.; Holgado. M.2006,, 267. doi: 10.1103/Phys.RevB.73.012203
(44) Behrens. M.; Kasatkin. I.2010,, 386. doi: 10.1021/cm9029165
(45) Gao, P; Yang, H.J. CO Util.2016,, 32. doi: 10.1016/j.jcou.2016.06.001
(46) Cheng, X. F.; Wu, B. S.2010,, 103. doi: 10.1016/ j.molcata.2010.06.024
(47) Laan, G. P. V.1999,, 255. doi: 10.1081/CR- 100101170
(48) Matsuzaki, T.; Takeuchi, K.; Hanaoka, T.1996,, 251. doi: 10.1016/0920-5861(95)00245-6
Cu含量对以水滑石为前驱体的Cu/Co/Mn/Al催化剂高级醇合成性能的影响
廖珮懿1,2张 辰1,2张丽君1杨彦章2钟良枢2郭晓亚1王 慧2,*孙予罕2
(1上海大学环境与化学工程学院,上海 200444;2中国科学院上海高等研究院,上海 201210)
采用共沉淀法制备了一系列不同铜钴摩尔比(0, 0.1, 0.5, 1.0, 2.0)的Cu/Co/Mn/Al层状结构催化剂并考察了其在合成气制混合醇反应中的催化性能,采用N2物理吸脱附、电感耦合等离子体原子发射光谱法(ICP-AES)、X射线衍射(XRD)、扫描电子显微镜(SEM)、氢气程序升温还原(H2-TPR),热重分析(TG)和高分辨透射电子显微镜(HRTEM)等对催化剂进行了表征分析。结果表明,适当的铜钴摩尔比可以增大催化剂的比表面积,提高催化剂的还原性能,并能形成较规整的层状结构从而提供更均一分散的合成醇活性位,从而提高催化活性和醇选择性。当铜钴摩尔比为0.5时,得到最高的醇时空产率(STY)和醇质量选择性,分别为0.071 g∙g−1∙h−1和35.9%。
高级醇合成;水滑石前驱体;Cu/Co/Mn/Al催化剂;铜钴摩尔比;合成气转化
O643
10.3866/PKU.WHXB201704143
December 28, 2016;
March 27, 2017;
April 14, 2017.
Corresponding authors.WANG Hui: Email: wanghh@sari.ac.cn; Tel: +86-13917459728. SUN Yu-Han: Email: yhsun@sari.ac.cn; Tel: 021-20325009.
The project was supported by the National Natural Science Foundation of China (21403278), China Shenhua Coal to Liquid and Chemical Company Limited, Shanxi Luʹan Coal Corporation Limited, and Shell Global Solutions International B. V.
国家自然科学基金(21403278),神华集团有限责任公司,山西潞安矿业(集团)有限责任公司,和荷兰皇家壳牌集团资助项目