CO2 and NH3 emissions and water consumption at mechanically ventilated finishing pig house in Beijing equipped with pull-plug manure removal system
2017-11-01WangMeizhiLiuJijunZhaoWanyingChenZhaohuiRenKangCuiXiaodongWangGangWuZhonghong
Wang Meizhi, Liu Jijun, Zhao Wanying, Chen Zhaohui, Ren Kang, Cui Xiaodong, Wang Gang, Wu Zhonghong
CO2and NH3emissions and water consumption at mechanically ventilated finishing pig house in Beijing equipped with pull-plug manure removal system
Wang Meizhi1,2, Liu Jijun1,2, Zhao Wanying1,2, Chen Zhaohui1,2, Ren Kang3, Cui Xiaodong3, Wang Gang4, Wu Zhonghong1,2※
(1.100193; 2.100193,; 3.100029,; 4.,,100012,)
In the present study a field experiment was conducted to quantify CO2and NH3emissions and water consumption from 25thJuly, 2015 to 11thAugust, 2015 (18 days) during summer in a finishing pig house in Beijing equipped with a pull-plug manure removal system and a curtain tunnel mechanical ventilation system. NH3emission rates were (23.4±11.0) g/(d·500 kg), and NH3emission rates ranged from 4.3 to 49.5 g/(d·500 kg). Ammonia emission rates at 08:00 and 14:00 were significantly higher than those at 10:00, 12:00, 16:00 and 18:00 (<0.001), presumably due to manure removal by workers lowering emissions. The average CO2emission rate was (2.73±0.78) g/(d·500 kg), and maximum and minimum rates were 5.00 and 1.00 g/(d·500 kg), respectively. The average daily mean emission rate with a maximum frequency of 44% was 2.5-3 g/(d·500 kg), and around 92% of average daily emission rates were less than 4.0 kg/(d·500 kg). Daytime CO2emissions peak was at 12:00. Maximum, minimum and average water consumption rates including the water pad on a per pig per day basis were 90.0, 19.6 and 47.0 L/(d·pig), respectively. These results establish baseline CO2and NH3emissions and water consumption values for pig production facilities of this type in China.
carbon dioxide; emission control; ammonia; mechanically ventilated system; finishing pig house; pull-plug manure removal; water consumption
0 Introduction
Agriculture, forestry, and other land use sectors were responsible approaching a quarter (10-12 Gt/a) of anthropogenic greenhouse gas (GHG) emissions, mainly from deforestation and agricultural emissions from livestock, soil and nutrient management[1]. Animal agriculture was an important source of GHG emissions[2], and CO2was the dominant source of GHG[3]. There were three main sources of CO2from pig houses. In addition to the exhalation of animals[4]and release from manure[5], combustion heaters using propane, natural gas and coal were used in colder regions and emit CO2. Animal respiration was by far the greatest source of CO2emissions associated with pig production and the rearing of other animals, and accounted for 50% to 60% of carbon intake. Emissions of methane (CH4) from pig production were primarily derived from manure, and the amounts derived from the animals directly were minor in comparison[6]. Carbon dioxide was not only the main source of GHG, but was also a toxic gas that affected people living in the surrounding areas[7]. Carbon dioxide could be used as a tracer gas estimating ventilation in pig houses[8].
Intensive pig operations were a major source of atmospheric ammonia (NH3)[9]that readily reacted with other substances in the atmosphere to form ammonium (NH+4). Following emission, ammonia would be deposited on land and in water bodies in areas surrounding livestock operations, which could have profound effects on natural ecosystems[10]. However, NH3could also enhance the scattering of incoming solar radiation and contribute to atmospheric cooling[11]by altering the physical properties of aerosols[12]and clouds[13]. Ammonia was also a toxic gas that irritated the respiratory tract at concentrations exceeding 15×10-6[14], and it contributed to the formation of atmospheric haze in some areas such as Beijing, in which peak levels were recorded in 2013. In addition to Beijing, Tianjin and Hebei provinces, haze was now an issue in Southern China. Recentand animal studies showed that the combined exposure to air pollutants and allergens would have a synergistic or additive effect on asthma and allergies[15]. Furthermore, substantial epidemiological evidence now suggested that fine particulate matter (PM2.5) was associated with an increased risk of cardiovascular outcomes[16-17]. Ammonia was also an important pollutant gas that accelerated fine particulate formation in the atmosphere, and contributed to indirect emissions of nitrous oxide[2]. In 2014, the number of pigs in China was estimated to be 465.827 million, with 1.796 million in Beijing alone[18]. In China, hardly any livestock farms had in place adequate land and infrastructure for directly disposing of manure and utilizing wastewater, and this was an increasing problem that put pressure on pig production. Since the 1980s, pig farms in Beijing had utilized periodic ‘flush’ or deep-pit manure storage systems for waste removal, but the cost of energy had prevented most pig farmers from achieving adequate ventilation, which had resulted in poor indoor air quality in pig houses and consequent effects on the vision and respiratory capacity of workers. In addition, Beijing experienced regular water shortages, and many pig farms lacked sufficient land to apply manure and wastewater. From 2013 to 2015, “flush” and deep-pit manure storage systems had been remolded into dry removal manure systems through subsidies from local government[19]. Due to the increasing of labor costs, the removal of dry manure by workers was being replaced by automatic scrapers and pull-plug systems, but some systems had no pit fan ventilation included.
The objectives of the present study were to quantify CO2and NH3emissions and water consumption during the summer in a finishing pig house equipped with a pull-plug manure removal system and curtain tunnel mechanical ventilation system, but no pit fan ventilation in a pig farm in Beijing, China. The results were compared with the existing literature to determine the reduction potential of CO2and NH3emissions and water consumption. The results would establish baseline CO2and NH3emissions and water consumption values for swine production in China.
1 Material and methods
1.1 Experimental pig house characteristics
A finishing pig house with dimensions of 60.4×8.9× 3.55 m3(L×W×H) was selected as the monitoring site in Daxing District, Beijing, China. The house ceiling height was 2.5 m and the ceiling material was steel. The pig house was oriented west to east. Pens were separated by solid metal railing and the dimension of each pen was 7.40 m (L)× 4.70 m (W)×1.0 m (H).There were 20 windows in the south wall and 20 windows in the north wall, each of which was 1.5 m wide and 1.5 m high, and all windows were made of plastic and steel with a single glass pane. There was one door in the east wall of the house. The four walls of the finishing pig house were made of 240 mm wide bricks, and the roof was made of 100 mm thick colored steel laminboard.
Two thirds of the floor of each pen was fully slatted, and one third was solid concrete. The opening ratios of the fully slatted floor were 19%. Workers cleaned manure on the solid floor, and allowed it to fall through the slats into the manure pit below twice per day. Manure was generally removed between 08:00 and 08:30 in the morning, and between 14:00 and 14:30 in the afternoon. There were two bowl drinkers and one feeder in each pen, and an inspection alley of 1.0 m wide. Underneath the fully slatted floor, four manure pits with deep of 0.7 m were built for the 12 pens. Manure was emptied using the pull-plug system when the manure pit was nearly full. Pigs were moved into the pig house on 20thJuly, 2015 after the floor was flushed with water for one week, and the volume of the water flushed into the manure pit was 12.08 m3according to the water meter readings.
There were four single-speed ventilation fans in the western wall of the pig house, consisting of two model APP-36FCCN fans (Fan 1 and Fan 4) and two model APP-24FCCN fans (Fan 2 and Fan 3), all of which were manufactured by the GSI Group in Shanghai, China. In the east wall of the pig house, there was a water pad, which was 3.9 m wide, 1.8 m high and 0.15 m thick. During the experimental period, all four fans were on continuously and the water pad was watered from 10:00 to 18:00 every day.
1.2 Animals and feed
The experimental pig house could accommodate about 408 pigs. For this trial, 97 Large White or Landrace finishing pigs were moved in the house on 20thJuly, 2015. Pigs were placed in 10 of the 12 pens at a density of 10 pigs per pen. The two pens in the east and west ends were not used. The average body weight of the finishing pigs was 110 kg per pig when they were moved into the test house and the end body weight was 122.6 kg per pig. Feed and water were supplied. The diet shown in Table 1 was fed throughout the experimental period.

Table 1 Composition of experimental diet %
1.3 Measurements
1.3.1 Fan ventilation rate
To obtain the ventilation rate of the 2 types of fans in the experimental pig house, 2 simple test systems were used to measure airflow. 5 anemometers were moved up and down manually, and test systems of fan 1 and 2 were placed downstream of fan 1 and 2, respectively. The fan 1 test system consisted of a 1 080 mm (width) × 1 150 mm (height) × 550 mm (thickness) galvanized sheet base frame, a 1 080 mm (width)×1 150 mm (height)×200 mm (thickness) anemometer mounting frame, and a horizontal rack made from 15 mm × 15 mm square aluminum tube that contained the 5 anemometers. Anemometers were moved up and down at a distance of 39 cm from the blades, and were positioned 9 cm away from the downstream frame border. The Fan 2 test system consisted of a 780 mm (width) × 800 mm (height) × 350 mm (thickness) galvanized sheet base frame and a 780 mm (width) × 800 mm (height) × 200 mm (thickness) anemometer mounting frame. The distance between the anemometers and the blades was 31 cm in this case, and anemometers were again positioned 9 cm away from the frame border. The vertical position of the aluminum tube containing the anemometers was changed while monitoring the wind speed at different points within the test system. The average wind speed of the cross section of the fan test system frame was calculated and multiplied with the opening area of the test system to obtain the ventilation rates of the 2 fan types. 5 new universal wind speed recorders (Model WFWZY-1, Tian Jian Hua Yi Instrument Technology Development Co. Ltd, Beijing, China, Accuracy of ±0.05 m/s) were used to measure the wind speed. The recorders were calibrated by the manufacturer before shipment. The interval of wind speed data acquisition was set at 30 s. The residence time at each position for the test rod was 10 min, enabling the collection of 25 measuring point data points for fan 1, and 20 for fan 2 made on 24thJuly, 2015.
1.3.2 Building airflow
The ventilation rate was the sum of airflow rates for all four operating fans. There were two fan types, and each type included two fans. Airflow was only tested for one fan of each type, and only the rotational speed was tested for the other. For fans of the same type, the airflow rate was calculated as a function of the rotational speed (Eq.(1)) as described previously in Heber et al.[20]and Blunden et al.[21].
1/1=2/2(1)
Where1,2= airflow rate for fan 1 (fan 2) and fan 4 (fan 3), respectively, m3/s, and1,2=fan rotational speed for fan 1 (fan 2) and fan 4 (fan 3), respectively, r/min.
In this study, the airflow rate from each fan type was testedusing a simplified fan test system as described above. A rotational speed test instrument automatically tested the fan speed. The instrument used a diffuse reflection-type photoelectric switch speed sensor, a AT89C51 core microprocessor to process the signal transmitted by the sensor, and a digital tube to display the results, the accuracy of the speed testor was less than ±2/3 r/min.
The principle of the rotational speed test instrument was as follows: When the photoelectric switch detected a target object, a hopping signal was generated, which trigged the MCU (Microcontroller Unit) external interrupt, then one ‘1’ was added to the variable number in the interrupt function. Meanwhile, the MCU timer was turned on and the numbers of “1” as the number variables were added in one minute. In the end, the test speed tester displayed the speed (r/min) on the LED digital tube. Details of the fan ventilation rate test are shown in Fig.1.

a. In situ fan test system b. In situ fan speed test
There were 4 fans (numbered 1-4 from north to south) in the western wall of the pig house, in which fans 1 and 4 were the same model, and fans 2 and 3 were the other model. The ventilation rates of fans 1 and 2 were obtained by multiplying the average wind speed and the area of the cross section of the frame of the simple fan test system, and the ventilation rates of fans 4 and 3 were subsequently calculated using eq.(1).
The pig house ventilation rate was then calculated as the sum of the 4 fan ventilation rates using eq. (2)
total=Fan1+Fan2+Fan3+Fan4(2)
Wheretotalis the pig house ventilation rate when all 4 fans were all on, andFan1,Fan2,Fan3andFan4are the ventilation rate for fans 1-4, respectively. Because it is very difficult to obtain an accurate ventilation rate[22], in the present worktotalwas used to estimate the total emissions rate from the pig house. Table 2 shows the rotational speed of each fan in the western wall, and the ventilation rates of the four fans.
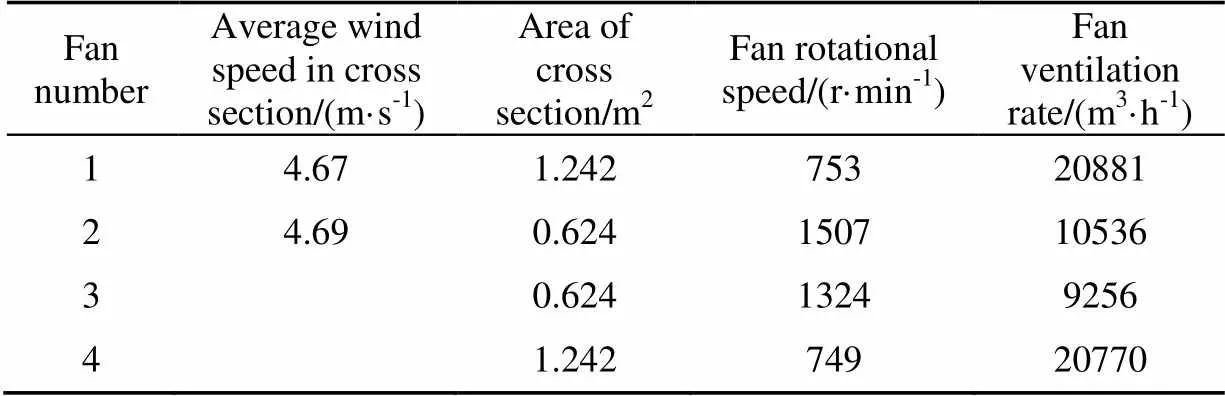
Table 2 Ventilation rates of 4 fans
The pig house ventilation rate was the sum of the 4 fan ventilation rates, therefore,
total=Fan1+Fan2+Fan3+Fan4=61 443 m3/h
Accurate ventilation rate data are essential for maximizing the quality of aerial emissions measurements. Existing methods for ventilation rate measurement include the fan testing report method, the velocity traverse method, the CO2mass balance method, the tracer gas method, and the heat balance method. However, it can be very difficult to obtain an accurate ventilation rate using these methods[22]. Direct, continuous measurement of the building ventilation rate can be challenging and impractical under certain circumstances, such as a naturally ventilated animal housing or when there are a large number of ventilation fans present in the building. In the present study, we used the velocity traverse method to measure ventilation in the pig house, and thetotalvalue was then used to calculate the emission rate.
1.3.3 Gas sampling and regular monitoring
The carbon dioxide concentration at the building air exhaust was continuously monitored using a carbon dioxide self-recording instrument (Model EZY-1S, Tian Jian Hua Yi Instrument Technology Development Co. Ltd, Beijing, China, Accuracy being ±75×10-6) at 30 min intervals throughout the experiment. The instrument was calibrated by the manufacturer before shipment.
The outdoor CO2concentration was measured using a CO2monitor equipped with a dual-beam infrared absorption sensor (Telaire 7001, GE, Billerica, MA, USA, Accuracy is ±50×10-6). Before the experiment, the handheld monitor was checked and calibrated using the CO2standard calibration at the National Institute of Metrology, China.
The concentration of CO2at the inlet was measured manually at 08:00, 10:00, 12:00, 14:00, 16:00 and 18:00 every day, and the CO2concentration at other times was obtained by interpolation. The concentration of CO2at the outlet was measured automatically and hourly.
The concentration of NH3at the outlet and inlet was measured at 08:00, 10:00, 12:00, 14:00, 16:00 and 18:00 every day during the experimental periodusing an Ammonia Gas Detector (Model GT901, Shenzhen Ke Er Nuo Electronic Technology Co, Ltd. China, Accuracy being ≤±3%) that was checked and calibrated by the manufacturer before use.
A differential pressure gauge (KIMO MP100, KIMO instrument, France, Accuracy being ±2 Pa) was simultaneously used to measure the differential pressure between indoors and outdoors. A barometer (PR10-2A, Beijing Great Western Technology Co, Ltd. China, Accuracy being ±1.5 hPa) was used to measure the atmospheric pressure. The differential pressure gauge in the pig house was tested on 24thJuly, 2015. The differential pressure of the exhaust in the pig house was between 77.4 and 92.8 Pa during the ventilation rate testing period. The barometric pressure, the CO2concentration at the exhaust and inlet, and the NH3concentration at the exhaust and inlet were all measured from 7thJuly, 2015 to 8thAugust, 2015.
1.3.4 Temperature and relative humidity
Two temperature/RH loggers (179A-TH, Apresys Precision Optical Co, Ltd. Shanghai, China, with probes manufactured in Switzerland, Accuracy of ±0.2℃) were used to measure temperature and relative humidity at the exhaust sampling location, and the average value from both loggers was calculated. A further three temperature/relative humidity loggers of the same type were used to measure temperature and relative humidity outside the pig house, and the average value from all three loggers was calculated. An additional 12 temperature/relative humidity loggers of the same type were placed 0.9 m above the floor and used to monitor the temperature/relative humidity in the pig house. The distribution of monitoring points was shown in Fig.2.
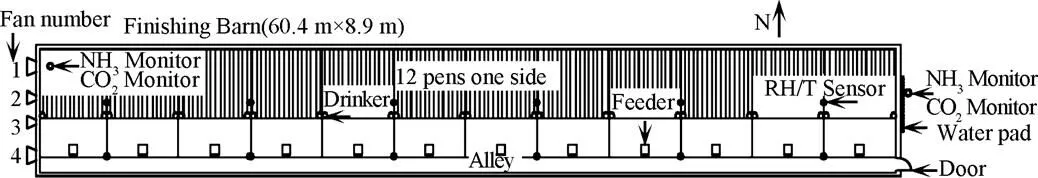
Fig.2 Overhead view of sampling and measurement locations
All temperature/relative humidity loggers outdoors or inside the pig house were set to record data hourly between 08:00 on 24thJuly, 2015 and 18:00 on 11thAugust, 2015.
Fig.3 shows the temperature and relative humidity both in and outside the pig house. The ambient temperature ranged between 17.1 and 41.0 ℃, and the temperature inside the pig house was between 21.3 and 31.7 ℃. The ambient relative humidity was between 33.6% and 100%, and the relative humidity inside the pig house was between 65.5% and 99.2%.
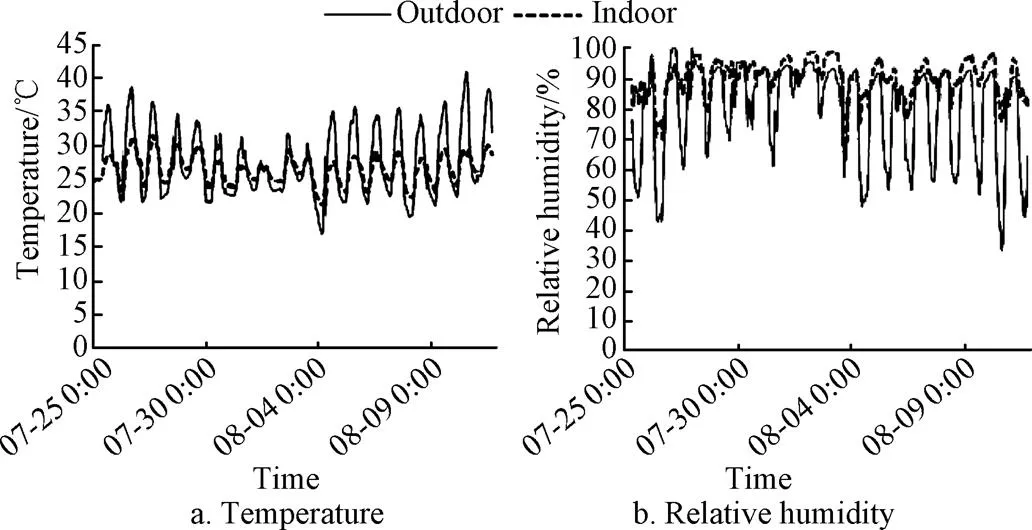
Fig.3 Temperature and relative humidity in and outside pig house
1.3.5 Emission calculation
The pig house emission rate (ER) was obtained simply by multiplying the volume of air exiting the pig house per unit time by the difference in gas concentration in air at the inlet and exhaust. Gas emission rates were calculated using eq.(3). Since the concentration of NH3and CO2were volumetric (10-6), the ideal gas law was used to convert 10-6into mass concentration using eq.(2) as described previously[23]. The pig house emissions were divided by the live mass density to normalize emissions to site-specific characteristics.
GAS=[Q)](C−C) (3)
WhereGASthe pig house emission rate (ER), mg/s;Q=the pig house outlet airflow rate atT, m3/s, andP=the pressure at the exhaust sampling location, atm;the gas molecular weight, g/mol;=the universal gas constant (0.08206 L·atm/(mol·K);T=the temperature at the exhaust sampling location, ℃;C=the gas concentration at the exhaust (10-6) andC=the gas concentration at the inlet (10-6).
When calculating the CO2emission rate, the concentration of CO2measured hourly at the inlet and outlet were used to calculate the overall emission rate using eq.(3).
1.3.6 Water consumption measurement
To measure the total water consumption of the finishing pig house, a water meter was installed at the inlet of the water supply tube, and another was installed at the branch water supply tube for the water pad. The reading from the water meter installed at the water supply tube included readings from the water meter installed at the branch water supply tube for the water pad, and the rate of water discharged from drinkers, dripped from tubes and drinkers, and flushed daily. Daily water consumption was divided by the total number of pigs to obtain the consumption per pig per day. Water consumption data were acquired from 22ndJuly, 24thJuly to 1stAugust, and from 2ndAugust to 11thAugust in 2015 (19 days in total).
2 Results and discussion
2.1 Analysis of daily NH3 emission rate
The concentration of NH3at the inlet and outlet (Fig.4a) and the ammonia emission rates (Fig.4b) were plotted. The NH3concentration at the outlet and inlet were (2.4-12.5)×10-6and (0.3-3.9)×10-6, respectively, and the average NH3emission rate was (23.4±11.0) g/(d·500 kg).

Fig.4 NH3 concentration at outlet and inlet of finishing pig house
Table 3 shows the daily mean±standard deviation, maximum, minimum for the NH3emission rate from 25thJuly, 2015 to 11thAugust, 2015 (18 days), presented on both pig-specific and live mass-specific bases, and Table 4 summarizes studies monitoring NH3emissions from different swine sources.
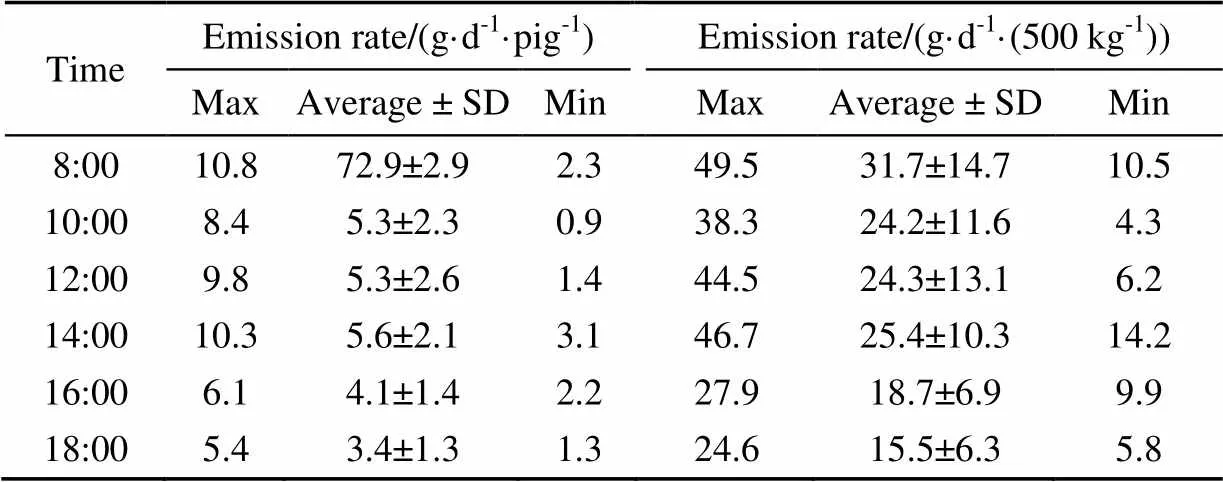
Table 3 Statistics of daily NH3 emission rates
In this study, the emission rate for NH3was 4.3-49.5 g/(d·500 kg) and 0.9-10.8 g/(d·pig). The maximum value was 10.0% higher than the emission rate of 45.0 g/(d·500 kg), and the minimum value was 81.5% lower than the emission rate of 23.2 g/(d·500 kg) reported by Philippe et al.[24]in a high-fiber diet experiment finishing pig room in Belgium. The maximum value of 10.8 g/(d·pig) was 51.0%-125% higher than the highest emission rate measured by Ngwabie et al.[25-28]. The minimum value of 0.9 g/(d·pig) was 79.1%-84.0% lower than the lowest emission rate measured by Ngwabie et al.[25-28]. The main factors influencing NH3production are the floor type, the manure removal system, the climatic conditions inside the building, the dietary composition, and the feed efficiency of animals[29]. Slurry acidification can also dramatically reduce the emission of NH3[30].
The differences in the NH3emission rates between our results and those of previous studies may reflect the effects of various factors, and suggests there remains some potential for NH3reduction in pig house systems in Beijing, China, through adopting systems of the type studied in the present work. It has been reported that slurry temperature can also explain most of the variability in NH3emissions from finishing pig houses, since lower slurry temperature may reduce NH3emissions or compensate for the effects of a higher ventilation rate. Increasing the surface area of the slurry and the floor opening area increases the air exchange rate in the slurry pit, resulting in a higher NH3emission rate[31].
For slatted floor systems, most previous studies reported lower emissions with a partly slatted floor provided the solid floor area is kept clean. Climate conditions inside the building also influence the emissions, which were positively correlated with ambient temperature and ventilation rate in a previous study[29]. The maximum, average and minimum NH3emission rates at 08:00 and 14:00 were all significantly higher than the emission rates at 10:00, 12:00, 16:00 and 18:00 (<0.001).
The hourly indoor and outdoor temperatures measured over the course of the experiment are shown in Fig.3. Climate conditions inside the building also influence the emissions, which were positively correlated with the ambient temperature and ventilation rate in a previous study[29]. In the present work, the ventilation rate was considered to be constant. Interestingly, the hourly temperature at 08:00 was not the highest recorded, suggesting the highest hourly NH3emission rates observed at this time were not directly caused by high temperature and high ventilation rates. Manure was generally removed between 08:00 and 08:30, and from 14:00 to 14:30, suggesting manure removal by workers was probably the primary factor. This finding is consistent with previous reports that partly slatted floor systems generally achieve lower emissions provided the solid floor area remains clean[29]. Transferring manure from the solid floor to the slatted floor and allowing it to drop into the pit beneath the slatted floor reduces the manure surface area and consequently reduces the NH3emission rate. Therefore, keeping the solid floor free from manure either by cleaning or by training pigs to defecate on the slatted floor could significantly reduce NH3emissions.
2.2 Analysis of daily CO2 emission rate
The concentration of CO2at the inlet and outlet (Fig.5a) and the CO2emission rates (Fig.5b) were plotted for data collected between 08:00 on 25thJuly and 07:00 on 27thJuly, 08:00 on 28thJuly 08:00 and 07:00 on 30thJuly, 08:00 on 31thJuly and 07:00 on 3rdAugust, 08:00 on 4thAugust and 07:00 on 5thAugust, 11:00 on 6thAugust and 07:00 on 8thAugust, and 08:00 on 9thAugust and 07:00 on 11thAugust (all in 2015). The CO2concentration at the outlet and inlet ranged from (563-861)×10-6and (401-564)×10-6, respectively (Fig.5a). The average daily CO2emission rate was (2.73±0.78) kg/(d·500 kg), the maximum CO2emission rate was 5.00 kg/(d·500 kg), and the minimum CO2emission rate was 1.00 kg/(d·500 kg) (Fig.5b).

Fig.5 CO2 concentration and CO2 emission rate at outlet and inlet of finishing pig house
Table 4 summarizes studies monitoring the emission of CO2from different sources and includes emissions from pig barns at different phases, for which CO2emission rates of 3.3 to 39.5 kg/(d·500 kg) are typical for finishing pig barns. The CO2emission rate measured in the present study was low compared with these previous studies as described in Table 4.
The total number of valid CO2emission rate data points was 285 across the entire experimental period. The frequency distribution of the average daily mean emission rate is shown in Fig.6. The average daily emission rate with a maximum frequency of 44% was 2.5-3 kg/(d·500kg), and 92% of the average daily emission rates were less than 4.0 kg/(d·500 kg).
Previous work has demonstrated that the weight of animals affects carbon dioxide emissions. Thorbek et al.[40]reported CO2levels of 1.0 kg/d for 30 kg of live weight and 2.0 kg/d for 85 kg of live weight for pigs reared under ordinary feeding conditions. Costa et al.[32]considered that the higher weight of fatteners, in comparison with weaners, associated to the high animal activity occurring in the fattening room, especially during feeding times, resulted in a higher CO2emission rate. This figure was reported in units of kg/(d·pig), but if the units are changed to kg/(d·500 kg), the results instead show that the greater the pig weight, the lower the CO2emission rate. In the present study, the finishing pig initial weight was 110 kg/pig, compared with less than 110 kg weight of finishing pig reported for most previous studies (Table 4). The CO2emission rate reported in the present work was also lower than that reported previously for similar studies. Furthermore, the CO2emission rate was clearly linked with the pig house structure and ventilation system, which presumably affects the activity of the animals and thus affects the CO2emission rate.
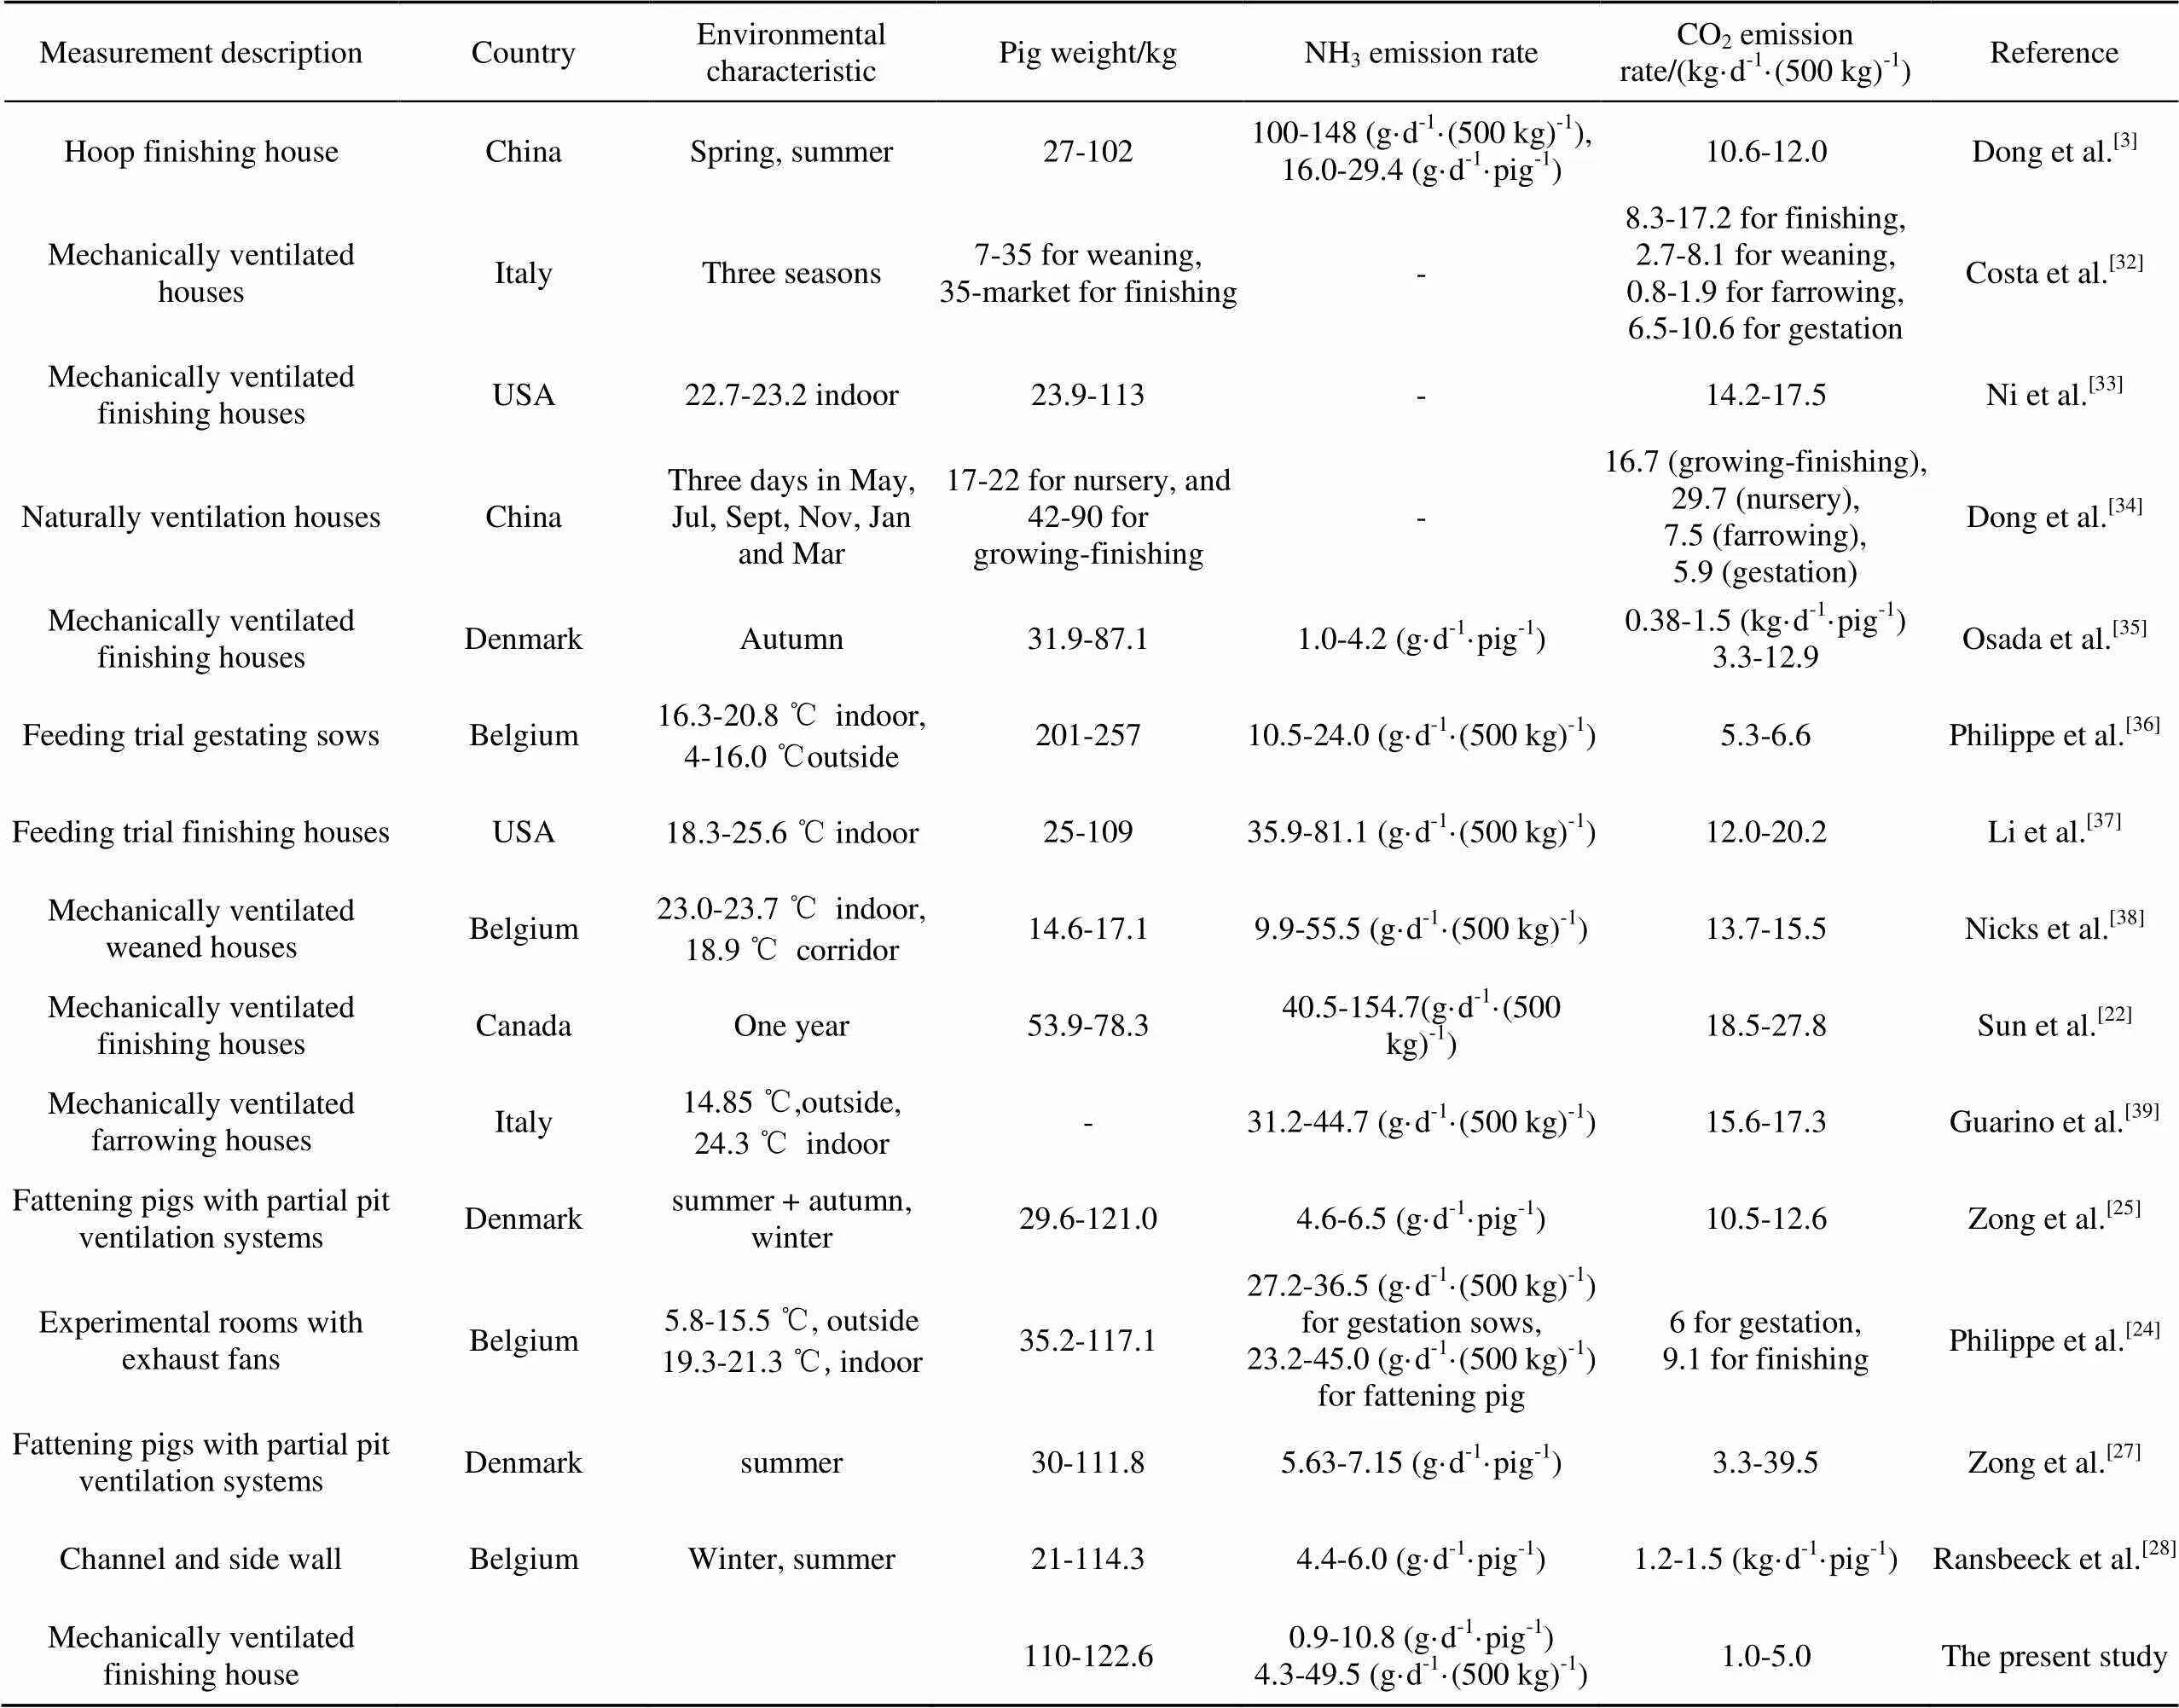
Table 4 Summary of NH3 and CO2 emissions from different swine sources

Fig.6 Frequency and cumulative frequency distribution of daily mean CO2 emission rate for test finishing house (n = 285)
2.3 Diurnal rhythm CO2 emission rate of finishing pigs
As shown in Fig.7, the CO2emission rate peaked once per day. Similarly, one peak was reported in the diurnal rhythm of CO2production by fattening pigs fedwhen exposed to daylight via windows[41]. The weight of pigs in the CIGR[41]study was 86 kg per pig, and the CO2emission rate peaked at 15:00, compared with 110 kg per pig and a peak at 12:00 in the present study. The differences may be due to variation in pig weight, geographical area, or other factors that may affect the diurnal rhythm of pig activity and thus the peak time of CO2emissions.

Fig.7 Diurnal rhythm of CO2 emission rate
2.4 Analysis of water consumption
Water consumption measurements (Fig.8) gave maximum and minimum values of 8.7 and 1.9 m3/d, respectively, and the maximum water consumption by the water pad was 6.3 m3/d (Fig.8a). On a per pig per day basis, maximum, minimum and average water consumption rates including the water pad were 90.0, 19.6 and (47.0±20.2) L/(d·pig), respectively, and the maximum, minimum and average water consumption rates excluding the water pad were 60.3, 8.0 and (29.1±13.7) L/(d·pig), respectively (Fig.8b). A finishing pig water consumption rate of 11.4 L/(d·pig) was obtained from the Structures and Environment Handbook[42], indicating great potential for water conservation in pig houses of the type in the present study.
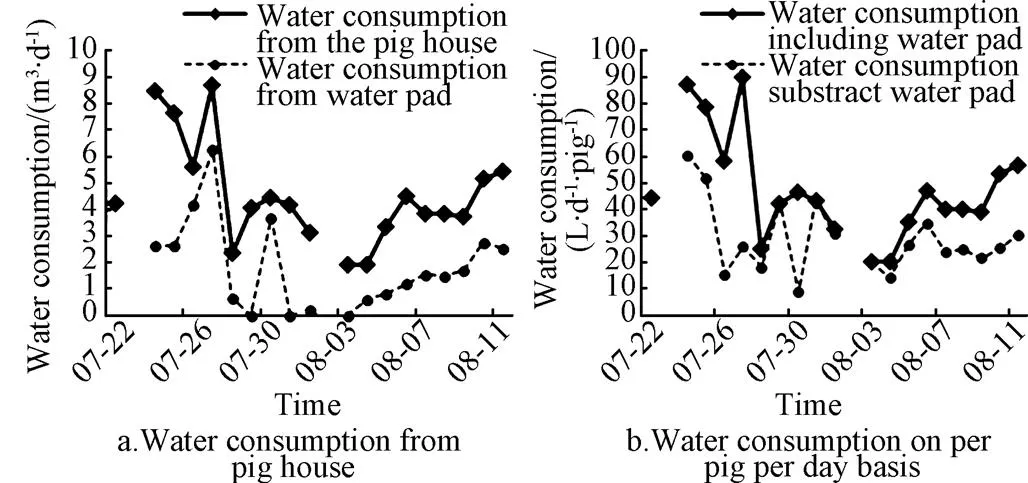
Fig.8 Water consumption
The total water consumption from the pig house included water used in flushing, discharged from drinkers, used in the water pad, and dripped from water tubes and drinkers, some of which could be prevented. In the present work, only water discharged from drinkers, used in the water pad and dripped from water tubes was monitored. During the experimental period, the pig house was not flushed, therefore water consumption comprised only the water pad and that dripped from water tubes and drinkers.
The volume of a single water drip in the experimental pig house ranges from 0.18-0.20 mL. The quantity of drips was also calculated, and the total water consumption from dripped water tubes and drinkers was 125.5 L/d. Water consumption figures have been reported previously by Liet al.[43-46], all of whom stated that most of the water discharged from drinkers was consumed directly by pigs, but more than 27% dripped to the floor and mixed with manure, urine and wastewater. In pig houses such as our experimental site in Beijing, China, it will be difficult to improve wastewater efficiency because pig farms generally do not have enough agricultural land for wastewater processing and disposal. It is therefore important to reduce water consumption from pig farms in this area. The water consumption value (average water consumption excluding water pad) was (29.1±13.7) L/(d·pig) in the present study, which is greater than the US reference figure of 11.4 L/(d·pig), indicating great potential for improved water conservation in pig houses in Beijing, China.
3 Conclusions
The NH3emission rates in the present study were 4.3-49.5, 0.9-10.8 and (23.4±11.0) g/(d·500 kg). The maximum value is higher than those reported in comparable previous studies, and the minimum value is lower, suggesting there remains room to reduce NH3emissions in pig house systems in Beijing, China.
NH3emission rates at 08:00 and 14:00 were significantly higher than those at 10:00, 12:00, 16:00 and 18:00 (<0.001), presumably due to manure removal by workers, which appeared to have a pronounced effect on reducing the NH3emission rate.
The average CO2emission rate for the test finishing house was (2.73±0.78) kg/(d·500 kg). The maximum CO2emission rate was 5.00 kg/(d·500 kg), and the minimum CO2emission rate was 1.00 kg/(d·500 kg). The average daily mean emission rate with a maximum frequency of 44% was 2.5-3 kg/(d·500kg), and 92% of average daily emission rates were less than 4.0 kg/(d·500 kg). The CO2emission rate obtained in the present work is low compared with values reported previously in comparable studies. The CO2emission rate during the day peaked once at 12:00 in the present study, consistent with the single peak reported for previous studies, but the peak was 3 h earlier in the present work.
Maximum and minimum water consumption values including the water pad were 8.7 and 1.9 m3/d, respectively, and the maximum water consumption used by the water pad was 6.3 m3/d. The maximum, minimum and average water consumption values including the water pad on a per pig per day basis were 90.0, 19.6 and (47.0±20.2) L/(d·pig), respectively, and the maximum, minimum and average water consumption values excluding the water pad were 60.3, 8.0 and (29.1±13.7) L/(d·pig), respectively. These results clearly show that there remains great potential for improving water conservation in pig houses of the type used in this study.
Acknowledgments
The authors would like to thank Aotian Swine Farm in Beijing, China for their cooperation throughout the study.
[1] Pachauri R K, Fifth Assessment Synthesis Report, Climate change 2014 synthesis report[R]. Approved Summary for Policymakers, 2015.
[2] IPCC. Chapter 4: Agriculture. In IPCC Good Practice Guidance and Uncertainty Management In National Greenhouse Gas Inventories, 10.52[M]. Kanagawa, Japan: IPCC National Greenhouse Gas Inventories Program Technical Support Unit. 2006.
[3] Dong H, Kang G, Zhu Z, et al. Ammonia, methane, and carbon dioxide concentrations and emissions of a hoop grower-finisher swine barn[J]. Transactions of the ASABE, 2009, 52(5): 1741-1747.
[4] Ni J Q, Hendriks J, Coenegrachts J, et al. Production of carbon dioxide in a fattening pig house under field condition: I. Exhalation by pigs[J]. Atmospheric Environment, 1999, 33(22): 3691-3696.
[5] Ni J Q, Vinckier C, Hendriks J, et al. Production of carbon dioxide in a fattening pig house under field condition: II. Release from manure[J]. Atmospheric Environment, 1999, 33(22): 3697-3703.
[6] Trabue S, Kerr B. Emissions of greenhouse gases, ammonia, and hydrogen sulfide from pigs fed standard diets and diets supplemented with dried distillers grains with solubles[J]. Journal of Environmental Quality, 2014, 43(4): 1176-1186.
[7] Heederik D, Sigsgaard T, Thorne PS, et al. Health effects of airborne exposures from concentrated animal feeding operations[J]. Environmental Health Perspectives, 2007, 115(2): 298-302.
[8] Blanes V, Pedersen S. Ventilation flow in pig houses measured and calculated by carbon dioxide, moisture, and heat balance equations[J]. Biosystems Engineering, 2005, 92(4): 483-493.
[9] Oenema O, Oudendag D, Velthof G L, et al.Nutrient losses from manure management in the European Union[J]. Livestock Science, 2007, 112(3): 261-272.
[10] Rebolledo B, Gil A, Pallarés J. A spatial ammonia emission inventory for pig farming[J]. Atmospheric Environment, 2013, 64: 125-131.
[11] Pinder R W, Davidson E A, Goodale C L, et al. Climate change impacts of US reactive nitrogen[J]. Proceedings of the National Academy of Sciences of the United States of America, 2012, 109(20): 7671-7675.
[12] Martin S T, Hung H M, Park R J, et al. Effects of the physical state of tropospheric ammonium-sulfate-nitrate particles on global aerosol direct radiative forcing[J]. Atmospheric Chemistry and Physics, 2004, 4: 183-214.
[13] Abbatt J P D, Benz S, Cziczo D J, et al. Solid ammonium sulfate aerosols as ice nuclei: A pathway for cirrus cloud formation[J]. Science (New York, N.Y.), 2006, 313(5794): 1770-1773.
[14] Banhazi T M, Seedorf J, Rutley D L, et al. Identification of risk factors for sub-optimal housing conditions in Australian piggeries: Part2. Airborne pollutants[J]. Journal Agricultural Safety and Health, 2008, 14(1): 21-39.
[15] Baldacci S, Maio S, Cerrai S, et al. Allergy and asthma: Effects of the exposure to particulate matter and biological allergens[J]. Respiratory Medicine, 2015, 109(9): 1089-1104.
[16] Zhang Y Y, Ji X T, Ku T T, et al. Heavy metals bound to fine particulate matter from northern China induce season- dependent health risks: A study based on myocardial toxicity[J]. Environmental Pollution, 2016, 216: 380-390.
[17] Zhang L W, Chen X, Xue X D, et al. Long-term exposure to high particulate matter pollution and cardiovascular mortality: A 12-year cohort study in four cities in northern China[J]. Environment International, 2014, 62: 41-47.
[18] Livestock Husbandry Department, Ministry of Agriculture. National Animal Husbandry Service. Livestock Statistics in China in 2014[M]. Beijing: China Agricultural Press, 2015: 36.
[19] Beijing Municipal Bureau of Agriculture, Beijing Municipal Commission of Development and Reform. Development planning of livestock in Beijing China from 2010 to 2015[R]. 2009.
[20] Heber A J, Robarge W P, Kang J, et al. National air emissions monitoring study: Emissions data from three swine finishing barns in North Carolina[R]. Final Report for Site NC3B. Purdue University, West Lafayette, In 2010.
[21] Blunden J, Aneja V P, Westerman P W. Measurement and analysis of ammonia and hydrogen sulfide emissions from a mechanically ventilated swine confinement building in North Carolina[J]. Atmospheric Environment, 2008, 42(14): 3315-3331.
[22] Sun G, Guo H, Jonathan P, et al. Diurnal odor, ammonia, hydrogen sulfide, and carbon dioxide emission profiles of confined swine grower/finisher rooms[J]. Journal of Air Waste Management Association, 2008, 58(11): 1434-1448.
[23] Lin X J, Cortus E L, Zhang R, et al. Ammonia, hydrogen sulfide, carbon dioxide and particulate matter emissions from California high-rise layer houses[J]. Atmospheric Environment, 2012, 46: 81-91.
[24] Philippe F X, Laitat M, Wavreille J, et al. Effects of a high-fibre diet on ammonia and greenhouse gas emissions from gestating sows and fattening pigs[J]. Atmospheric Environment, 2015, 109: 197-204.
[25] Zong C, Li H, Zhang G Q. Ammonia and greenhouse gas emissions from fattening pig house with two types of partial pit ventilation systems[J]. Agriculture, Ecosystems and Environment, 2015, 208: 94-105.
[26] Ngwabie N M, Jeppsson K H, Nimmermark S, et al. Effects of animal and climate parameters on gas emissions from a barn for fattening pigs[J]. Applied Engineering in Agriculture, 2011, 27(6): 1027-1037.
[27] Zong C, Feng Y, Zhang G Q, et al. Effects of different air inlets on indoor air quality and ammonia emission from two experimental fattening pig rooms with partial pit ventilation system-Summer condition[J]. Biosystems Engineering, 2014, 122: 163-173.
[28] Ransbeeck N V, Langenhove H V, Demeyer P. Indoor concentrations and emissions factors of particulate matter, ammonia and greenhouse gases for pig fattening facilities[J]. Biosystems Engineering, 2013, 116(4): 518-528.
[29] Philippe F X, Cabaraux J F, Nicks B. Ammonia emissions from pig houses: Influencing factors and mitigation techniques[J]. Agriculture, Ecosystems and Environment, 2011, 141(3/4): 245-260.
[30] Petersen S O, Hutchings N J, Hafner S D, et al. Ammonia abatement by slurry acidification: A pilot-scale study of three finishing pig production periods[J]. Agriculture, Ecosystems and Environment, 2016, 216: 258-268.
[31] Ye Z, Zhu S, Kai P, et al. Key factors driving ammonia emissions from a pig house slurry pit[J]. Biosystems Engineering, 2011, 108(3): 195-203.
[32] Costa A Guarino. Definition of yearly emission factor of dust and greenhouse gases through continuous measurements in swine husbandry[J]. Atmospheric Environment, 2009, 43(8): 1548-1556.
[33] Ni J Q, Heber A J, Lim T T, et al. Methane and carbon dioxide emission from two pig finishing barns[J]. Journal of Environmental Quality, 2008, 37(6): 2001-2011.
[34] Dong H, Zhu Z, Shang B, et al. Greenhouse gas emissions from swine barns of various production stages in suburban Beijing, China[J]. Atmospheric Environment, 2007, 41(11): 2391-2399.
[35] Osada T, Rom H B, Dahl P. Continuous measurement of nitrous oxide and methane emissions in pig units by infrared photoacoustic detection[J]. Transactions of the ASAE, 1998, 41(4): 1109-1114.
[36] Philippe F X, Canart B, Laitat M, et al. Gaseous emissions from group-housed gestating sows kept on deep litter and offered and adlibitum high-fibre diet[J]. Agriculture, Ecosystems and Environment, 2009, 132(1/2): 66-73.
[37] Li W, Powers W, Hill G M. Feeding distillers dried grains with soluble and organic trace mineral sources to swine and the resulting effect on gaseous emissions[J]. Journal of Animal Science, 2011, 89(10): 3286-299.
[38] Nicks B, Laitat M, Vandenheede M, et al. Emissions of ammonia, nitrous oxide, methane, carbon dioxide, and water vapor in the raising of weaned pigs on straw-based and sawdust-based deep litters[J]. Animal Research, 2003, 52(3): 299-308.
[39] Guarino M, Costa A, Porro M. Photocatalytic TiO2coating to reduce ammonia and greenhouse gases concentration and emission from animal husbandries[J]. Bioresource Technology, 2008, 99(7): 2650-2658.
[40] Thorbek G. National Institute of Animal Science Report No. 373[R]. Landhusholdningsselskabets Forlag, Copenhagen, Denmark, 1969: 1-46.
[41] Pedersen S, Sällvik K. CIGR 4th Report of working group on climatization of animal houses heat and moisture production at animal and house levels[R]. 2002.
[42] Midwest Plan Service[M]//Structures and Environment Handbook, Eleventh Edition 1983, Revised 1987.
[43] Li Y Z, Chénard L, Lemay S P, et al. Water intake and wastage at nipple drinkers by growing-finishing pigs[J]. Journal of Animal Science, 2005, 83(6): 1413-1422.
[44] Olsson O. Evaluation of bite drinkers for fattening pigs[J]. Transactions of the ASAE, 1983, 26(5):1495-1498.
[45] Andersen H M L, Dybkjær L, Herskin M S. Growing pigs’ drinking behaviour: Number of visits, duration, water intake and diurnal variation. Animal, 2014, 8(11): 1881-1888.
[46] Brumm M C, Heemstra J. Impact of drinker type on pig performance, water use and manure production[J]. Nebraska Swine Reports, 1999: 49-50.
北京夏季机械通风育肥猪舍CO2、NH3排放和耗水量研究
王美芝1,2,刘继军1,2,赵婉莹1,2,陈昭晖1,2,任 康3,崔晓东3,王 刚4,吴中红1,2※
(1. 中国农业大学动物科技学院,北京 100193;2. 动物营养学国家重点实验室,北京 100193;3. 北京市畜牧总站,北京 100029;4. 中国科学院国家天文台,北京 100012)
为明确拔塞式清粪机械通风育肥猪舍夏季CO2和NH3的排放量及猪舍耗水量,并建立中国类似设施猪舍的气体排放及水的消耗量基线及寻求减排和节水空间,选择北京市拔塞式清粪机械通风育肥猪舍,设计机械通风系统的通风量测量系统,并测量机械通风量,从2015年7月25日至8月11日(共18 d)监测猪舍NH3、CO2排放量和耗水量。试验结果表明,NH3排放量平均值为(23.4±11.0) g/(d·500 kg),范围为4.3~49.5 g/(d·500 kg)。NH3的排放量在08:00和14:00极显著高于10:00,12:00、16:00和18:00时的排放量(<0.001),可能是人工清粪行为导致NH3排放量降低。CO2排放量平均值为2.73 ± 0.78 kg/(d·500 kg),最大和最小排放量分别是5.00和1.00 kg/(d·500 kg),44%的日平均排放量为2.5~3 kg/(d·500 kg),92%的日平均排放量小于4.0 kg/(d·500 kg),日间CO2排放量在12:00达到高峰。育肥猪耗水量的最大值、最小值和平均值分别为90.0,19.6 和47.0 L/(d·pig)。
二氧化碳;排放控制;氨气;机械通风;育肥猪舍;拔塞式清粪;耗水量
10.11975/j.issn.1002-6819.2017.17.020
X828; S815.9
A
1002-6819(2017)-17-0152-09
2017-03-22
2017-06-30
This work was supported by the Beijing Innovation Consortium of Agriculture Research System (grant number BAIC02-2017).
Wang Meizhi, Ph.D, Associate Professor, research interest: Animal husbandry engineering and environment. Email: meizhiwang@cau.edu.cn.
Wu Zhonghong, Ph.D, Associate Professor, research interest: Environmental engineering of domestic animals and the influence of environment on livestock production. Email:wuzhh@cau.edu.cn.
