野百合碱性肺动脉高压大鼠右心功能分析
2017-11-01高艳苏壮志
高艳,苏壮志
(首都医科大学宣武医院放射科, 北京 100053)
研究报告
野百合碱性肺动脉高压大鼠右心功能分析
高艳,苏壮志
(首都医科大学宣武医院放射科, 北京 100053)
目的研究肺动脉压力演变和右心室功能演变之间的关系。方法将MCT诱导的4组肺动脉高压(pulmonary artery hypertension,PAH)模型组(每小组12只),分别在第1、2、3、4周应用右心导管测量肺动脉压力,MRI右心功能动态检测,观察肺动脉压力和MRI参数演变关系。比较对照组、PAH模型组各组间的相关各参数差异。采用SPSS 17.0统计软件,应用Pearson相关性分析,评价右心室射血分数, 右室舒张末期容积,右室收缩末期容积分别与平均肺动脉压的相关性,组间比较采用完全随机分组的t检验,P<0.05为差异有显著性。结果注射野百合碱后1~4周,48只模型组大鼠的右心室射血分数、右心室舒张及收缩末期容积与平均肺动脉压有很好的相关性(分别为rRVEF=-0.823,rRVEDV=0.732, rRVESV=0.803)。注射野百合碱前两周,野百合碱组大鼠的平均肺动脉压、右心室射血分数、右室舒张末期和收缩末期容积与对照组比较差异无显著性(P>0.05)。3~4周后,以上各参数与对照组比较差异有显著性(P<0.05)。结论随着大鼠的肺动脉压增高,右心室射血分数逐渐降低,右心室舒张末期及收缩末期容积逐渐增加。对于大鼠慢性肺动脉高压模型的监测,MRI可以准确快速测量各项参数变化,右心室舒张末及收缩末期容积、射血分数等参数是提示肺动脉高压的敏感参数。
肺动脉高压;大鼠,磁共振;野百合碱;右心室功能
我国慢性阻塞性肺病(chronic obstructive pulmonary disease, COPD)的发病率达到8.2%[1]。大部分COPD患者经慢性肺动脉高压过程最终发展成慢性肺源性心脏病,并最终导致死亡,病死率高[2]。阐明肺动脉高压发病机制对有效防治COPD发展成肺心病意义重大。既往对肺动脉高压患者右心室功能研究仅限于回顾性评价,不能动态观察心功能的变化,心功能异常是在肺动脉高压进展过程哪个阶段出现的并不清楚。本实验基于野百合碱(MCT)诱导的大鼠肺动脉高压模型,研究肺动脉高压形成过程中,肺动脉压力的演变和右心功能等血流动力学参数演变之间关系,动态观察右心功能变化。

图1 MCT诱导的第2周,MRI左室短轴层面右心室由收缩期到舒张期形态变化过程Fig.1 MRI showing the morphological changes of left ventricular short axis from right ventricular systolic to diastolic phases at two weeks after injection of monocrotaline
1 材料和方法
1.1材料
1.1.1 实验动物
6~8周龄雄性SPF级Sprague-Dawley (SD)大鼠96只,体重180~220 g,购自北京维通利华实验动物技术有限公司【SCXK(京)2016-0006】。随机分为正常对照组(n=48),野百合碱诱导的PAH模型组(n=48),实验大鼠饲养及组织取材均于宣武医院实验动物室进行【SYXK(京)2010-0013】,室内通风良好,室温(23±2)℃,相对湿度40%~70%,每日光照12 h,自由摄食饮水。常规商用鼠饲料:由宣武医院实验动物中心提供。本实验所有操作均符合中华人民共和国《实验动物管理条例》。
1.1.2 试剂与仪器
野百合碱(MCT):美国Sigma公司;采用超高场强小动物磁共振仪(Bruker BioSpin MRI GmbH, PharmaScan 7.0 Tesla, Siemens, Germany)。
1.2肺动脉高压模型建立及实验分组
1.2.1 对照组
腹腔内一次性注射与MCT等量的生理盐水。于造模后每天注射生理盐水l mL/kg。
1.2.2 野百合碱 (MCT) 组
腹腔内一次性注射MCT 溶液(60 mg/kg)造模,于造模后每天注射生理盐水l mL/kg。分别为注射MCT后1周组(l-week-PAH组,n=12)、2周组(2-week-PAH组,n=12)、3周组(3-week-PAH组,n=12)及4周组(4-week-PAH组,n=12)。于注射MCT后分别于1~4周做完检查后安乐死。
1.3MRI右心功能成像及定量分析
将MCT诱导的肺动脉高压模型组和对照组大鼠分别随机分为五个小组(每小组12只),分别在第1、2、3、4周进行MRI动态监测右心功能参数,右心功能参数包括右心室射血分数、右心室收缩末期容积、右心室舒张末期容积等。评价肺动脉压力变化和MRI参数演变间的关系。
1.3.1 MRI检查
检查前,随食物口服β-blocker (5~20 mg)保证大鼠心率控制在90次/分及以下,使得MRI显示的左、右心成像形态清晰,减少伪影。大鼠称重后用5%~8%异氟烷吸入性麻醉后,仰位固定,连接心电装置、呼吸门控及表面线圈,以心电极贴片连接心电门控装置。采用Flash-cine序列,参数:TR 8 ms,TE 2.5 ms FA 15 angle。层厚1 mm,FOV: 6.0 × 6.0 cm,MTX 192X192, NEX 4 number of movie cycles 20。
1.3.2 实施屏气电影法MRI
先行心电图门控梯度回波冠状面扫描,然后以冠状面像定位行平行右室长轴的常规自旋回波序列扫描,最后在右室长轴像上定位,从心底至心尖逐层扫描获得3 mm 层厚、垂直室间隔并与心电图同步的右室各个时期的短轴电影图像(图1)。
1.3.3 MR图像重建
扫描完成后的右室短轴电影图像传至工作站(Leonardo, Siemens, Germany),应用MR随机专用心功能测量软件(Argus, Siemens Medical Solutions, Germany)进行右心室心功能测量,软件自动识别右室EDV及ESV, 手动逐层描记舒张末期和收缩末期此两个时相右心室心内膜轮廓,计算心功能指标,舒张末期容积 (end-diastolic volume,EDV)、收缩末期容积(end-systolic volume,ESV)、射血分数(eject fraction, EF)。
1.4肺动脉平均压测定
PAH模型组于注射MCT后1周、2周、3周及4周末,将各组大鼠称重后,用戊巴比妥钠(65 mg/kg)腹腔注射麻醉大鼠后,在腹部行正中“T”形开口,将探针透过膈肌刺入右心室,探针的另一端经压力传感器连接PowerLab压力记录分析系统,实时测定。
1.5统计方法
应用SPSS 17.0统计软件,结果以均数±标准差表示,组间比较采用完全随机分组的t检验。应用Pearson相关性分析,评价右心室射血分数, 右室舒张末期容积,右室收缩末期容积分别与平均肺动脉压的相关性,P<0.05为差异具有统计学意义。
2 结果
随着野百合碱注射时间的延长,与对照组比较,大鼠的血流动力学指标及MRI右心功能参数数值变化,结果显示:注射野百合碱后第1、2周与对照组比较,模型组肺动脉平均压及右心射血分数、右心室舒张末期容积、收缩末期容积差异均无显著性(图2);第3周及第4周,模型组随着肺动脉压力升高,右心射血分数下降,右心室舒张及收缩末期容积增加 (图3),与对照组比较差异有显著性,见表1~4。
注射野百合碱后1~4周,48只模型组大鼠的右心室射血分数、右心室舒张末及收缩末期容积与平均肺动脉压有很好的相关性(分别为rRVEF=-0.823,rRVEDV=0.732, rRVESV=0.803)。各参数散点图见图4(A-C)。
表1 造模后第1~4周模型组与对照组的肺动脉平均压比较Tab.1 Comparison of mean pulmonary arterial pressure between the model group and control group at 1-4 weeks after modeling
注:模型组与正常对照组肺动脉平均压(mmHg)比较,#P>0.05,*P<0.01。
Note:#P>0.05,*P<0.05. compared with the normal control group.
表2 造模后第1~4周模型组与对照组右心室射血分数的比较Tab.2 Comparison of right ventricular eject fraction between the model group and control group at 1-4 weeks after modeling
注:模型组与正常对照组右心室射血分数(%)比较,#P>0.05,*P<0.05。
Note:#P>0.05,*P<0.05, compared with the normal control group.

表3 造模后第1~4周模型组与对照组右心室舒张末期容积的比较Tab.3 Comparison of the end-diastolic volume of right ventricle between the model group and control group at 1-4 weeks after modeling
注:模型组与正常对照组右心室舒张末期容积(mL)比较,#P>0.05,*P<0.01。
Note:#P>0.05,*P<0.05, compared with the normal control group.
表4 造模后第1~4周模型组与对照组右心室收缩末期容积的比较Tab.4 Comparison of the end-systolic volume of right ventricle between the model group and control group at 1-4 weeks after modeling
注:模型组与正常对照组右心室收缩末期容积(mL)比较,#P>0.05,*P<0.01。
Note:#P>0.05,*P<0.05, compared with the normal control group.

图2 注射野百合碱后第2周,右心室收缩末期(A)和右心室舒张末期(B)Fig.2 The RV ESV (A) and RV EDV (B) at 2 weeks after injection of monocrotaline
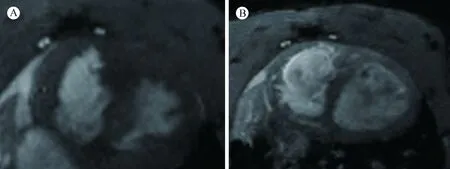
图3 注射野百合碱后第4周,右心室收缩末期(A)和右心室舒张末期(B)较注射野百合碱后第2周的右心室容积均有显著增大,室间隔平直Fig.3 The RV ESV (A) and RV EDV (B) at 4 weeks after injection of monocrotaline
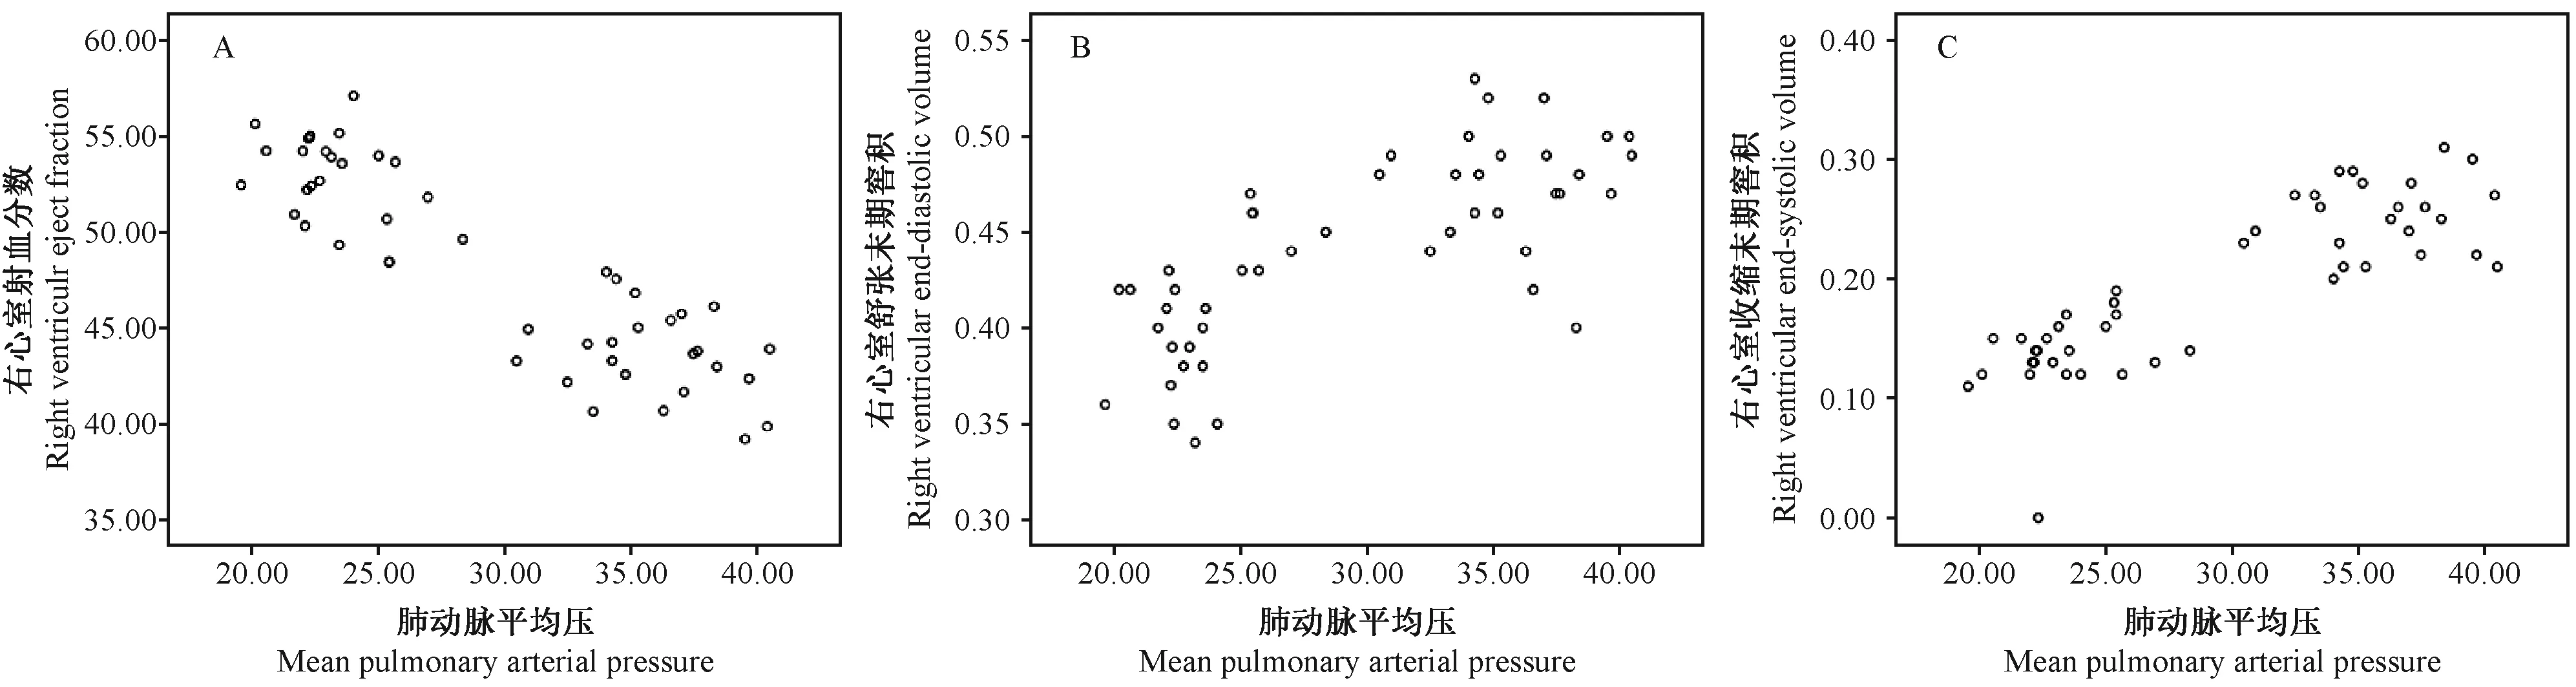
注:右心室射血分数(A), 右室舒张末期容积 (B),右室收缩末期容积 (C)与平均肺动脉压的相关性的散点图。图4 注射野百合碱后1~4周肺动脉高压模型大鼠(n=48)Compared with the mean pulmonary arterial pressure in PAH rats at 1-4 weeks after injection of monocrotaline.Fig.4 Scatter plots of correlation of the RV EF(A), RV EDV(B) and RV ESV (C)
3 讨论
慢性肺动脉高压的预防、监测和治疗均比较困难,及时早期诊断治疗可使20%病人的病情稳定[3]。阐明肺动脉高压发病机制、血流动力学改变和寻找有效的治疗手段已成为该领域亟待解决的重要课题。慢性肺动脉高压动物模型的成功建立则是进行基础和临床研究的平台,目前野百合碱所致的大鼠慢性肺动脉高压模型己经日趋成熟[4,5],给药后2~3周即形成肺动脉高压。
临床上应用MRI检测右心室的功能来评价肺动脉高压(PH) 病情严重程度[6-18]已经越来越受到重视并逐渐应用于临床,本实验基于MCT诱导的大鼠肺动脉高压模型,研究肺动脉高压形成过程中,肺动脉压力的演变和右心功能等血流动力学参数演变之间关系,动态观察右心功能变化。
高艳等[19]研究报道,随着肺动脉压持续升高,右心排出量下降,右心室收缩末期残留血量会逐渐增加,舒张末压增高,超过右心室的代偿能力,促使右心室扩大和右心功能衰竭,右室射血分数(RVEF)值进一步下降,发展成为肺心病,临床特征为RVEF下降,但每搏输出量保持正常以代偿RVEF的减小。而右室EDV、ESV均增大。
本研究发现,野百合碱所致的肺动脉高压大鼠在第1~4周内肺动脉平均压逐渐升高,右心室射血分数逐渐减低,右心室收缩末期和舒张末期容积逐渐增加,但是这种变化在第1~2周时与对照组比较差异无显著性,当到了第3周时这种异常变化与对照组比较差异有显著性,且随着肺动脉压升高时间延长而变化明显,即到第4周,随着肺动脉平均压显著升高,与对照组比较,右心室射血分数显著减低,右心室收缩末期和舒张末期容积显著增加。说明右心功能能参数的变化是随着肺动脉高压的形成而逐渐变化的。通过相关性结果分析,也可以看出肺动脉高压模型组大鼠的右心室射血分数、右心室收缩末期和舒张末期容积等参数与肺动脉平均压有很好的相关性,说明随着肺动脉高压的形成,右心功能是逐渐受损。右心室射血分数、右心室收缩末期和舒张末期容积等右心功能参数是反映肺动脉高压程度的敏感影像学参数。
[1] 张岚,杭小华,贾东梅.COPD患者缓解期家庭氧疗进展[J].解放军护理杂志,2002,19(2):25-27.
[2] Tuder RM, Abman SH, Braun T, et al. Development and pathology of pulmonary hypertension [J]. J Am Coll Cardiol, 2009, 54(1 Suppl): S3-9.
[3] Humbert M,Sitbon O, Chaouat A, et al. Pulmonary arterial hypertension in France:results from a national registry [J]. Am J Respir Crit Care Med, 2006, 173(9): 1023-1030.
[4] Jiang BH, Tawara S, Abe K, et al. Acute vasodilator effect of fasudil, a Rho-kinase inhibitor, in monocrotaline-induced pulmonary hypertension in rats [J]. J Cardiovasc Pharmacol, 2007, 49(2): 85-89.
[5] Raoul W, Wagner-Ballon O, Saber G, et al. Effects of bone marrow-derived cells on monocrotaline and hypoxia-induced pulmonary hypertension in mice [J]. Respir Res, 2007, 30(8): 8.
[6] Thibault HB, Kurtz B, Raher MJ, et al. Non-invasive assessment of murine pulmonary arterial pressure: validation and application to models of pulmonary hypertension [J]. Circ Cardiovasc Imaging, 2010, 3(2): 157-163.
[7] Gao Y, Du XY, Liang L, et al. Evaluation of right ventricular function by 64-row CT in patients with chronic obstructive pulmonary disease and cor pulmonale [J]. Eur J Radiol, 2012, 81(2): 345-353.
[8] Gao Y, Du XY, Qin W, et al. Assessment of the right ventricular function in patients with chronic obstructive pulmonary disease using MRI [J]. Acta Radiol, 2011, 52(7): 711-715.
[9] Gao Y, Qin J, Du XY, et al. Assessment of the right and left ventricular function in patients with cor pulmonale using high-definition CT [J]. Chin Med J (Engl), 2013, 126 (19): 3639-3644.
[10] Roeleveld RJ, Marcus JT, Faes TJ, et al. Interventricular septal configuration at MR imaging and pulmonary arterial pressure in pulmonary hypertension [J]. Radiology, 2005, 234(1): 710-717.
[11] Marcus JT, Gan CT, Zwanenburg JJ, et al. Interventricular mechanical asynchrony in pulmonary arterial hypertension [J]. J Am Coll Cardiol, 2008, 51(7): 750-757.
[12] Dellegrottaglie S, Sanz J, Poon M, et al. Pulmonary hypertension: accuracy of detection with left ventricular septal-to-free wall curvature ratio measured at cardiac MRI [J]. Radiology, 2007, 243(1): 63-69.
[13] Mclure LE, Peacock AJ. Imaging of the heart in pulmonary hypertension [J]. Int J Clin Pract Suppl, 2007, 156(1): 15-26.
[14] Sergiacomi G, Bolacchi F, Cadioli M, et al. Combined pulmonary fibrosis and emphysema: 3D time-resolved MR angiographic evaluation of pulmonary arterial mean transit time and time to peak enhancement [J]. Radiology, 2010, 254(2): 601 -607.
[15] Sanz J, Kuschnir P, Rius T, et al. Pulmonary arterial hypertension: noninvasive detection with phase-contrast MR imaging [J]. Radiology, 2007, 243(1): 70-79.
[16] Sanz J, Kariisa M, Dellegrottaglie S, et al. Evaluation of pulmonary artery stiffness in pulmonary hypertension with cardiac magnetic resonance [J]. JACC Cardiovasc Imaging, 2009, 2(3): 286-295.
[17] Amerom JF,Vidarsson L,Wu S, et al. Regional pulmonary blood flow: Comparison of dynamic contrast-enhanced MR perfusion and phase-contrast MR [J]. Magn Reson Med, 2009, 61(5): 1249-1254.
[18] 高艳,李坤成,杜祥颖,等. 肺心病患者左右心功能的MRI研究 [J]. 临床放射学杂志,2012, 31(2): 192-195.
[19] 高艳,李坤成,杜祥颖,等.回顾性心电门控多层螺旋CT对急性肺栓塞右心室功能障碍及溶栓前后右心室功能变化的评价 [J]. 中华放射学杂志, 2010, 44(9): 931-936.
MRIanalysisofrightventricularfunctioninratmodelofpulmonaryarteryhypertensioninducedbymonocrotaline
GAO Yan, SU Zhuang-zhi
(Xuanwu Hospital of Capital Medical University, Beijing 100053, China)
ObjectiveThe aim of this study was to establish a rat models of pulmonary artery hypertention with monocrotaline, and to study the relationship between the evolution of right ventricular function and the evolution of pulmonary artery pressure (PAP) by magnetic resonance (MR) imaging of the right ventricular function.MethodsRat models of pulmonary artery hypertension were established by monocrotaline (MCT). The model rats were divided into 4 groups: the 1-week-PAH group, 2-week-PAH group, 3-week-PAH group, and 4-week-PAH group, and pulmonary artery pressure in the rats was measured by right heart catheterization. After injection of MCT, we used MRI to evaluate the ventricular function of the rats every week. All the measurement data of right ventricular function in the model group were compared with the average pulmonary pressure using Pearson’s correlation test.ResultsThere were strong correlations between the parameters of RV function in model group with the average pulmonary pressure (r=-0.823 for RV EF,r=0.732 and 0.803 for RV EDV and RV ESV). At 2 weeks after injection of monocrotaline, the mean pulmonary pressure, right ventricular eject fraction (RVEF), the end-diastolic volume (EDV) and the end-systolic volume (ESV)of right ventricle between rats in PAH and the control group showed no significant difference (P>0.05). But three-four weeks after MCT injection, all these parameters were significantly different in the PAH rats than in control rats (P<0.05).ConclusionsAs the pulmonary arterial pressure is increased in the rats, the right ventricular function is gradually impaired. For the monitoring of chronic pulmonary artery hypertension in rats, MRI can be used to accurately measure the changes of parameters. The PAH can be indicated by looking at the changes of parameter such as RV EF, RV EDV and RV ESV.
Pulmonary artery hypertension, PAH; Rat; MRI; Monocrotaline; Right ventricular function
GAO Yan. E-mail: wsggy518@sina.com
Q95-33
A
1005-4847(2017) 05-0534-05
10.3969/j.issn.1005-4847.2017.05.012
北京市自然科学基金(No.7163217)。
高艳(1970-),女,博士,主任医师,副教授。研究方向:心胸、神经系统影像诊断。 E-mail: wsggy518@sina.com