一年一季农作物遥感分类的时效性分析
2017-10-14刘焕军于胜男张新乐郭栋殷继先
刘焕军,于胜男,张新乐,郭栋,殷继先
一年一季农作物遥感分类的时效性分析
刘焕军,于胜男,张新乐,郭栋,殷继先
(东北农业大学资源与环境学院,哈尔滨 150030)
【目的】基于遥感影像的作物分类研究是提取作物种植面积和长势分析及产量估测的基础,也是推动现代化农业快速发展的动力。研究结果可为农业等相关部门掌握农情,进行宏观调控提供依据。目前,农业遥感研究主要集中于中低分辨率遥感影像,影响植被信息提取的精度,应用高分辨率多时相遥感影像和选择最优分类方法可以提高植被信息提取精度。明确农作物遥感分类的时效性与最优分类方法,为快速、准确地获取作物空间分布数据和农情定量遥感监测提供依据。【方法】基于黑龙江省虎林市2014年5—10月覆盖完整生长期的20幅遥感影像,构建16 m分辨率NDVI时间序列曲线,建立决策树分类模型,通过分类影像进行系列阈值分割,并结合辅助背景数据及专家知识,成功提取虎林市土地利用覆被信息;利用20幅影像依次波段合成的方式进行作物分类,明确最优时相;将提取的耕地范围作为作物分类规则,并与未提取耕地范围的作物分类结果进行比较;同时通过最大似然法、马氏距离法、神经网络法、最小距离法、支持向量机、波谱角分类法、主成分分析法多种分类方法进行作物分类;利用农业保险投保地块数据进行精度验证。【结果】(1)7月初、7月末到8月初、9月末是研究区一年一季作物遥感分类的3个关键时相;(2)决策树分类方法在提取土地利用覆被信息的结果中精度最高,总体精度90.24%,Kappa系数0.87;(3)6月初与7月初2幅影像结合采用最大似然法对作物进行分类的总体精度高达94.01%,Kappa系数为0.79,6月初与7月初的影像结合,可以解决作物分类的时效性;(4)结合9月21日的影像,总体精度进一步提高,大豆分类精度明显提高,最终确定最大似然法为最优作物分类方法。【结论】通过遥感数据能实现在7 月上旬对作物进行精准分类,拓展了遥感数据在农业领域的应用价值,对一年一季地区作物快速分类与农情定量遥感监测有重要意义。
时间序列遥感影像;作物分类;时效性;决策树;最大似然法
0 引言
【研究意义】作物类型遥感识别对确定作物空间分布、作物估产、环境监测及人类活动都有重要的意义[1]。作物类型复杂多样,不同作物的反射光谱曲线明显不同,但曲线趋势大致相同,单独应用单时相影像较难,可以利用多时相影像、根据地物在不同时相的差异进行分类。【前人研究进展】近年来,国内外学者先后开展了利用多时相影像、多种遥感数据对作物进行分类的相关研究[2-4]。各学者利用不同遥感数据结合不同区域的特点进行研究,从而实现棉花估量、开发新的地理空间数据库、全球植被遥感监测[5-7]。然而,由于受天气、传感器等限制,不同的遥感数据存在质量、空间、光谱分辨率差异[8-9],不同分类器对不同数据源、不同作物光谱特征的敏感性不同[10];单独使用一种遥感数据难以获得覆盖完整生长期的时相信息。因此,综合不同遥感数据对作物进行分类,可为作物分类提供更准确、完整、可靠的信息。目前常见的利用多时相遥感影像进行作物分类的方法有决策树、支持向量机(SVM)、最大似然法、波谱角分析法、植被指数法等。利用不同遥感影像采用决策树对作物进行分类的应用最为广泛[11-14]。李鑫川等[15]、Zhang等[16]、刘佳等[17]等利用NDVI时间序列对北方作物种类识别。王立辉等[18]、杨闫君等[19]分别采用HJ、高分1数据,利用SVM方法进行遥感图像分类,精度优于最大似然法分类。李彦等[20]采用最大似然分类方法进行多时相的作物分类。Gopal等[21]、Poth等[22]通过神经网络分类,利用不同遥感数据实现了对不同研究尺度的土地覆盖分类。刘磊等[12]基于单时相多光谱数据提取了小麦、大麦、油菜、种植草场的种植信息,大多数学者均采取多时相多光谱数据对作物进行分类。【本研究切入点】目前,新的分类方法层出不穷,但难以确定一种普适性强且分类精度高的方法。因此,确定作物分类时相及分类方法尤为重要,准确的农情监测与估产,需要尽可能早的作物空间分布数据。【拟解决的关键问题】本文以虎林市为研究区,获取不同传感器2014年5—10月共20幅影像,进行如下研究:(1)获取三种传感器NDVI时间序列曲线,并利用20幅影像依次波段合成的方式进行作物分类,确定作物分类关键时期及遥感时相;(2)提取土地利用覆被信息,利用耕地范围作为规则进行农作物分类;(3)利用耕地范围通过对比多种分类方法,并与不提取耕地直接作物分类进行比较,确定最优作物分类方法与时相。
1 材料与方法
1.1 研究区概况
虎林市地处黑龙江省东部,位于45°23′—46°36′N,132°11′—133°56′E,以乌苏里江为界与俄罗斯联邦隔水相望(图1)。属于寒温带大陆性季风气候,生长期平均温度15.7℃,生长期降水量487.6 mm。土壤肥沃,水资源丰富,辖区内有7个农场,主要作物大豆、玉米、水稻。
1.2 数据来源及处理
1.2.1 遥感数据 本文使用的遥感数据包括30 m的HJ-1A/HJ-1B_CCD数据、Landsat8-OLI数据、16 m的高分一号(GF-1_WFV)数据,共20幅(表1),以及黑龙江省30 m分辨率的DEM数据(下载地址:国际科学数据服务平台网址)。
1.2.2 数据处理 对遥感影像进行辐射定标、大气校正、正射校正和自动匹配等预处理过程。由于所用影像分辨率不同,需统一影像空间分辨率,统一重采样为16 m[23]。通过ENVI软件进行(Layer Stacking),并利用波段运算提取归一化植被指数(NDVI)。
1.2.3 地面调查数据 根据2007年8月5日颁布的《土地利用现状分类》国家标准的一级类[24],将研究区土地利用覆盖划分为6个一级大类:水体、建设用地、耕地(旱地、水田)、林地和湿地。结合野外调查,运用人机交互的解译方法在遥感影像上选取训练区,每种地类选取25个样本,并在Google earth高空间分辨率影像上选取验证点,每种地类为30个,应用于土地利用分类提取耕地范围。农业保险公司通过高分辨影像数字化制图提供的4 467个投保地块,经地面调查确定投保地块精度达94.42%,将作物类型无误的2 276个地块应用于农作物分类,随机选1 138个训练样本(玉米271块、大豆163块、水稻709块),1 138个选为验证样本(玉米270块、大豆153块、水稻710块)。

图1 2014年6月11日虎林市Landsat-8影像图(R/G/B:5/4/3)
1.3 主要农作物发育时期
研究区内种有大豆、玉米、水稻3种作物,其中水稻一般在4月播种,大豆、玉米在5月播种,生长期5个月左右。结合本文研究特点,从表2看出6月1日大豆、玉米处于出苗期,水稻处于插秧与分蘖期之间;7月4日大豆处于开花期与结荚期之间,玉米处于拔节与抽雄吐丝期之间,水稻处于分蘖与抽穗期之间;9月21日大豆、玉米、水稻均处于成熟期。表2以旬为时间单位给出了虎林市3种作物的发育时期。
1.4 研究方法
1.4.1 决策树分类模型构建 根据每种地物在遥感影像中的光谱差异,结合不同地类的色调、纹理特征,NDVI信息[25-29],通过决策树对研究区进行土地利用分类。构建决策树模型,根据各地类不同时相NDVI、各波段的反射率和纹理特点,统计6月1日、7月4日2个时期影像各波段的反射率和纹理的最大值、最小值、平均值、标准差。深入分析发现6月1日大部分水和少量水田的NDVI<0.03,其他地类NDVI≥0.03;林地6月1日ISODATA>8或7月4日的NDVI>1;建筑用地根据6月1日纹理特征与7月4日的蓝波段反射率结合将其提取出来。根据6种地类的最大值、最小值结合标准差确定阈值,按照图2所示的决策树分类模型进行分类,利用验证点对分类结果进行验证,当精度验证结果较低时,重新调整阈值进行分类,当精度改善不大时停止调整,接受目前的分类结果。
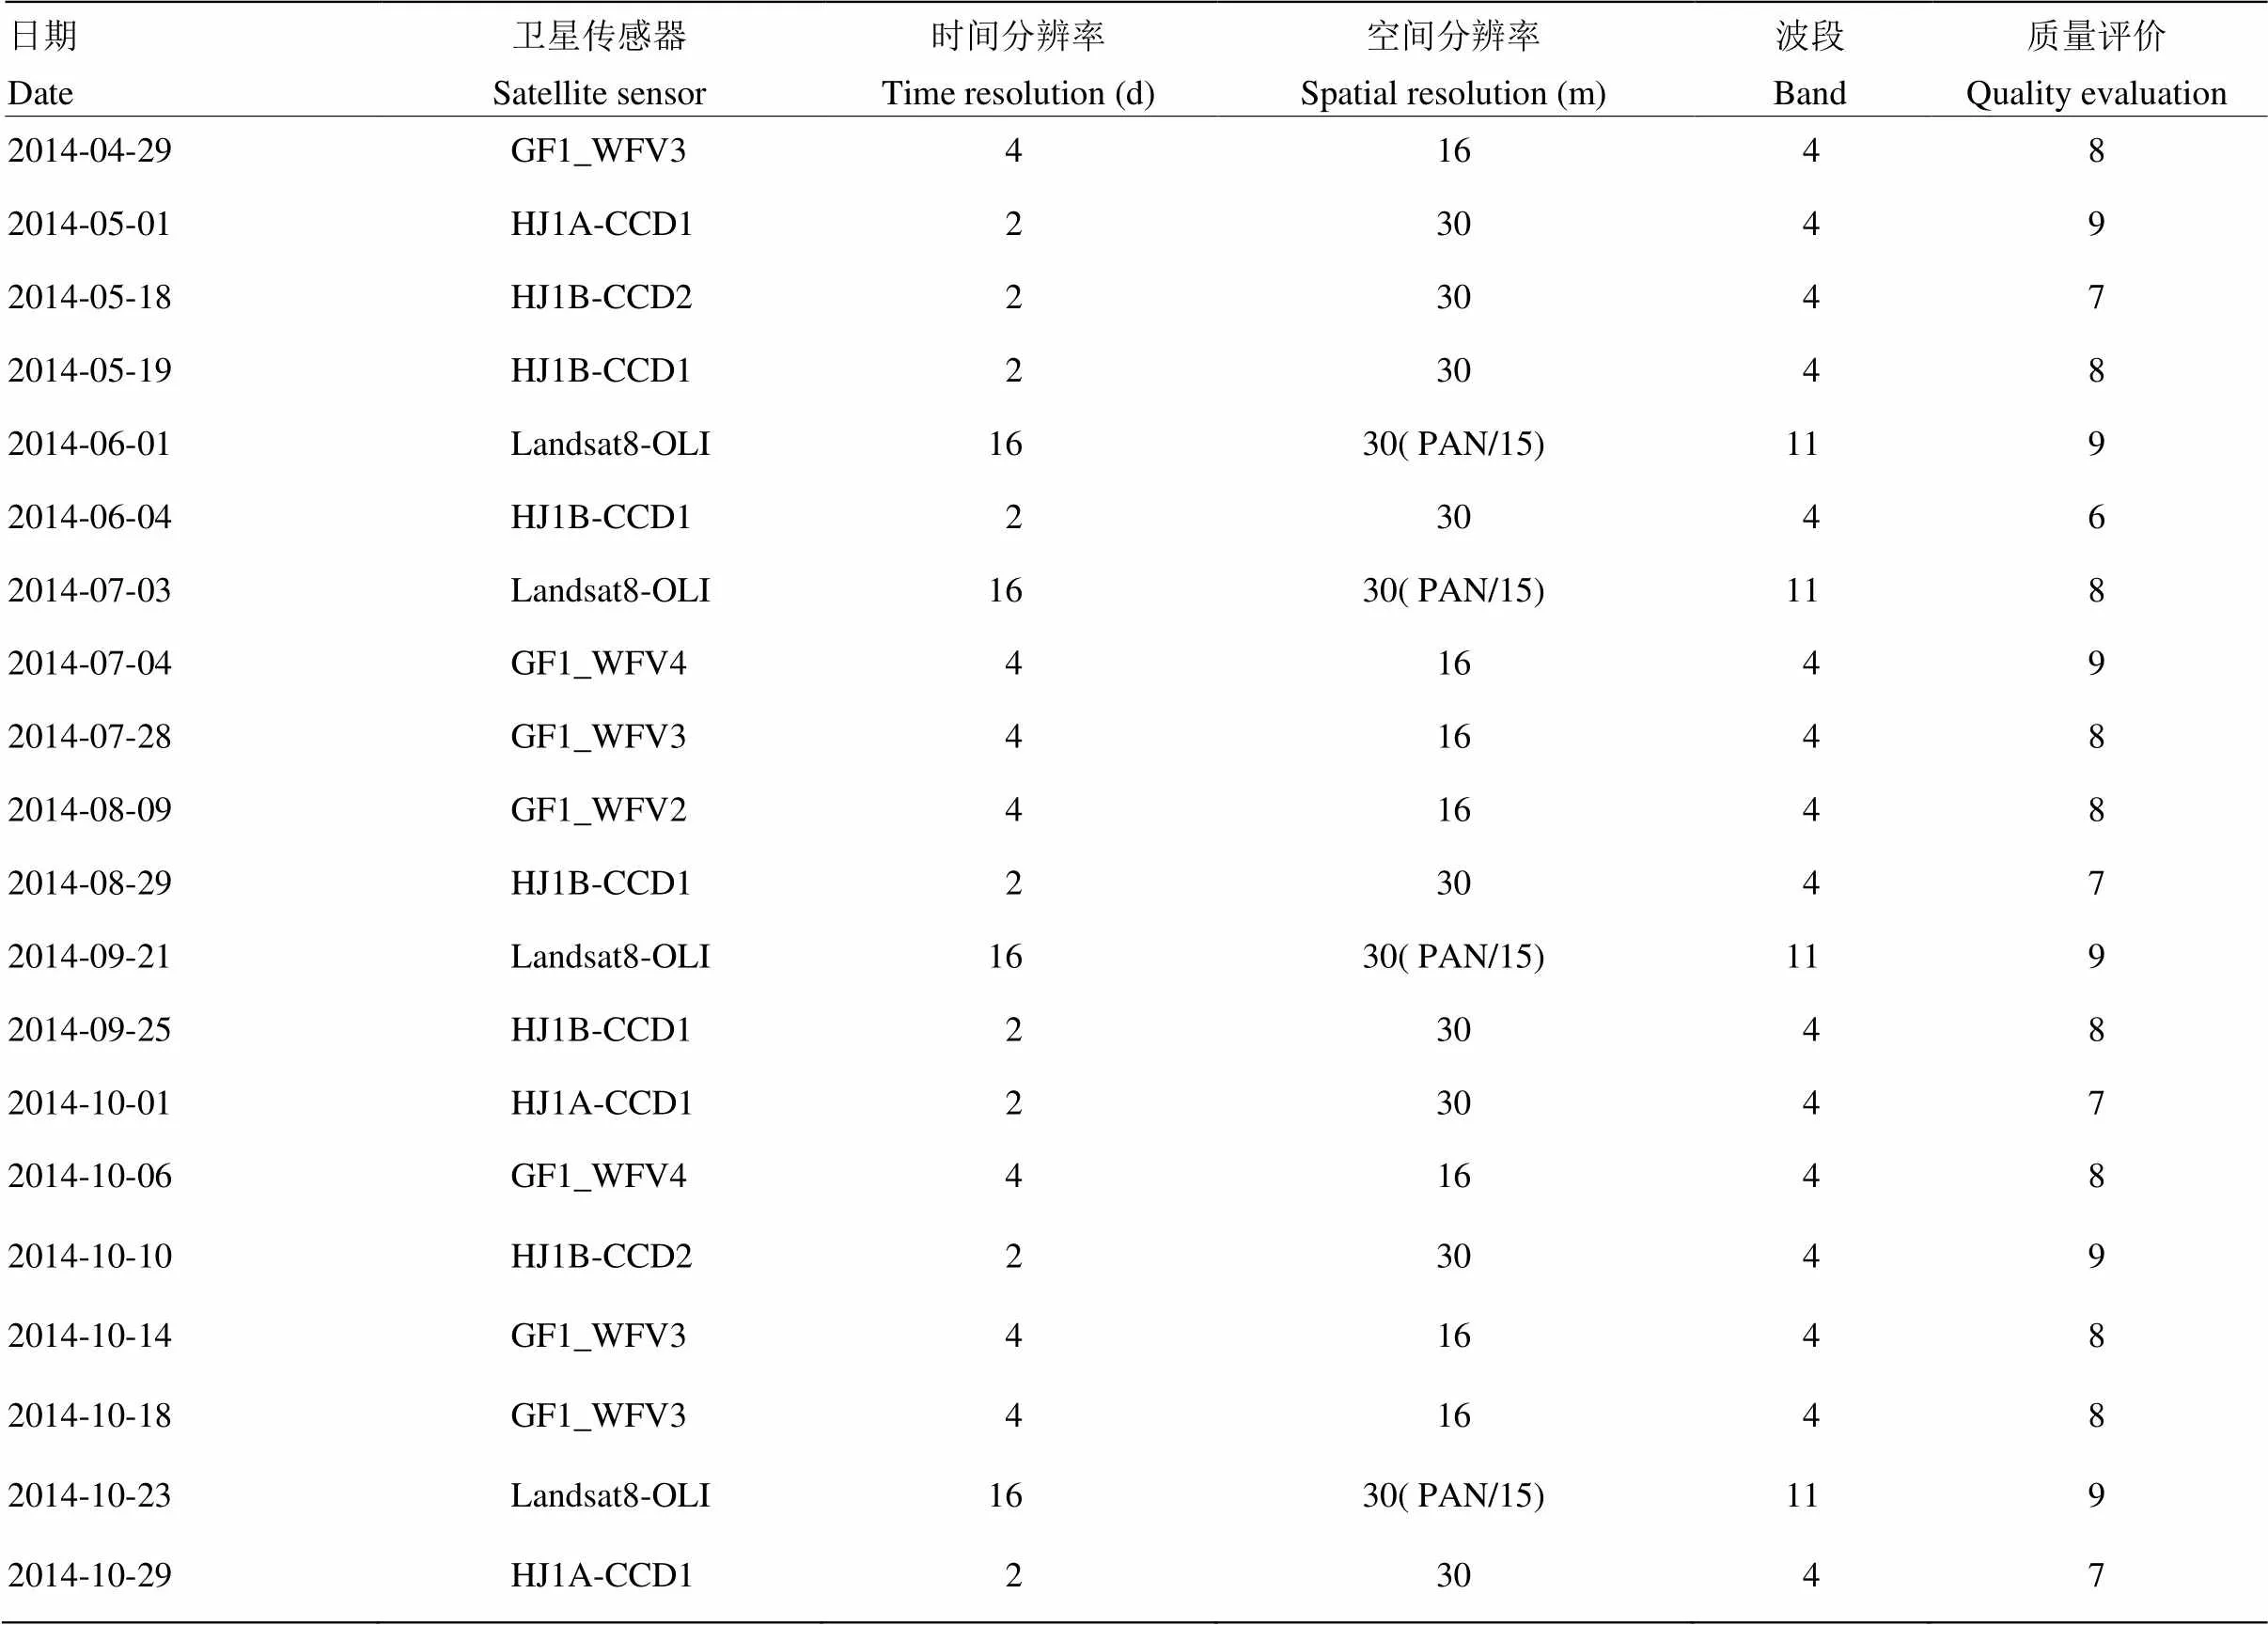
表1 虎林市遥感影像列表
质量评价主要是云覆盖量评价,取值范围0—9,9为质量最高
The quality evaluation is the main evaluation of cloud cover, the range of 0-9, the best quality is 9

表2 虎林市主要农作物发育时期
1.4.2 基于作物分类的监督分类方法对比 通过土地利用分类结果提取耕地,在耕地范围内对作物进行分类(图3)。通过GF-1高光谱和TM多光谱2种数据结合[30],分别利用监督分类中最大似然法、马氏距离法、神经网络法、最小距离法、支持向量机对研究区作物进行分类,GF-1、HJ高光谱和TM多光谱3种数据结合,利用监督分类中最大似然法、马氏距离法、波谱角分类法对研究区作物进行分类,确定最优方法与尽可能早的时相信息。
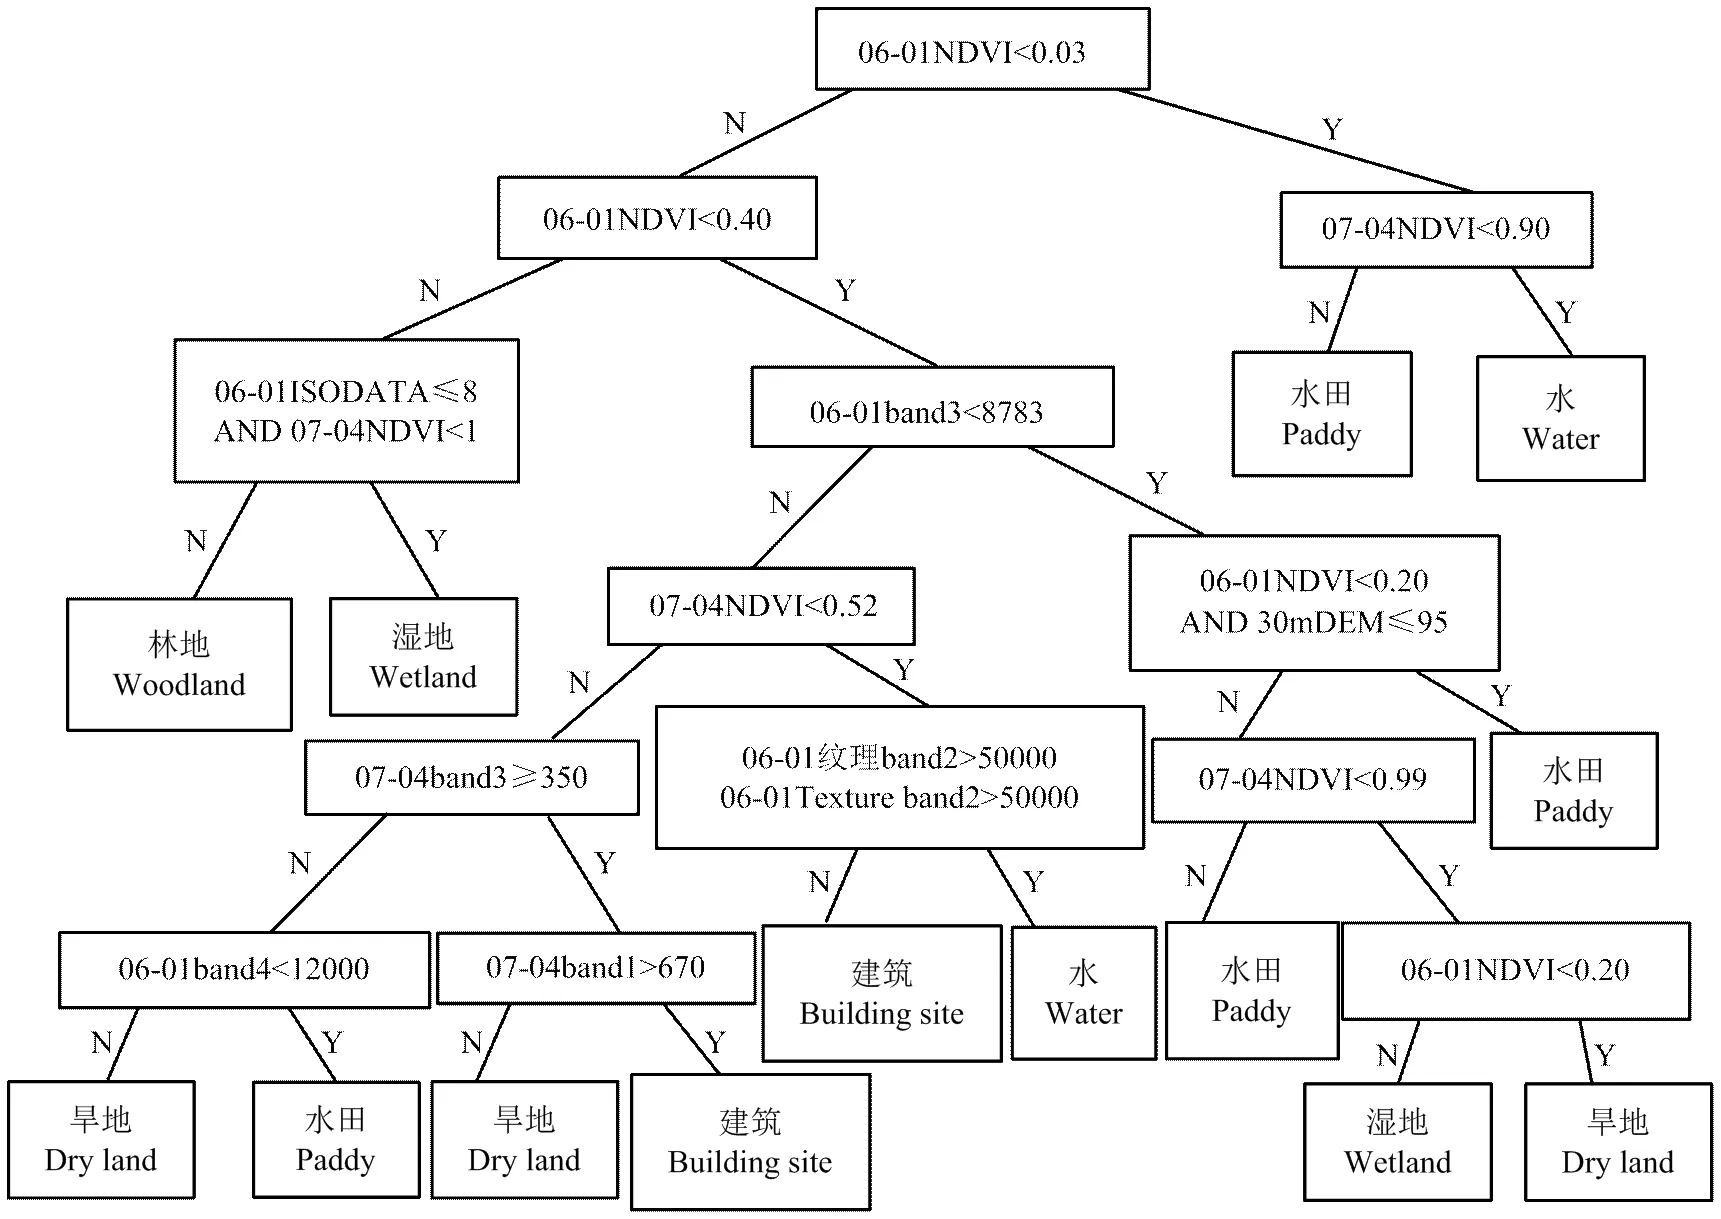
band1:蓝波段反射率;band2:绿波段反射率;band3:红波段反射率;band4:近红外波段反射率;ISODATA:非监督分类
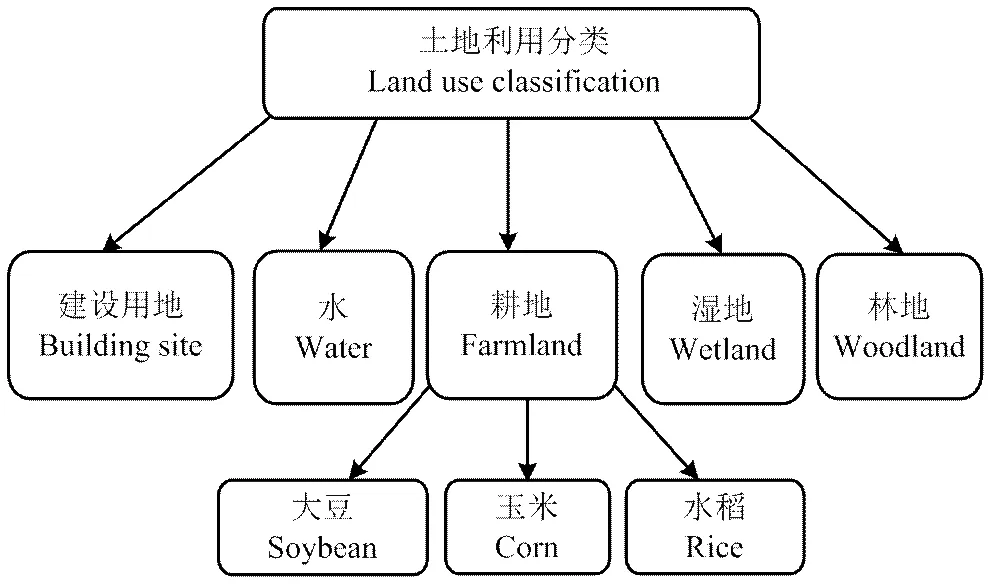
图3 虎林市作物分类流程
2 结果
2.1 作物NDVI时间序列曲线特征
通过20幅遥感影像的NDVI时间序列数据集,绘制不同作物NDVI随时间变化曲线(图4)。从图4可以看出,在6月1日水稻与玉米、水稻与大豆的NDVI差异显著,但是,大豆和玉米的NDVI差异不明显;7月4日大豆、水稻和玉米的NDVI均存在差异;8月9日三种作物的NDVI达到饱和;8月29日到9月25日三种作物的NDVI差异显著。因此以下研究可主要应用其中的影像作为研究的关键期,且通过影像质量和多次试验,最终把6月1日、7月4日作为本研究区作物分类的关键期。
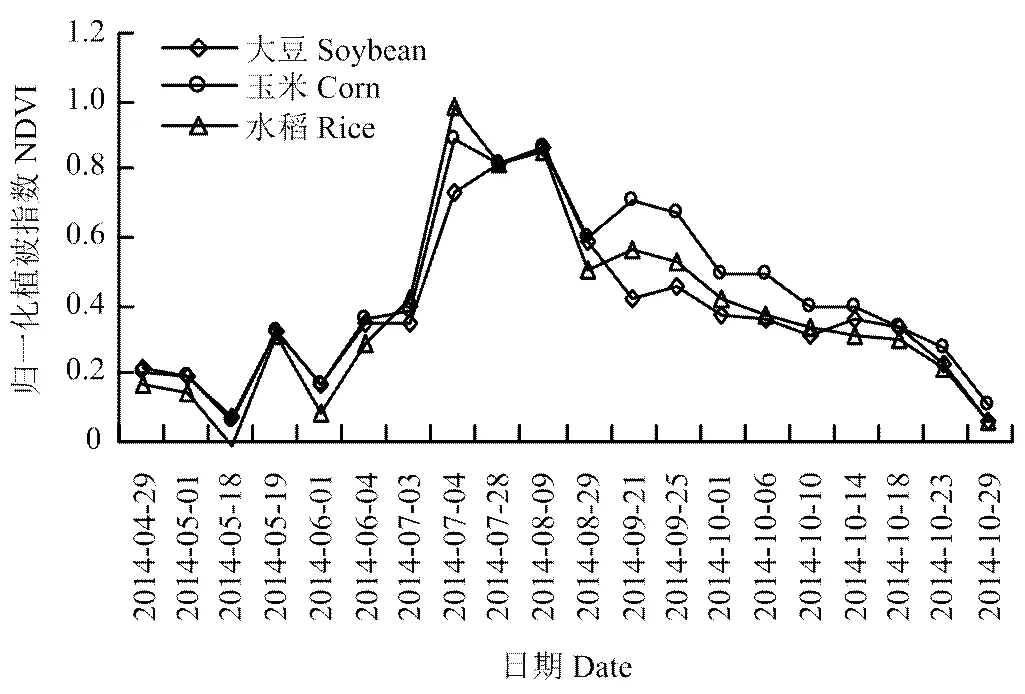
图4 基于遥感影像不同作物NDVI随时间变化曲线
2.2 土地利用分类
利用6月1日、7月4日2个时期影像,对比决策树、面向对象分类和最大似然法3种方法进行土地利用分类,结果表明决策树分类总体精度最高。由土地利用分类结果可以看出,虎林市主要用地类型为建筑用地、耕地(旱地和水田)、水、林地、湿地(图5)。林地主要集中在虎林市北部和西部,占虎林市总面积26.62%;湿地主要集中在东部,占11.34%;虎林市大部分被耕地覆盖,耕地占虎林市总面积的56.65%,耕地主要为水田,占37.66%,旱地相对较少,占18.99%。
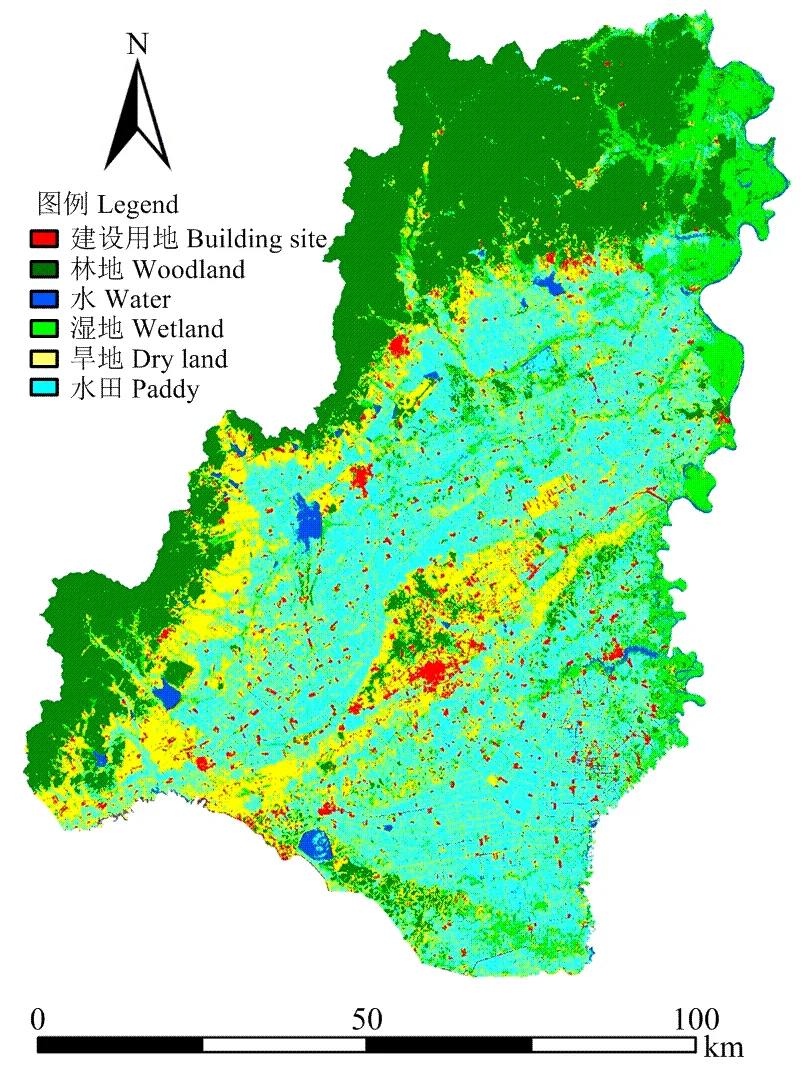
图5 2014年虎林市土地利用分类结果图
2.3 时效性分析
将20幅遥感影像依次波段合成进行作物分类,例如:第一组为2014年5月19日,第二组为2014年5月19日、2014年6月1日2幅合成,第三组为2014年5月19日、2014年6月1日、2014年7月4日3幅合成,以此类推……。图6是以时间为横坐标,以作物分类精度为纵坐标生成的曲线图。从曲线可以看出7月初、7月末到8月初、9月末为3个关键时相,8月初之后分类精度变化不大,9月末分类精度达到最高,综合考虑时效性,7月上旬作物分类精度已基本达到较高精度。
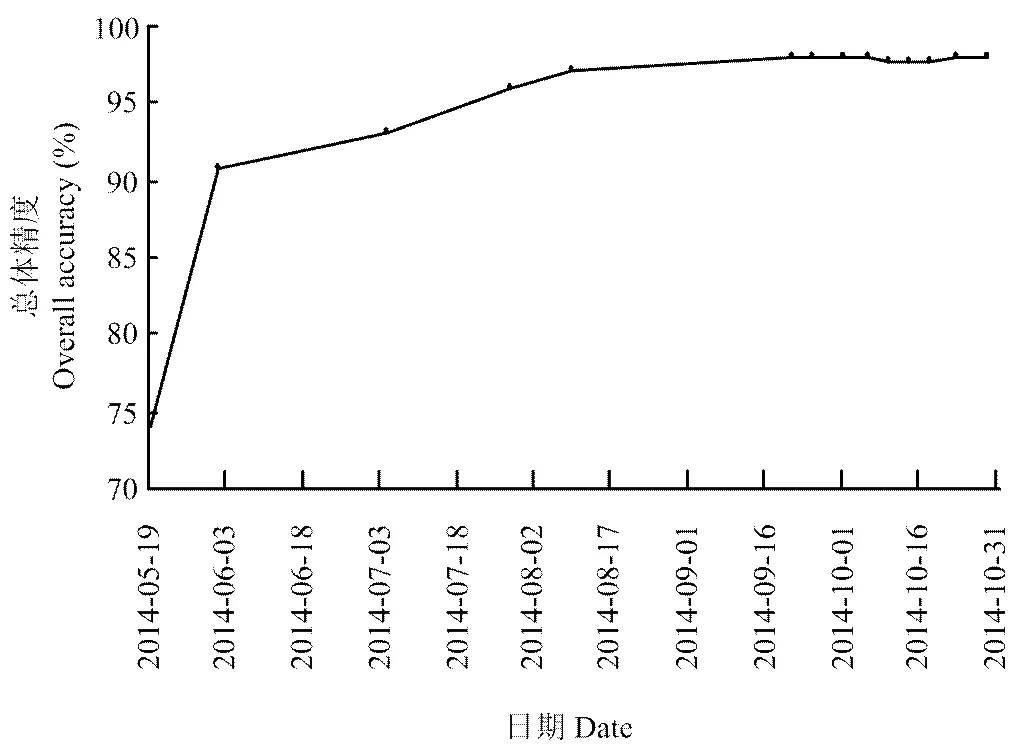
图6 虎林市农作物分类时效性分析曲线
2.4 作物分类
从土地利用分类最优结果中提取的耕地范围。通过多种分类方法的综合对比分析最终发现,基于耕地范围的最大似然法对本研究区农作物分类最为精准(图7)。通过对分类结果分析可知,该区水稻的种植范围最广、覆盖面积最大,其次为玉米和大豆,这3类作物的种植比例与研究区内投保地块统计结果完全一致。虎林市水稻面积占耕地总面积的75.24%,玉米占14.45%,大豆仅占10.31%。

图7 2014年虎林市农作物分类
2.5 精度验证
2.5.1 土地利用分类精度验证 结合研究目的,将旱地与水田合并为耕地,利用验证样本,计算不同分类方法的混淆矩阵(表3),由表3可以看出,最大似然法分类结果较差,决策树分类法总体精度最高,为90.24%,Kappa系数为0.87。其中耕地制图精度高达95.65%。
2.5.2 作物分类精度验证 表4为以耕地作为作物分类规则,通过多种分类方法进行作物分类,得到的精度评价结果。从表4可以看出,利用6月1日、7月4日2幅影像采用最大似然法对研究区作物分类精度高达94.01%,大豆精度较低,水稻精度较高。而采用6月1日、7月4日、9月21日3幅,利用最大似然法的作物分类总体精度最高达97.13%,大豆、玉米精度明显提高。表5为未以耕地为规则直接对作物进行分类的混淆矩阵结果,总体精度为88.19%,Kappa系数为0.60。

表3 土地利用分类混淆矩阵结果

表4 以耕地作为规则的作物分类混淆矩阵结果

表5 未以耕地为规则的作物分类混淆矩阵结果
3 讨论
目前,运用不同分辨率、不同传感器拍摄的遥感影像结合对作物进行分类的研究逐渐成为热点。遥感影像的获取受大气条件、云污染因素等影响,无法获取长时间序列同源遥感影像。本文综合利用3种遥感数据结合,最终在7月上旬实现从土地利用分类到作物分类的全过程。刘新圣等[31]在土地覆盖分类的研究中总体精度为78.07%,李晓东等[32]在农田分类提取中应用全年遥感数据的总体精度为94%,发现决策树分类法可以自动提取影像特征,能对高维数据进行有效的处理,并且该方法运行速度快,准确度高。波谱角分类、主成分分析应用的时相较多;神经网络法和支持向量机处理数据较为耗时;最小距离分类受模式散布的影响,精度不高[33];最大似然方法具有清晰的参数解析能力、易于与先验知识融合、算法简单易于实施等优点[34]。
本研究土地利用分类中所用分类方法总体精度几乎一致,只是每种地类分类精度有所差异,运用决策树分类方法在很大程度上提高了影像分类结果的精度[35],旱地与水田结合制图精度较高,湿地与建筑用地制图精度较差,应考虑结合形状信息和归一化水指数(NDWI)提高其分类精度。本文作物分类中最大似然分类总体精度较高,但大豆用户精度较低,由于只应用7月上旬的影像所含遥感信息有限,导致研究存在一定局限性,结合9月的影像可以提高大豆分类精度,实现大豆与玉米的区分。
4 结论
本文通过覆盖完整生长期的20幅遥感影像,提取3种传感器NDVI时间序列曲线,并综合20幅影像依次波段合成的方式对作物进行分类,分析遥感影像的时效性,确定作物分类关键时期及遥感时相;通过对比多种分类方法,从而实现从土地利用分类到作物分类的全过程。本文旨在应用Landsat 8-OLI(6月1日)、GF-1(7月4日)2种遥感数据且多时相结合,从而实现在7月上旬利用遥感影像对作物进行精准分类。
4.1 通过20幅遥感影像提取3种传感器NDVI时间序列曲线,并利用不同时间序列遥感影像的组合进行分类精度对比,确定虎林市作物分类关键时期为7月初、7月末到8月初、9月末。
4.2 选取出苗期、拔节期2个时期影像,利用决策树方法对土地利用覆被信息进行分类,其中耕地的用户精度为85.71%、制图精度95.65%,进而提取耕地范围作为规则进行农作物分类。
4.3 利用耕地范围通过对比多种分类方法,确定最大似然法为最优分类方法,7月上旬可以实现对研究区作物分类,总体精度高达94.01%,提高了作物分类的时效性。采用6月1日、7月4日、9月21日3幅利用最大似然法的作物分类总体精度最高达97.13%,确定大豆、玉米分类精度的关键时期为9月。
References
[1] Peña M A, Brenning A. Assessing fruit-tree crop classification from Landsat-8 time series for the Maipo Valley, Chile., 2015, 171(15): 234-244.
[2] 邢素丽, 张广录. 我国农业遥感的应用现状与展望. 农业工程学报, 2003, 19(6): 174-178.
Xing S L, Zhang G L. Application status quo and prospect of agriculture remote sensing in China., 2003, 19(6): 174-178. (in Chinese)
[3] Loveland T R, Merchant J W, Ohlen D O, Brown J F. Development of a land-cover characteristics database for the conterminous U.S., 1991, 57(11): 1453-1463.
[4] 宋茜, 周清波, 吴文斌, 胡琼, 余强毅, 唐华俊. 农作物遥感识别中的多源数据融合研究进展. 中国农业科学, 2015, 48(6): 1122-1135.
Song Q, Zhou Q B, Wu W B, Hu Q, Yu Q Y, Tang H J. Recent progresses in research of integrating multi-source remote sensing data for crop mapping., 2015, 48(6): 1122-1135. (in Chinese)
[5] Vellidis G, Tucker M A, Perry C D, Thomas D L, Wells N, Kvien C K. Predicting cotton lint yield maps from aerial photographs., 2004, 5(6): 547-564.
[6] Xiao X, Boles S, Frolking S, Li C, Babu J Y, Salas W, Moore B. Mapping paddy rice agriculture in South and Southeast Asia using multi-temporal MODIS images., 2006, 100(1): 95-113.
[7] Gitelson A A, Kaufman Y J, Merzlyak M N. Use of a green channel in remote sensing of global vegetation from EOS-MODIS., 1996, 58(3): 289-298.
[8] Oetter D R, Cohen W B, Berterretche M, Maiersperger T K, Kennedy R E. Land cover mapping in an agricultural setting using multiseasonal Thematic Mapper data., 2001, 76(2): 139-155.
[9] James G K, Adegoke J O, Saba E, Nwilo P, Akinyede J. Satellite-based assessment of the extent and changes in the mangrove ecosystem of the Niger Delta., 2007, 30(3): 249-267.
[10] 胡琼, 吴文斌, 宋茜, 余强毅, 杨鹏, 唐华俊. 农作物种植结构遥感提取研究进展. 中国农业科学, 2015, 48(10): 1900-1914.
Hu Q, Wu W B, Song Q, Yu Q Y, Yang P, Tang H J. Recent progresses in research of crop patterns mapping by using remote sensing., 2015, 48(10): 1900-1914. (in Chinese)
[11] 马丽, 徐新刚, 刘良云, 黄文江, 贾建华, 程一沛. 基于多时相NDVI及特征波段的作物分类研究. 遥感技术与应用, 2008, 23(5): 520-524.
Ma L, Xu X G, Liu L Y, Huang W J, Jia J H, ChenG Y P. Study on crop classification based on multi-temporal NDVI and characteristic bands., 2008, 23(5): 520-524. (in Chinese)
[12] 刘磊, 江东, 徐敏, 尹芳. 基于多光谱影像和专家决策法的作物分类研究. 安徽农业科学, 2011, 39(25): 15809-15811.
Liu L, Jiang D, Xu M, Yin F. Crops classification based on multi-spectral image and Decision Tree method., 2011, 39(25): 15809-15811. (in Chinese)
[13] 康峻, 侯学会, 牛铮, 高帅, 贾坤. 基于拟合物候参数的植被遥感决策树分类. 农业工程学报, 2014, 30(9): 148-156.
Kang J, Hou X H, Niu Z, Gao S, Jia K. Vegetation phenology parameters fitting decision tree classification of., 2014, 30(9): 148-156. (in Chinese)
[14] 张焕雪, 曹新, 李强子, 张淼, 郑新奇. 基于多时相环境星NDVI时间序列的农作物分类研究. 遥感技术与应用, 2015, 30(2): 304-311.
Zhang H X, Cao X, Li Q Z, Zhang M, Zheng X Q. Study on crop classification based on multi temporal phase environment star time series NDVI., 2015, 30(2): 304-311. (in Chinese)
[15] 李鑫川, 徐新刚, 王纪华, 武洪峰, 金秀良, 李存军, 鲍艳松. 基于时间序列环境卫星影像的作物分类识别. 农业工程学报, 2013, 29(2): 169-176.
Li X C, Xu X G, Wang J H, Wu H F, Jin X L, Li C J, Bao Y S. Crop classification and identification based on time series of environmental satellite images., 2013, 29(2): 169-176. (in Chinese)
[16] ZHANG M W, AHOU Q B, CHEN Z X, LIU J, ZHOU Y, CAI C F.Crop discrimination in Northern China with double cropping systems using Fourier analysis of time-series MODIS data., 2008, 10(4): 476-485.
[17] 刘佳, 王利民, 杨福刚, 杨玲波, 王小龙. 基于 HJ 时间序列数据的农作物种植面积估算. 农业工程学报, 2015, 31(3): 199-206.
Liu J, Wang L M, Yang F G, Yang L B, Wang X L. Remote sensing estimation of crop planting area based on HJ time-series images., 2015, 31(3): 199-206. (in Chinese)
[18] 王立辉, 黄进良, 孙俊英. 基于SVM的环境减灾卫星HJ-1B影像作物分类识别研究. 世界科技研究与发展, 2009, 31(6): 1029-1032.
Wang L H, Huang J L, Sun J Y. Study of crop classification by Support Vector Machine on HJ-1B image., 2009, 31(6): 1029-1032. (in Chinese)
[19] 杨闫君, 黄彦, 田庆久, 王磊, 耿君, 杨冉冉. 基于高分一号卫星WFV影像的水稻信息提取模式. 光谱学与光谱分析, 2015, 35(11): 3255-3261.
Yang Y J, Huang Y, Tian Q J, Wang L, Geng J, Yang R R. The extraction model of paddy rice information based on GF-1 satellite WFV images., 2015, 35(11): 3255-3261. (in Chinese)
[20] 李彦, 魏占民, 张圣微, 王长生, 付小军. 基于遥感的沙壕渠控制区作物种植结构与空间分布研究. 中国农村水利水电, 2012(8): 20-23.
Li Y, Wei Z M, Zhang S W, Wang C S, Fu X J.Spatial analysis and visualization of soil salinization based on ArcGIS., 2012(8): 20-23. (in Chinese)
[21] Gopal S, Woodcock C E, Strahler A H. Fuzzy Neural Network classification of global land cover from a 1°AVHRR data set., 1999, 67(2): 230-243.
[22] Poth A, Klaus D, Voss M, Stein G.Optimization at multi-spectral land cover classification with fuzzy clustering and the Kohonen feature map., 2001, 22(8): 1423-1439.
[23] 刘晓娜, 封志明, 姜鲁光. 基于决策树分类的橡胶林地遥感识别. 农业工程学报, 2013, 29(24): 163-172.
Liu X N, Feng Z M, Jiang L G. Application of decision tree classification to rubber plantations extraction with remote sensing., 2013, 29(24): 163-172. (in Chinese)
[24] GB/T 21010-2007. 土地利用现状分类. 北京: 中国标准出版社, 2007.
GB/T 21010-2007.. Beijing: China Standard Press, 2007. (in Chinese)
[25] 胡玉福, 邓良基, 匡先辉, 王鹏, 何莎, 熊玲. 基于纹理特征的高分辨率遥感图像土地利用分类研究. 地理与地理信息科学, 2011, 27(5): 42-45, 68.
Hu Y F, Deng L J, Kuang X H, Wang P, He S, Xiong L. Study on land use classification of high resolution remote sensing image based on texture feature., 2011, 27(5): 42-45, 68. (in Chinese)
[26] Akar Ö, Güngör O.Integrating multiple texture methods and NDVI to the Random Forest classification algorithm to detect tea and hazelnut plantation areas in Northeast Turkey., 2015, 36(2): 442-464.
[27] Conrad C, Dech S, Dubovyk O, Fritsch S, Klein D, Löw F, Schorcht, G, Zeidler J. Derivation of temporal windows for accurate crop discrimination in heterogeneous croplands of Uzbekistan using multitemporal RapidEye images., 2014, 103(4): 63-74.
[28] Kim H O, Yeom J M. Effect of red-edge and texture features for object-based paddy rice crop classification using RapidEye multi- spectral satellite image data., 2014, 35(19): 7046-7068.
[29] Brown J C, Kastens J H, Coutinho A C, Victoria D D C, Bishop C R. Classifying multiyear agricultural land use data from Mato Grosso using time-series MODIS vegetation index data., 2013, 130(4): 39-50.
[30] Östlund C, Flink P, Strömbeck N, Pierson D, Lindell T.Mapping of the water quality of Lake Erken, Sweden, from imaging spectrometry and Landsat Thematic Mapper., 2001, 268(1): 139-154.
[31] 刘新圣, 孙睿, 武芳, 胡波, 王汶. 利用 MODIS-EVI 时序数据对河南省土地覆盖进行分类. 农业工程学报, 2010, 26(1): 213-219.
Liu X S, Sun R, Wu F, Hu B, Wang W. Land-cover classification for Henan province with time-series MODIS EVI data., 2010, 26(1): 213-219. (in Chinese)
[32] 李晓东,姜琦刚. 基于多时相遥感数据的农田分类提取. 农业工程学报, 2015, 31(7): 145-150.
Li X D, Jiang Q G. Extraction of farmland classification based on multi-temporal remote sensing data., 2015, 31(7): 145-150. (in Chinese)
[33] 任靖, 李春平. 最小距离分类器的改进算法—加权最小距离分类器. 计算机应用, 2005, 25(5): 992-994.
Ren J, Li C P. Improved minimum distance classifier-weighted minimum distance classifier., 2005, 25(5): 992-994. (in Chinese)
[34] 周国琼, 段海军, 陈剑鸣. 基于模糊 C 均值聚类改进的最大似然分类法. 科学技术与工程, 2012, 12(19): 4697-4700.
Zhou G Q, Duan H J, CHEN J M. Improvement for maximum likelihood classification based on Fuzzy C-mean., 2012, 12(19): 4697-4700. (in Chinese)
[35] 陈君颖, 田庆久. 高分辨率遥感植被分类研究. 遥感学报, 2007, 11(2): 221-227.
Chen J Y, Tian Q J. Vegetation classification based on high-resolution satellite image., 2007, 11(2): 221-227. (in Chinese)
(责任编辑 杨鑫浩)
Timeliness Analysis of Crop Remote Sensing Classification One Crop A Year
LIU Huanjun, YU Shengnan, ZHANG Xinle, GUO Dong, YIN Jixian
(College of Resources and Environment, Northeast Agricultural University, Harbin 150030)
【Objective】Crop type remote sensing identification is a basis of crop cultivated area and crop growth analysis and yield estimation, and it is a very important driving force to promote the rapid development of modern agriculture. Atthe same time, it is also a basis for macro-regulation and control of understanding of agricultural conditions by the departments of agriculture as well as other related ones.At present, most of the present researches about agricultural remote sensing are limited to moderate or low resolution remote sensing images, which affect the accuracy of vegetable information extraction. The accuracy of vegetation information extraction can be improved by using high resolution multi temporal remote sensing images and selecting suitable classification methods. Clearly understanding of the timeliness and optimal classification method of crop remote sensing classification, acquire crop spatial distribution data quickly and accurately, and to provide a basis for crop quantitative remote sensing monitoring are the aims of the study.【Method】Based on the 20 remote sensing images covering the whole growth period of 5-10 months in Hulin, Heilongjiang province in 2014, the 16 m resolution NDVI time series curves were built by using 20 images. Different crops had different NDVI time series curves during the whole growth period. The decision tree classification model was established. After analysis of the images through serial threshold division, assisted with background data and expert knowledge,the areas and distributions of the land use and land cover information were extracted.Twenty images were used in order to classify the crops and the optimal phase was defined. Taking the farmland range as the rule, various classification methods for crop classification were compared. And it was also compared with the crop classification without extracting the farmland range by using several common methods of crop classification. Meanwhile, various classification methods including the maximum likelihood method, Mahalanobis distance method, neural network method, minimum distance method, support vector machine, spectral angle classification, and crop classification of principal component analysis were compared, and the data from the insured blocks were employed for the accuracy verification.【Result】 (1) In early July, the end of July to early August, and the end of September are the 3 key phases of crop remote sensing classification in the study area during the first quarter of the year. (2) The decision tree classification method had the highest accuracy in extracting land use cover information, the overall accuracy of classification was up to 94.01%, Kappa coefficient was 0.79. (3) In early June and early July, 2 images combined with classification of crops, the overall of classification accuracy was up to 90.24%, Kappa coefficient was 0.87. The combination of early June and early July images could be used to solve the timeliness of crop classification. (4) Combined with the image of Sep 21st, the overall accuracy was further improved, and the classification accuracy of soybean was improved obviously, so the maximum likelihood method was the best classification method, and the jointing stage was the best phase.【Conclusion】It was concluded that remote sensing images can be used to accurately classify crops in early July. Results of this study have expanded the application value of remote sensing data in the field of agriculture. It has guiding significance for one crop a year of the crop fast classification.
time series remote sensing image; crop classification; timeliness; decision tree; maximum likelihood method
2016-07-29;接受日期:2016-10-14
国家自然科学基金(40801167)、黑龙江省普通高等学校新世纪优秀人才培养计划(1254-NCET-002)、黑龙江省自然科学基金(D201404)
刘焕军,E-mail:huanjunliu@yeah.net。通信作者张新乐,E-mail:zhangxinle@gmail.com
