InteractionbetweenHumicAcidandp-ArsanilicAcidUsingFluorescenceQuenchingApproach
2017-10-13GeSiyiZhouHongSongJiaYuJiaWeiWeiLiShiyin
Ge Siyi, Zhou Hong, Song Jia, Yu Jia, Wei Wei, Li Shiyin,*
1. School of Environment, Nanjing Normal University, Nanjing 210023, China2. School of Geographical Science, Nanjing Normal University, Nanjing 210023, China
InteractionbetweenHumicAcidandp-ArsanilicAcidUsingFluorescenceQuenchingApproach
Ge Siyi1, Zhou Hong1, Song Jia2, Yu Jia1, Wei Wei1, Li Shiyin1,*
1. School of Environment, Nanjing Normal University, Nanjing 210023, China2. School of Geographical Science, Nanjing Normal University, Nanjing 210023, China
Received27 December 2016accepted13 March 2017
Abstract: P-arsanilic acid (p-ASA), as a kind of organoarsenic feed additive, has been widely used in poultry and swine breeding. However, it has caused the arsenic pollution around the farm. Currently data shows humic acid (HA) is closely to the migration and transformation of p-ASA. Therefore, the interaction between p-ASA and HA was investigated by using the method of fluorescence quenching titration. The association constant changed from 2.74 to 4.88 L·mol-1at a pH varying from 5 to 9 and reached the maximum at pH 7. In addition, logK varied from 4.15 to 5.02 L·mol-1when the temperature increased from 15 ℃ to 35 ℃. The logK increased with an increase in the concentration of HA. The dominant mechanism between p-ASA and HA is static quenching. The primary interaction force was likely the hydrogen bond, and the binding behavior occurred on the As-O stretch of p-ASA and the carboxylic acid C=O stretch of HA. The results showed that dissolved organic matters could affect the fate and biogeochemical cycling of organoarsenic pharmaceuticals in aquatic ecosystems.
Keywords: p-arsanilic acid; humic acid; fluorescence quenching; dissolved organic matter; FTIR
As a speciation of organoarsenic feed additive, p-arsanilic acid [(4-aminophenyl) arsonic acid,p-ASA] has been widely used in poultry and swine breeding in developing countries, as well as in other organoarsenic drugs such as roxarsone (3-nitro-4-hydroxyphenylarsonic acid), to improve the poultry’s immunity and increase its weight gain[1-3]. Several places in China were detected that the concentration of arsenic in ground/underground water are out of limits. Most of them come from the abuse of organoarsenic drugs, which is scarcely assimilated in animal bodies, and unchangeably excrete with their litter into the aquatic or soil systems[4]. Some of them might be transformed into inorganic arsenic such as As(V) and As(III) which is more toxic to ecosystems and more carcinogenic to people[4]. Several studies have shown that the migration and transformation of arsenic (including inorganic arsenic and organic arsenic) is closed to dissolved organic matter (DOM)[5-7]. However, little is known about interaction between dissolved organic matter and p-ASA.
Dissolved organic matter is a complex mixture widely existing in soils, aquatic environments, and sediments. It consists of heterogeneous organic macromolecules, and acts as a major reactant in nature because of its various functional groups, which can be combined with different contaminants within the environment[8-9]. As a collection of various substances with low molecular weight, humic substances (HS) play a significant role in biogeochemistry of the aquatic and soil ecosystems, and it is the most important component of DOM since it represents >70% DOM[8]. The HS can be divided into three categories: humic acid (HA), which can only be soluble in alkaline condition, fulvic acid (FA), which is soluble in all, conditions, and humin, which is insoluble in all conditions[10]. Many studies have found that HA exhibits most properties of DOM; for example, HA can combine with most organic contaminants (such as PAHs and metal ions) and affect the fate of the contaminants in the environment by adjusting the existing form, solubility, mobility, transformation, and toxicity[9,11]. Currently, little is known about the interaction mechanism and the possible role of HA in controlling the environmental and biogeochemical fate of p-ASA.
The excitation-emission matrix (EEM) fluorescence quenching introduced by Ryan and Weber (1982) is a common method to analyze the interaction between DOM and contaminants such as PAHs, C60, and various metal ions like Cu2+, Fe3+, because of the productivity and sensitivity of the EEM[10,12-13]. In our work, to evaluate the interaction between the p-ASA and HA, we select the standard fluorescence quenching method, including the three-dimensional excitation-emission matrix fluorescence (3D-EEM) and synchronous-scan fluorescence (SSFS)[13]. Adding pollutants will change the fluorescent properties of HA. We also quantify the change of fluorescence intensity for HA due to the existence of p-ASA. This quantitative data is critical to evaluate the complexation between HA and p-ASA.
The objectives of this study are to 1) explore the binding of p-ASA and HA using the fluorescence quenching titration, 2) measure its 3D-EEM and SSFS, 3) analyze the dominant quenching mechanism between p-ASA and HA, and 4) investigate the influence of environmental factors in this system, such as the HA concentration, pH values, and temperature.
1 Materials and methods
1.1 Materials
Humic acid was purchased from Sigma-Aldrich. p-Arsanilic acid with a purity of 98% was obtained from Shanghai Jinchun Industrial Co. The buffer used in the experiment is 1.0 mmol·L-1of phosphate at pH 7. All chemicals used in this study were AR grade unless mentioned otherwise, and all solutions (e.g., 3 mol·L-1of NaOH, 3 mol·L-1HCl, the stock solution of p-ASA, and phosphate buffer) were dissolved by distilled Milli-Q water (Milli-Q, Molsheim, France). The concentration of HA was calculated by dissolved organic carbon (DOC) concentrations.
1.2 Experiments
The titration experiments between p-ASA and HA were measured by molecular fluorescence photometer (Lumina, Thermo Fisher, America). The p-ASA stock solutions from 0 to 20 mL were added into a series of 25 mL volumetric conical flasks. A certain volume of HA and 1 mL of 1 mmol phosphate buffer were mixed and diluted to 25 mL, and N2was inflated into the mixture solution for 15 minutes to avoid static quenching caused by oxygen. Independent kinetic experiments showed that the reaction could reach equilibrium within 24 h; therefore, all mixture solutions were shaken and stored in the dark for 24 h.
Three independent experiments were carried out, and the results were reported as averages. First, for the HA concentration-dependent experiments, a series of concentrations of HA (6.32, 12.63, and 25.26 mg·L-1) were set to react with p-ASA at pH 7 and the temperature of 25 ℃. Second, for the pH-dependent experiments, 12.63 mg·L-1of HA was titrated by a series of volumes of p-ASA at the pH of 5, 6, 7, 8, 9, respectively, adjusted with 3 mol·L-1of NaOH and 3 mol·L-1of HCl, at the temperature of 25 ℃. Third, for the temperature-dependent experiments, the mixed system of 12.63 mg·L-1of HA and p-ASA were kept at several temperatures, 25 ℃, 30 ℃, 35 ℃, 45 ℃, 55 ℃, respectively, for 24 h using a water bath.
The 3D-EEM spectrum was recorded with a speed of 600 nm·min-1and a 0.02 s delay of response time. The excitation wavelength of this scan was set from 260 to 550 nm, and the emission wavelength of this fluorescence spectra was from 360 to 600 nm. The slit width of both the excitation wavelength and the emission wavelength was 20 nm.
To reveal the mechanism in the interaction between HA and p-ASA, the infrared radiation of HA, p-ASA, and HA-p-ASA was measured. All solutions before measured by Fourier transform infrared (FTIR, Nicolet iS5, Thermo Fisher, USA) were rotary evaporated and freeze-dried. The mg ratio of freeze-dried sample and KBr is 1:200, and it was mixed and grounded using agate mortar[14]. The ground sample was then put into pellets and measured by the FTIR spectrometer in the range of 4 000-400 cm-1with 16 scans and a set resolution of 8 cm-1.
1.3 Data analyses
Static quenching was used to describe the binding behavior between several organic contamination and humic substances (e.g., carbamazepine, PAHs, and pesticides) in diluted solutions. Nearly all of the solutions could be fitted by a 1:1 model[12]. Consequently, static quenching was assumed to describe the binding mechanism between p-ASA and HA in these experiments. The data measured by fluorescence spectroscopic was analyzed by the Ryan-Weber non-linear equation and the modified Stern-Volmer plot to fit the 1:1 model and static quenching[11-12].
2 Results
The binding behavior of HA and p-ASA resembled the interaction between HA and the other organic matters (e.g., PAHs and carbamazepine)[11]. Consequently, the p-ASA is assumed as the quencher, and the HA is quenched. Plots in Fig.1 shows that the fluorescence intensity of p-ASA is larger less than the fluorescence intensities of HA and HA-p-ASA. Therefore, HA is the fluorescence matter, and the p-ASA is the quencher, the assumption was confirmed. According to the fluorescence spectra of kinetic experiments, the reaction of HA and p-ASA can reach equilibrium within 24 h (data not shown here for simplicity). Therefore, after adding p-ASA into the HA solution, the sample should be stirred for 24 h to reach equilibrium.2.1 Fluorescence quenching of HA with the presence of p-ASA
The fluorescence spectra of HA, HA with addition of p-ASA are measured by a three-dimensional excitation-emission matrix fluorescence (Fig.1). According to the contour plots of HA, four major peaks appeared at excitation/emission (Ex/Em) wavelengths of 300 nm/480 nm (peak A), Ex/Em wavelengths of 370 nm/480 nm (peak B), Ex/Em wavelengths of 420 nm/500 nm (peak C), and Ex/Em wavelengths of 460 nm/520 nm (peak D). The four peaks conform the fluorescence properties of dissolved organic matter. Peak A is the main peak, which is the visible fulvic-like fluorescence. Peaks B, C, and D are humic-like fluorescence[15]. Comparing the contour plot of HA without p-ASA (Fig.2a), HA with p-ASA (Fig.2b), we found that the fluorescence intensity of HA decreased with the existence of p-ASA, and the most obvious reduction occurs at peak A. In addition, the location of peak A shifted to the Ex/Em wavelengths of 320 nm/480 nm.
Fig.3 (plot fitted by the Ryan-Weber model) shows that the fluorescence intensity of both peak A and peak D exhibited an obvious decrease with the augment of the concentration of p-ASA. The fluorescence of peak A quenched rapidly in the initial titration; however, after adding 460.72 μmol·L-1of p-ASA, the fluorescence quenched slowly. Instead, the quench rate of peak D remains low during the entire titration. When the concentration of p-ASA reached the maximum, the quenched ratio of peak A could reach more than 30%; meanwhile, the quenched ratio of peak D is less than 13%.
The linear plot in Fig.4 (plot fitted by the modified Stern-Volmer model) indicates the quenching mechanism of HA and p-ASA is inconsistent with a single quenching mechanism, the linearity between F0/F, and the concentration of p-ASA is significant (R2>0.95,P<0.05). Toward the plot of peak D in Fig.4, the line is more parallel to the x-axis with an increase in p-ASA. The similar phenomenon is also detected by the previous study of HA and ROX[16].
2.2 Transient fluorescence of HA and HA-p-ASA
Table 1 is the data obtained by applying the tri-exponential compartment model to fit the fluorescence lifetime of HA and HA with p-ASA. It shows that the fluorescence lifetime of peak A, peak B, and peak D of HA changed slightly after adding p-ASA. Adding p-ASA increased fluorescence lifetime on peak A, but decreased fluorescence lifetime on peak B, peak C and peak D. What’s more, the ratio ofτ0/τof both four peaks is approximately equal to 1 indicates that the lifetime of HA did not change by adding p-ASA.
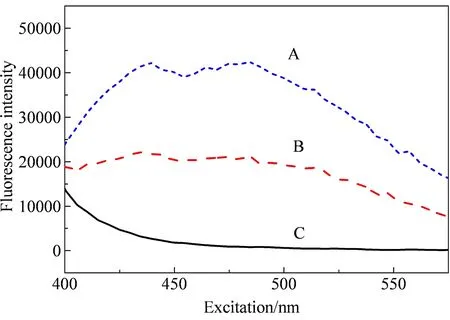
Fig. 1 The fluorescence intensities of HA (A), HA-p-ASA (B), p-ASA (C)

Fig. 2 3D-EEM of HA (a) and HA after addition of p-ASA (b) (conditions: HA 12.63 mg C·L-1, p-ASA 460.72 μmol·L-1, pH 7 and temperature 25 ℃)
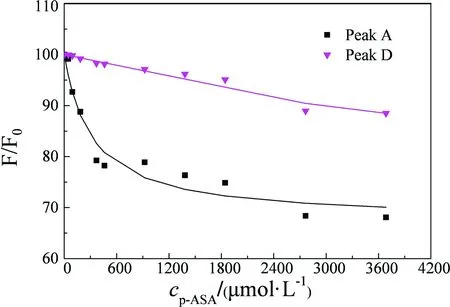
Fig. 3 Fluorescence data of HA peak A and peak D quenching by p-ASA, fitting by a modified Ryan-Weber model curve (conditions: HA 12.56 mg C·L-1, pH 7 and temperature 25 ℃. F0 is the fluorescence intensity of HA, F is the fluorescence intensity of HA with addition of p-ASA)
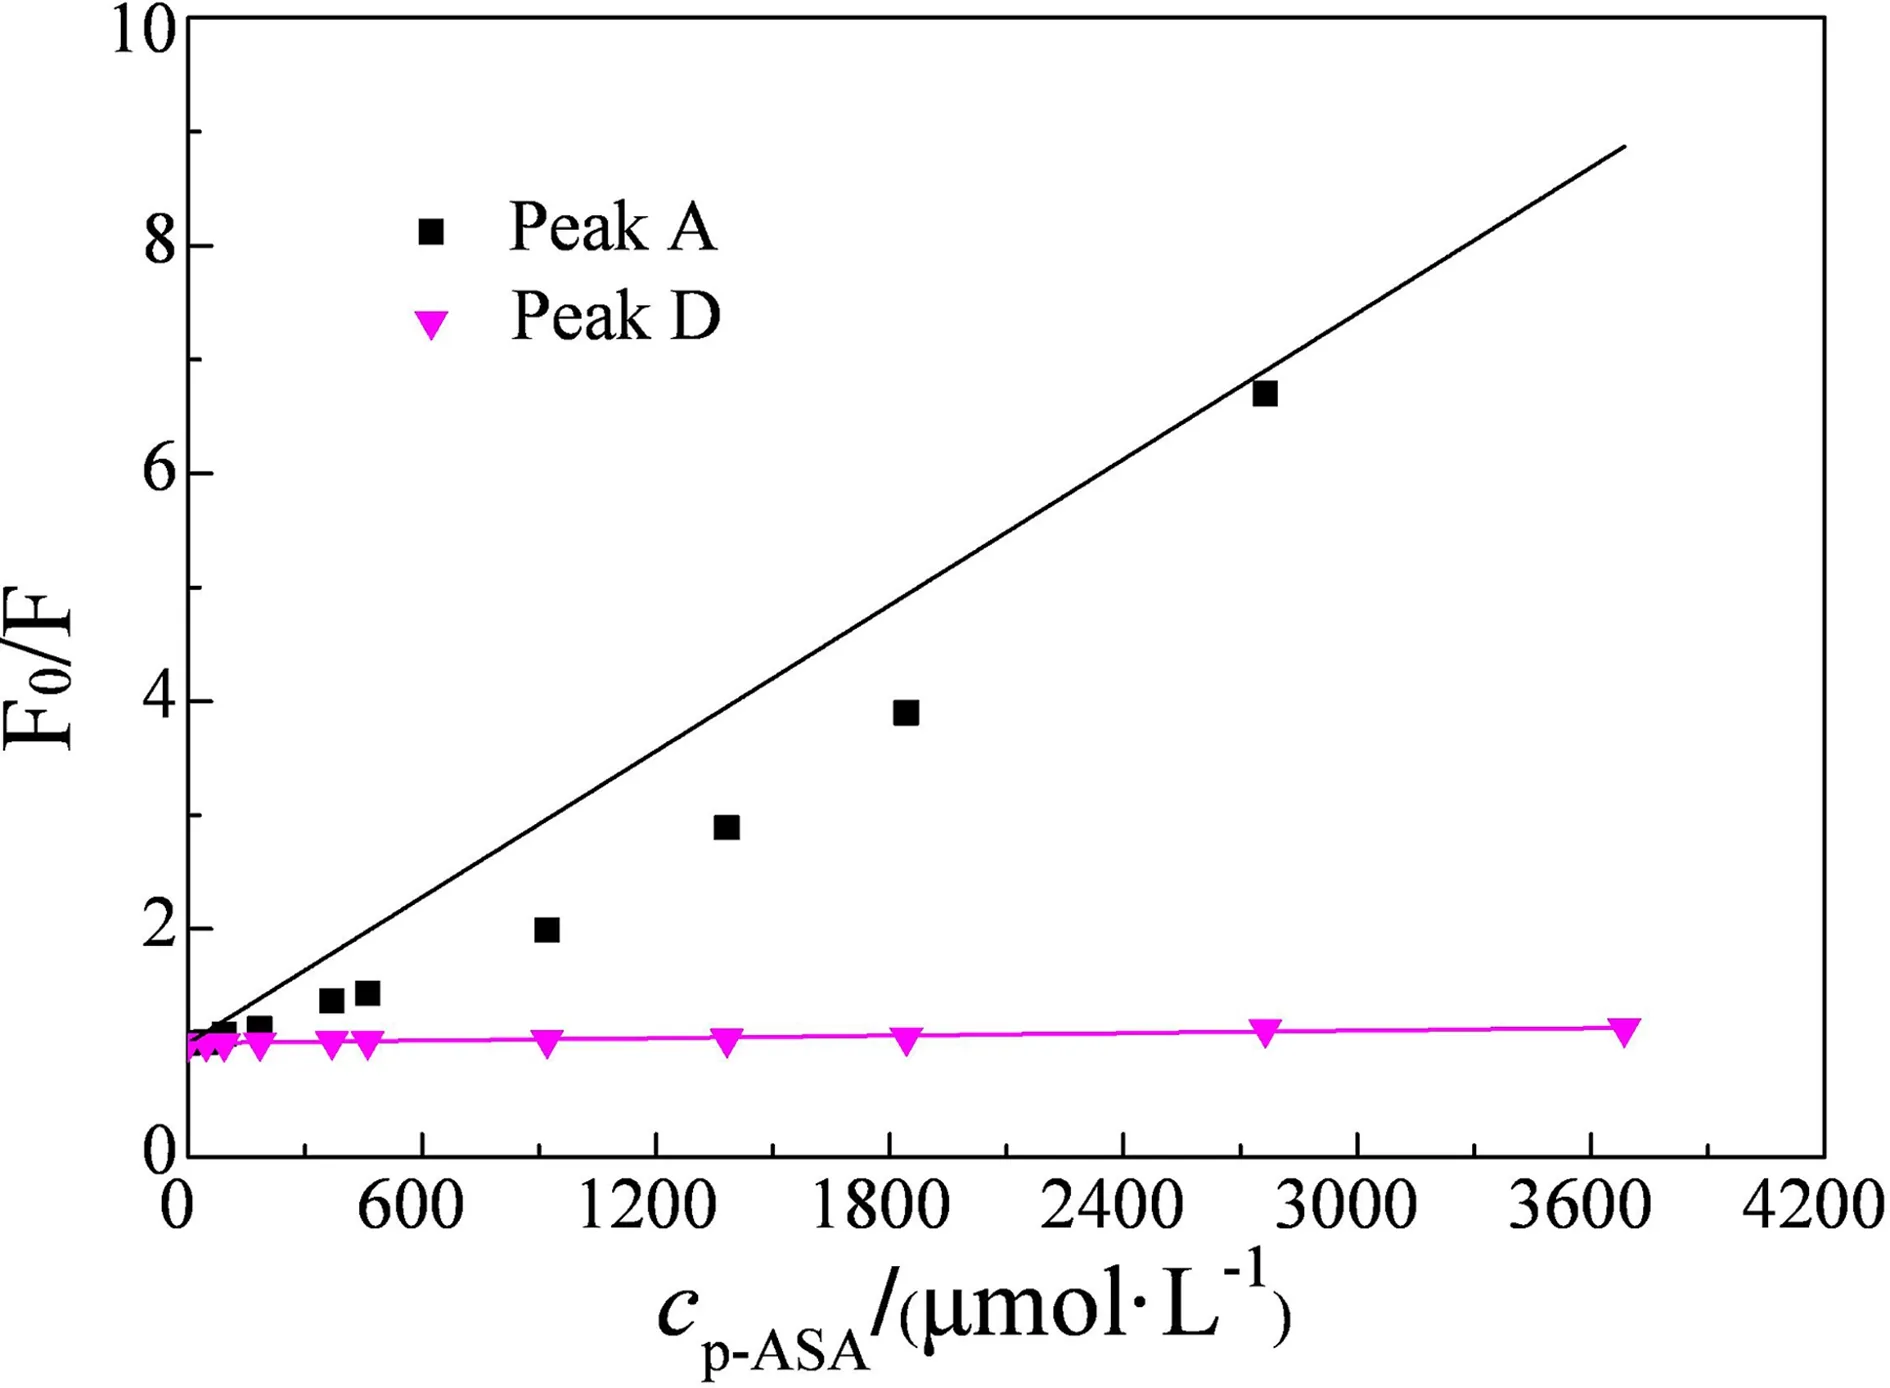
Fig. 4 Fluorescence data of HA peak A and peak D quenching by p-ASA fitting by a modified Stern-Volmer model curve (conditions: HA 12.56 mg C·L-1, pH 7 and temperature 25 ℃)
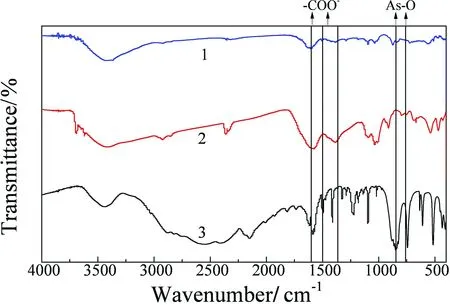
Fig.5 FTIR spectra of HA (line 1), p-ASA (line 2), HA-p-ASA (line 3)
2.3 Interaction between p-ASA and HA at different HA concentration
The logarithms of the association constant of HA and p-ASA at three different HA concentrations are shown in Table 2. All CLcalculated by the Ryan-Weber equation of this experiment is not given here because the value is very low and could contain large errors at a low HA concentration and conditional stability constants[10]. The log K decreased from 5.39 to 2.95 L·mol-1with an addition of the concentration of HA probably implies that the increase of the HA concentration leads to the decreased binding intensity of HA and p-ASA, and the combination degree of HA-p-ASA become larger at a low HA concentration. The value of Fendvaried from 71.85 to 77.85 (which remains greater than zero), probably implying that HA and p-ASA had not reacted completely.
2.4 Influence of pH values and temperature on the reaction of p-ASA and HA
The logarithms of association constant of HA-p-ASA, calculated by the Ryan-Weber model, are listed in Table 3. The logK fluctuated from 2.74 to 4.48 as pH increased from 5 to 9, and it reached the highest at pH 7. Previous studies in the dissolved organic matter and metal ions show that log K increased with pH augment[11], but there is no obvious tendency between pH and logK. The value of Fenddecreased slightly with pH varying from 5 to 6, and then increased when pH increases from 6 to 9. To investigate the influence of temperature to the binding strength of HA-p-ASA, five different temperatures were set, varying from 15 ℃ to 35 ℃.The logK of peak A varies from 4.15 to 5.02 (Table 3) at temperature decreased from 15 ℃ to 35 ℃. Meantime, the log K decreased with an increase in temperature (P<0.01), which means that the binding interaction is weaken with temperature increased.
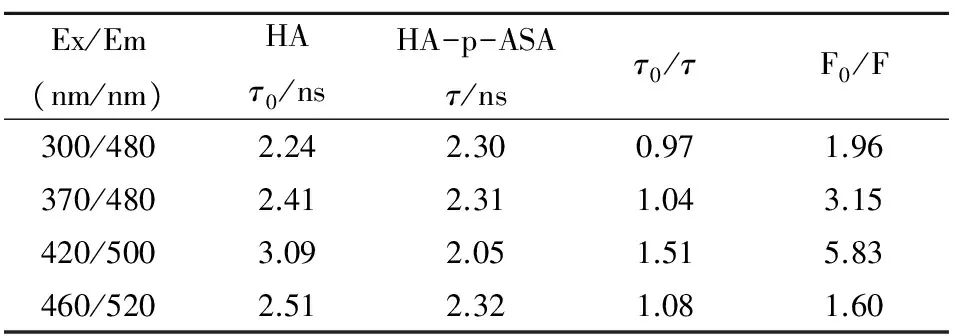
Table 1 Fluorescence lifetime of HA and HA-p-ASA
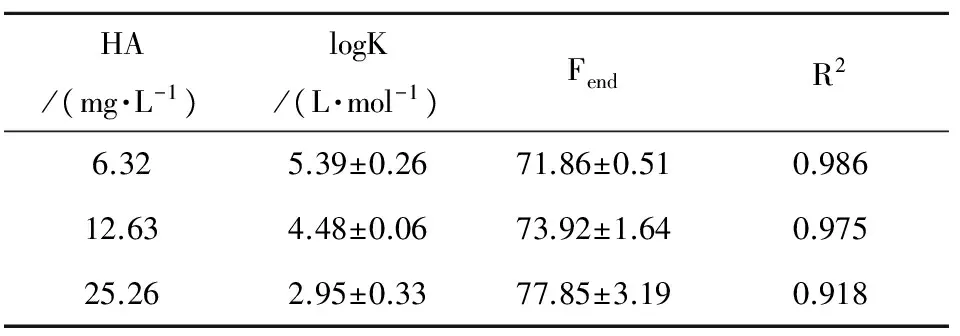
Table 2 The logarithms of association constant (logK) of interaction between HA and p-ASA at varying HA concentration, pH 7 and 25 ℃
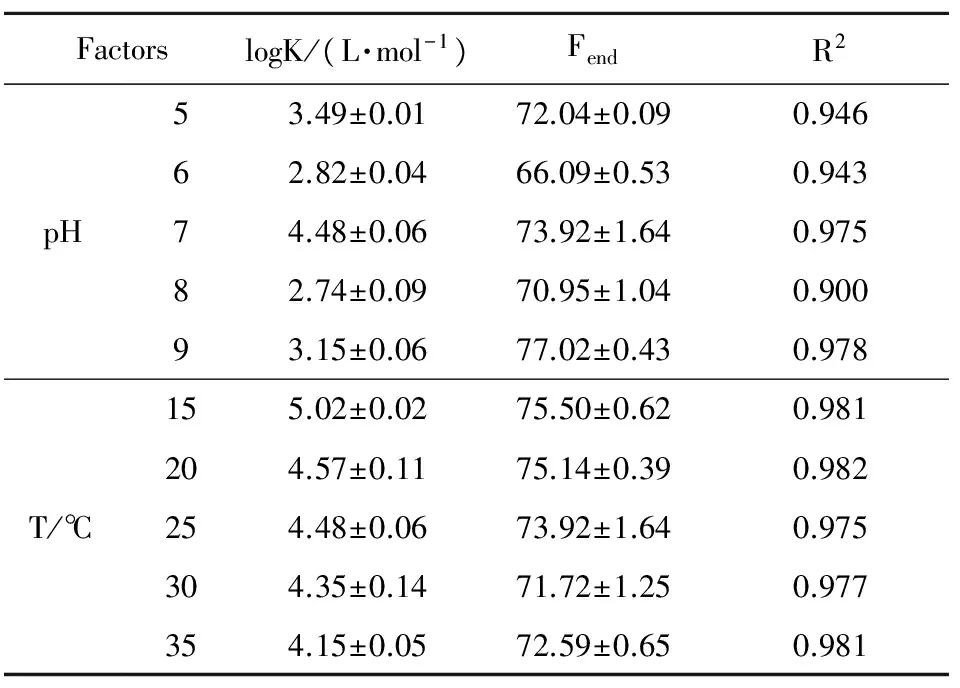
Table 3 The logarithms of association constant (logK) of the interaction between HA (12.56 mg C·L-1) and p-ASA at varying pH and temperature
The van’t Hoff equation is used to fit the relation of association constant and temperature:
lnK=-ΔH0/RT+r
Where ΔH0is the enthalpy change of the reaction between p-ASA and HA, and R is the gas constant calculated as 8.134 J·(mol·K)-1. The fitted line tendency shows that a positive correlation exists between the (natural logarithm of) association constant K and T-1(R2>0.95, P<0.05). The calculated ΔH0between p-ASA and HA is 75.99 kJ·mol-1, which is consistent with the enthalpy change of hydrogen bond[17].
2.5 FTIR spectroscopic analysis of HA and p-ASA
The FTIR spectrum was applied to analyze the mechanism of the interaction between HA and p-ASA. The IR spectra of HA, p-ASA, and HA-p-ASA were compared to each other (Fig.5). Results show that a peak (which assigns to As-O stretching vibration) appeared at 761 cm-1and 846 cm-1of p-ASA, respectively; however, this peak has not been discovered in the IR of HA and HA-p-ASA. This discrepancy probably indicates that the As-O of stretch p-ASA has participated the reaction. Two peaks at 1 600 cm-1and 1 390 cm-1of HA IR are attributed to the asymmetrical stretching vibration and symmetrical stretching vibration of carboxylic acid C=O stretch respectively[18]. However, in the IR of HA-p-ASA, the peak at 1 390 cm-1disappeared, which is likely caused by the reaction of carboxylic acid C=O stretch. To draw a conclusion, the interaction between HA and p-ASA probably occurs on carboxylic acid C=O stretch of HA and As-O stretch of p-ASA.
3 Discussion
The 3D-EEM of HA with or without the presence of p-ASA shows that the fluorescence intensity of HA can be quenched by p-ASA. Comparing the results calculated by fluorescence intensity, it shows that p-ASA fluoresced weakly, and the intensity of p-ASA is less than 3.34% of HA and less than 4.79% of the mixture of HA and p-ASA. This phenomenon confirms that p-ASA is the quencher, and HA is quenched. Meanwhile, the presence of p-ASA can lead to the red shift of peak A of HA. Previous study of the interaction between HA and Hg2+ions shows that the wavelength shift might indicate the change of conformation or rigidity[19].
According to plots fitted by Ryan-Weber model, with the increase of p-ASA concentration, the trend of F/F0is similar to the composite action of metal ions and fulvic acid and confirms the trend of static quenching mechanism, which can be described by a simple 1:1 complexation model[13]. Also, previous study confirms that the dynamic quenching can decrease the fluorescence lifetime of fluorescent group, while the static quenching does not influence the lifetime. The fact that the ratio ofτ0/τis approximately equal to 1 indicates that the lifetime of HA do not change by adding p-ASA, and this phenomenon can further prove that static quenching is the dominant interaction between HA and p-ASA. As for the logarithm of the bimolecular dynamic quenching constant, logKD, calculated by the efficient quencher, O2, is less than 2; however, in HA-p-ASA system, the logK is more than 2. It shows that the logK of between HA and p-ASA is larger than the bimolecular dynamic quenching constant logKD, which can further confirm that the dominant quenching mechanism between HA and p-ASA was static quenching[20].
Moreover, according to Fig.2 and Fig.3, we can found that p-ASA has a greater effect on peak A than peak D. This probably because p-ASA can interact with the fluorescent group represent by peak A. However, the fluorescence intensity of peak D is just slightly quenched means that p-ASA scarcely interacts with fluorescent group represent by peak D.
The influence of different HA concentrations, pH and temperature show that there is still a little differences between the mechanism of metal ions with HA and HA with p-ASA. Experiments demonstrate that the concentration of HA can significant influence the binding degree of HA-p-ASA. With the increase of HA concentration, the binding degree of HA-p-ASA is decreased. This probably because the augment of HA concentration change the system equilibrium, so that decreases the association constant of HA-p-ASA[21]. Also, the Fendof a higher HA concentration is larger than that of a lower HA concentration, possibly caused by the inner filtration of HA and chemical equilibrium[22]. As for the influence of pH, experiments results show that the bonding strength of HA and p-ASA is larger when the system is under a neutral condition. This probably because pH can change the conformation of function group such as phenolic hydroxyl group and carboxyl group in HA, so that influence the binding degree of the system. For the effect of temperature, with an increasing temperature, the association constant of HA-p-ASA decreases. Instead of dynamic quenching, the increase of temperature cannot increase binding constant, on the contrary, it decreased the stability of HA-p-ASA, which could decrease the quench degree of HA by p-ASA, therefore, the logK was decreased[22].This phenomenon conforms to the tendency of statistic quenching[23].
Meanwhile, the calculated △H0between p-ASA and HA is 75.99 kJ·mol-1, which is consistent with the enthalpy change of hydrogen bond[18]. The binding sites can be detected in plots measure by FTIR. Results show peaks which represent the C=O of HA and As-O of p-ASA has changed after interaction. This implies the carboxyle group of HA and As-O of p-ASA participant the reaction. In a word, the As-O of p-ASA is connected with C=O of HA through hydrogen bond during interaction.
p-arsanilic acid as a kind of organoarsenic feed addictive,is exhausted to environment with feces of livestock, and cause arsenic pollution, which can do harm to human health. According to research, p-ASA have static reaction with HA. Hence, it is significant to degrade p-ASA with HA, and is important to eliminate pollution. The percentage of HA bound to p-ASA (α) can be written as:
α = [QL]/[QL]+[L]=K[Q][L]/(K[Q][L]+[Q])
(1)
Where [QL] is the concentration of the compound of p-ASA and HA (mol·L-1), [Q] is the concentration of p-ASA at fluorescence-binding sites (mol·L-1), [L] is the concentration of HA at unbounded binding sites (mol·L-1). Defining CLas the total concentration of ligand L (HA), AssumingCL>>C0, CL≈ L, equation (1) can be simplified as:
α= KCL/(KCL+1) (CL>>C0)
(2)
The percentage of bounded HA is calculated based on a simplified model by the association constant at pH 7, 12.56 mg·L-1HA concentration, and 25 ℃ temperature, which is most approaching the natural condition. The calculatedαaccounts for 69.7%, indicating a large number fraction of HA would interact with p-ASA. The association constant of combined complex HA-p-ASA approaches to pKa of weak acid such as formic acid (pKa 3.74), according previous research, this probably means bounded p-ASA will be released when HA in aquatic system decreased, however, this deduction still need to be proved in following study. What’s more, these data also can demonstrate that the migration and transformation of p-ASA connect tightly with aquatic dissolved organic matter by increase p-ASA solubility to motivate its mobility. In addition, the transformation of p-ASA from sediment to aquatic or soil can also be influenced by DOM by adsorption and complexation, which deserved further study.
In summary, HA fluorescence intensity can be apparently quenched with the addition of p-ASA. The domain quench mechanism between HA and p-ASA is static quenching. The increased HA concentration promotes the logK of HA-p-ASA at peak A and the logK of HA-p-ASA is more than the bimolecular dynamic quenching constant. The complexation model between HA and p-ASA can probably be the 1:1 complexation model. The logK changes from 2.74 to 4.88 at a pH varying from 5 to 9, and it reaches the largest binding degree at a pH of 7. The logK decreases with the increase of temperature, and varies from 4.15 to 5.02 when temperature increases from 15 ℃ to 35 ℃. The enthalpy change of calculated ΔH0between HA and p-ASA is 75.99 kJ·mol-1, which means that the interaction force of HA and p-ASA was hydrogen bond. The binding sites of the interaction between HA and p-ASA are located at the As-O stretch of p-ASA and carboxylic acid C=O stretch of HA.
Acknowledgements:This work was supported by the Major Project of the National Water Pollution Control (2012ZX07101-008), the National Natural Science Foundation of China (Grant No. 41373111).
Corresponding author:Li Shiyin, Male, Assistant Dean and Professor in School of Environment, Nanjing Normal University, Nanjing 210046, China. Research direction: environmental toxicology.
[1] 王素芬,宁建凤,崔理华,等. 外源洛克沙胂对水生态系统砷蓄积及底泥微生物生长的影响 [J]. 生态毒理学报, 2015, 10(3): 177-183
Wang S, Ning J, Cui L, et al. Impacts of exogenous roxarsone on arsenic accumulation and growth of sediment microorganisms in aquatic microcosms [J]. Asian Journal of Ecotoxicology, 2015, 10(3): 173-183 (in Chinese)
[2] Wang L L, Cheng H F. Birnessite (δ-MnO2) mediated degradation of organoarsenic feed additive p-arsanilic acid [J]. Environmental Science & Technology, 2015, 49(6):3473-3481
[3] Jun J W, Tong M, Jung B K, et al. Effect of central metal ions of analogous metal-organic frameworks on adsorption of organoarsenic compounds from water: Plausible mechanism of adsorption and water purification [J]. Chemistry - A European Journal, 2015, 21(1): 347-354
[4] Arts D, Abdus S M, Al-Abadleh H A. Surface interactions of aromatic organoarsenical compounds with hematite nanoparticles using ATR-FTIR: Kinetic studies [J]. Journal of Physical Chemistry A, 2013, 117(10): 2195-2204
[5] Chen T C, Hseu Z Y, Jean J S, et al. Association between arsenic and different-sized dissolved organic matter in the groundwater of black-foot disease area, Taiwan [J]. Chemosphere, 2016, 159: 214-220
[6] Mladenov N, Zheng Y, Simone B, et al. Dissolved organic matter quality in a shallow aquifer of Bangladesh: Implications for arsenic mobility [J]. Environmental Science & Technology, 2015, 49(18): 10815-10824
[7] Zhu J P, Mei T, Peng Y, et al. Characterizing the interaction between roxarsone and humic acid by fluorescence quenching experiment [J]. China Journal of Environment Science, 2014, 35(7): 2620-2626
[8] 王萌, 马陶武, 龙奕, 等. 腐殖酸作用下沉积物中纳米氧华铜对铜锈环棱螺生态毒性的影响[J]. 生态毒理学报, 2014, 9(4): 803-808
Wang M, Ma T, Long Y, et al. Impacts of humic acid on ecotoxicity of CuO nanoparticle in Bellamya aeruginosa under the sediment scenario [J]. Asian Journal of Ecotoxicology, 2014, 9(4): 803-808 (in Chinese)

[10] Bai Y, Wu F, Liu C, et al. Interaction between carbamazepine and humic substances: A fluorescence spectroscopy study [J]. Environmental Toxicology and Chemistry, 2008, 27(1): 95-102
[11] Esteves da Silva J C G, Machado A A S C, Oliveira C J S, et al. Fluorescence quenching of anthropogenic fulvic acids by Cu(II), Fe(III) and UO(2)(2+) [J]. Talanta, 1998, 45(6): 1155-1165
[12] Ryan D K, Weber J H. Fluorescence quenching titration for determination of complexing capacities and stability constants of fulvic acid [J]. Cancer Biotherapy & Radiopharmaceuticals, 1982, 54(6): 12-22
[13] Gauthier T D, Shane E C, Guerin W F, et al. Fluorescence quenching method for determining equilibrium constants for polycyclic aromatic hydrocarbons binding to dissolved humic materials [J]. Environmental Science & Technology, 1986, 20(11): 1162-1166
[14] Rodríguez F J, Schlenger P, García-Valverde M. Monitoring changes in the structure and properties of humic substances following ozonation using UV-Vis, FTIR and 1 H NMR techniques [J]. Science of the Total Environment, 2016, 541: 623-637
[15] Coble P G. Characterization of marine and terrestrial DOM in seawater using excitation-emission matrix spectroscopy [J]. Marine Chemistry, 1996, 51(4): 325-346
[16] Fu Q L, He J Z, Blaney L, et al. Roxarsone binding to soil-derived dissolved organic matter: Insights from multi-spectroscopic techniques [J]. Chemosphere, 2016, 155:225-233
[17] Bai Y C, Wu F C, Liu C Q, et al. Ultraviolet absorbance titration for determining stability constants of humic substances with Cu(II) and Hg(II) [J]. Analytica Chimica Acta, 2008, 616(1): 115-121
[18] Bo P, Qiu M, Min W, et al. The opposite impacts of Cu and Mg cations on dissolved organic matter-ofloxacin interaction [J]. Environmental Pollution, 2012, 161(1): 76-82
[19] Wu F, Cai Y, Evans D, et al. Complexation between Hg(II) and dissolved organic matter in stream waters: An application of fluorescence spectroscopy [J]. Biogeochemistry, 2004, 71(3): 339-351
[20] Meissl K, Smidt E, Schwanninger M. Prediction of humic acid content and respiration activity of biogenic waste by means of Fourier transform infrared (FTIR) spectra and partial least squares regression (PLS-R) models [J]. Talanta, 2007, 72(2): 791-799
[21] Pan B, Ghosh S, Xing B. Dissolved organic matter conformation and its interaction with pyrene as affected by water chemistry and concentration [J]. Environmental Science & Technology, 2008, 42(5): 1594-1599
[22] Garg A, Manidhar D M, Gokara M, et al. Elucidation of the binding mechanism of coumarin derivatives with human serum albumin [J]. Plos One, 2013, 8(5): 1-17
[23] Garbarino J R, Bednar A J, Rutherford D W, et al. Environmental fate of roxarsone in poultry litter. I. Degradation of roxarsone during composting [J]. Environmental Science & Technology, 2003, 37(8): 1509-1514
◆
10.7524/AJE.1673-5897.20161227002
Foundation:National Natural Science Foundation of China (41373111)
FirstauthorGe Siyi(1994-), female, postgraduate student of Nanjing Normal University, research direction is environmental toxicology, E-mail: 610530398@qq.com
*Correspondingauthor,E-mail: lishiyin@njnu.edu.cn
Ge S Y, Zhou H, Song J. Interaction between humic acid and p-arsanilic acid using fluorescence quenching approach [J]. Asian Journal of Ecotoxicology, 2017, 12(3): 667-674