武汉地区水环境中全氟化合物污染水平及其分布特征
2017-10-13周珍胡宇宁史亚利蔡亚岐梁勇
周珍,胡宇宁,史亚利,蔡亚岐,梁勇,3,*
1. 江汉大学光电化学材料与器件教育部重点实验室,化学与环境工程学院,武汉 4300562. 中国科学院生态环境研究中心,环境化学与生态毒理学国家重点实验室,北京 1000853. 江汉大学环境与健康研究院,武汉 430056
武汉地区水环境中全氟化合物污染水平及其分布特征
周珍1,胡宇宁1,史亚利2,蔡亚岐2,梁勇1,3,*
1. 江汉大学光电化学材料与器件教育部重点实验室,化学与环境工程学院,武汉 4300562. 中国科学院生态环境研究中心,环境化学与生态毒理学国家重点实验室,北京 1000853. 江汉大学环境与健康研究院,武汉 430056
武汉作为中国氟化工行业的主要生产基地之一,其水环境中全氟及多氟类化合物(PFASs)污染情况对评估该地区水环境生态安全至关重要。采集了武汉城区10个污水处理厂进、出口污水和19个地表水样品,利用HPLC-ESI-MS/MS技术分析研究该区域水环境中PFASs污染水平及其分布特征。结果发现,武汉地区的污水和地表水样品中,PFASs污染均以短链同系物全氟丁酸(PFBA)和全氟丁基磺酸(PFBS)为主。污水处理厂进、出口污水中PFASs总浓度分别为11.8~12 700 ng·L-1和19.1~9 970 ng·L-1。在城区15个湖水样品中,PFASs总浓度为21.0~10 900 ng·L-1;在流经城区的4个江水样品中,PFASs总浓度为4.11~4.77 ng·L-1,比湖水样品中PFASs浓度水平低1~2个数量级。与污水中PFASs空间分布趋势一致,各湖泊水样中PFASs总体水平呈现汉口 < 汉阳 < 武昌的趋势,表明城市工业布局与人口密度程度直接影响城市PFASs污染空间分布。值得注意的是,与以往水环境中PFASs污染以全氟辛酸(PFOA)和全氟辛基磺酸(PFOS)为主不同,武汉地区水环境中PFASs污染以短链同系物为主,表明短链替代效应已经渐渐在中国化工领域出现,中国全氟行业在响应国际组织规范和建议的基础上做出了实质性进展。然而,对于短链PFASs的污染特征、迁移运输以及生态风险等科学问题,还需要更进一步的研究。
全氟及多氟类化合物;武汉;水环境;分布
Received15 January 2017accepted8 March 2017
Abstract: Wuhan was one of the production bases of the fluorochemical industry in China. Occurrence and distribution of per- and polufluoroalkyl substances (PFASs) in ten major wastewater treatment plants (WWTPs) and nineteen surface water samples from lakes and river were investigated in Wuhan using a high performance liquid chromatograph equipped with an electrospray ionization tandem mass spectrometer (HPLC-ESI-MS/MS). Short-chain homologs, such as perfluorobutanoic acid (PFBA) and perfluorobutane sulfonate (PFBS), were the dominant PFASs in wastewater and surface water samples. The total PFASs concentrations in influents and effluents collected from WWTPs were in a range of 11.8-12 700 ng·L-1and 19.1-9 970 ng·L-1, respectively. The total PFASs concentrations in lake water samples ranged from 21.0 to 10 900 ng·L-1, while the total PFASs levels in river water samples were 1-2 order of magnitudes lower than those in lake water samples, in a range of 4.11-4.77 ng·L-1. Consistent with the trend of spatial distribution in waste water samples, the total PFASs levels in Hankou were lower than those in Hanyang, and the highest levels of PFASs were observed in samples from Wuchang where was covered with factories and dense population, indicating that industrialization and population density were the primary factors affecting the PFASs levels. It’s worth noting that short-chain homologs were the dominant PFASs in water samples, which was different from those in previous studies. These results corroborated with the premise that short-chain PFASs are emerging in China as replacements. However, further research should be performed to determine the levels, transport, and ecological effect of short-chain PFASs.
Keywords: per- and polufluoroalkyl substances; Wuhan; water; distribution
全氟及多氟类化合物(PFASs)具有独特的热稳定性和疏水疏油特性,被广泛应用于工业生产和日常生活的各个领域,例如表面活性剂、灭火泡沫、涂料以及农药等[1-2]。近年,PFASs逐渐成为全球性污染物,在各种环境介质中检出,包括大陆、海洋、极地、野生动物以及人类[3-7]。2009年,斯德哥尔摩公约第四次会议将全氟辛基磺酸(PFOS)及其盐,以及全氟辛基磺酰氟化物(PFOSF)列入新持久性有机污染物(POPs)行列[8]。虽然作为全球主要生产商的3M公司已在2002年停止生产PFASs,但是,欧洲和亚洲一些国家仍然在继续生产和使用PFASs。2009年,中国POSF年产量约为300 t[9]。
研究指出,工业和市政污水处理厂(WWTP)是水环境中PFASs污染的主要来源。在美国、以及欧洲和亚洲等多国污水处理厂进水和出水中都检测到ng·L-1或者μg·L-1数量级的全氟辛酸(PFOA)和PFOS污染[10-12]。虽然污水处理过程能够去除或者吸附一定量的污染物,但是其出水中仍然存在PFASs残留,甚至由于前体物质的降解而导致出水中PFASs污染水平升高[13],而污水中残留的PFASs往往直接进入自然水体[14]。目前,已有一些文献报道了PFASs在污水处理过程中的污染特征和分配规律[15-16]。处理过程中残留的PFASs随着污水处理厂出水排入自然水体,然而,其对受纳水体及周边水体中PFASs污染水平和特征影响的研究还很少。
湖北省位于华中地区、长江中游,因其湖泊众多,被称为“千湖之省”。自1960年代以来,湖北省已成为中国氟化工行业的主要生产基地之一。在早期,氟化工行业主要生产氢氟酸和氟精细化学品。从20个世纪90年代开始,有机氟化工行业因其巨大的市场得到快速发展。Wang等[17]在湖北省某全氟化合物工厂及其周边环境中检测到高浓度的PFASs污染,灰尘中PFOS和PFOA浓度最高分别为4 962 μg·g-1干重和160 μg·g-1干重。武汉作为湖北省的省会城市,位于长江与汉江交汇处,其水域面积达2 000 km2,覆盖全市市区面积的26%。武汉是中国重要的工业基地,拥有钢铁、汽车、光电子、化工、冶金、纺织、造船、制造、医药等完整的工业体系。2006年,Jin等[18]报道,长江三峡库区江水和武汉地区地表水中广泛存在着PFOS和PFOA污染。然而,对于武汉地区全境水域中PFASs污染水平,以及城市污水处理厂出水排放对江河湖泊中PFASs污染的影响,还没有系统的研究报道。
本研究利用高效液相色谱-质谱联用(HPLC-ESI-MS/MS)检测技术,以武汉地区作为研究对象,拟研究短链等10种PFASs在城市污水和地表水中污染水平和分布特征,以期为武汉地区水环境中PFASs生态安全评估提供重要的科学数据。
1 材料与方法(Materials and methods)
1.1 实验试剂和材料
全氟丁酸(PFBA,≥99%)、全氟戊酸(PFPeA,97%)、全氟庚酸(PFHpA,99%)、全氟辛酸(PFOA,≥98%)、全氟壬酸(PFNA,97%)、全氟癸酸(PFDA,98%)和全氟辛基磺酸(PFOS,≥98%)购自Alfa Aesar公司;全氟己酸(PFHxA,≥97%)、全氟丁基磺酸(PFBS,97%)和全氟己基磺酸(PFHxS,≥98%)购自Sigma-Aldrich公司;定量混标PFAC-MXB、内标13C4-PFOS、内标13C4-PFOA和内标13C4-PFBA购自加拿大Wellington Labortories。
甲醇(色谱纯)购自Fisher Scientific公司;醋酸铵(色谱纯)、冰醋酸(色谱纯,>99.8%)和氨水(色谱纯,~50% V/V)购自Alfar公司;去离子水(18.2 MΩ)由Milli-Q Advantage A 10系统(美国,Millipore)提供。滤膜(0.45 μm, 47 mm i.d. glass fibre filter)购自Sartorius Stedim Biotech公司;Oasis WAX 6cc(150 mg)固相萃取小柱购自Waters公司。
1.2 样品采集
武汉地区湖泊众多,长江穿城而过,将武汉市城区分为江东江西,而汉江自西向东汇入长江,又将江西区域分为江南和江北,形成历史上有名的汉口、汉阳和武昌“三镇”格局。本研究以武汉地区为研究对象,采集了武汉市10个污水处理厂(W1~W10)总进水、总出水和相关处理流程水样,共33个污水样品;15个湖泊(L1~L15)地表水和4个江水水样(R1~R4)。采样点分布如图1所示。所有水样均采用事先用甲醇清洗并烘干的聚丙烯采样瓶采集和存储,采集水面0.4 m以上的水样1 L。样品一经采集,立即置于4 ℃储存待分析。

图1 武汉地区污水处理厂和地表水采样分布图Fig. 1 Sampling map
1.3 样品前处理
500 mL湖水样品或者200 mL污水样品经0.45 μm滤膜过滤,加入2 ng 3种内标(13C4-PFBA、13C4-PFOA和13C4-PFOS),充分混匀,4 ℃老化2 h。样品恢复至室温,通过WAX固相萃取小柱富集。WAX固相萃取小柱使用前先依次用4 mL 0.5%氨水甲醇(体积分数)溶液、4 mL甲醇和4 mL去离子水清洗活化,流速为2滴/s。以1滴/s的流速上样,然后分2次使用10 mL 25 mmol·L-1醋酸盐缓冲溶液(pH 4)冲洗杂质,真空抽干残留水分。最后依次用4 mL甲醇和4 mL 0.5%氨水甲醇溶液洗脱,洗脱液氮吹定容至1 mL,离心取上清液进样分析。
1.4 仪器设备与分析条件
色谱系统:UltiMate 3000液相色谱仪,配有UltiMate 3000自动进样器、P680二元梯度泵和Chromeleon 6.70色谱工作站(美国Dionex公司);分析柱为Acclaim 120 C18型色谱柱(4.6 mm×150 mm,5 μm,美国Dionex公司)。采用A相(甲醇)和B相(50 mmol·L-1醋酸铵溶液)二元梯度淋洗;10 μL进样,流速1 mL·min-1。具体淋洗条件为:0~4 min,28% B~5% B;4~7 min,5% B;7~10 min,28% B。
质谱系统:API 3200三重四级杆串联质谱检测系统(美国AB公司),配有电喷雾(ESI)离子源和Analyst 1.4.1工作站。质谱分析条件:气帘气0.24 MPa;碰撞气0.021 MPa;离子喷雾电压-2 000 V;温度400 ℃;离子源Gas1为0.34 MPa;Gas2为0.24 MPa。
1.5 质量保证与质量控制
采用内标法定量,使用一系列浓度梯度标准曲线(0、20、50、100、500、1 000、5 000、20 000和50 000 pg·mL-1),保证标准曲线每个点的实际值与其理论值之间偏差不超过20%。其中,内标13C4-PFBA、13C4-PFOA和13C4-PFOS分别作为PFCAs(C3, C4)、PFCAs(C5~C9)、以及PFSAs(C4, C6, C8)的定量内标。仪器检出限(LOD)定义为信噪比大于3(S/N ≥ 3)的浓度。每10个样品做一个程序空白,所有容器事先用甲醇清洗,严格控制分析过程中的空白值。为了考察方法回收率和重现性,依照1.3样品前处理方法,分别对湖水和污水样品进行加标回收实验,加标水平分别为2 ng和10 ng,平行测定5份。湖水样品加标回收率为91%~106%,相对标准偏差(RSD)为5.1%~11%;污水样品加标回收率为89%~105%,RSD为6.8%~11%。
2 结果与讨论(Results and discussion)
2.1 污水中PFASs水平及其空间分布
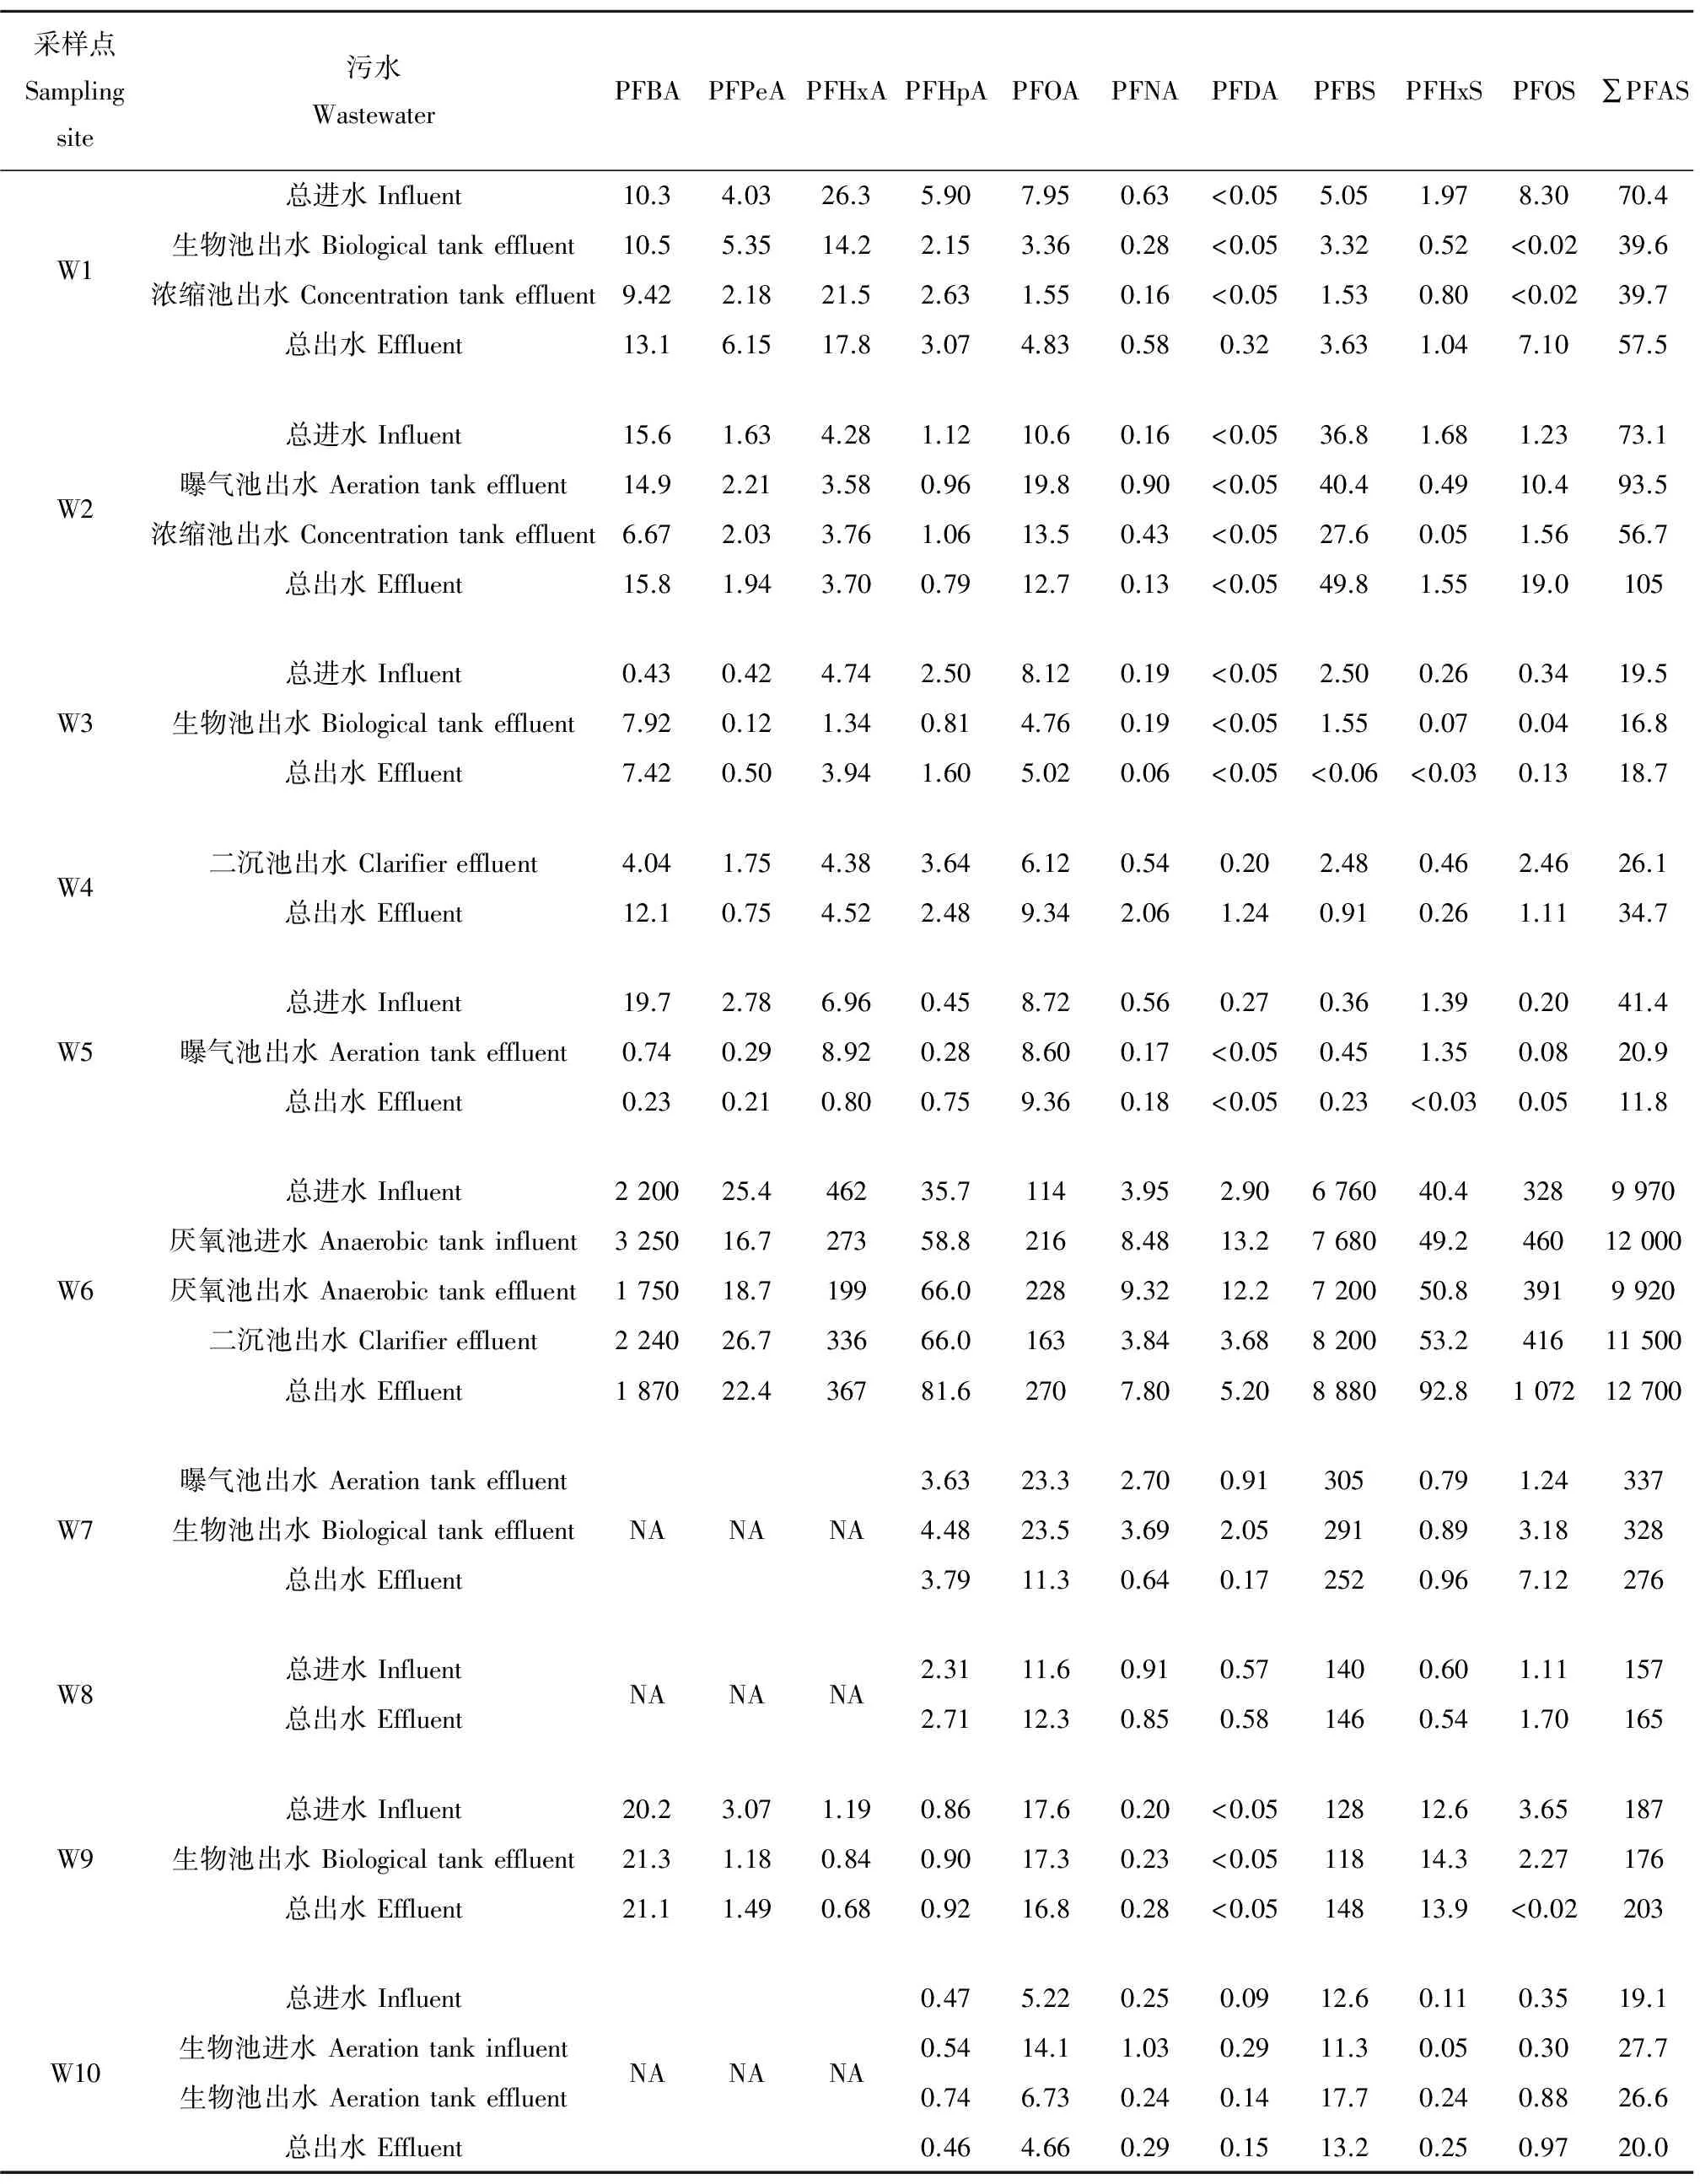
如图2A所示,W1污水中PFASs以PFBA和PFHxA为主,分别占总PFASs的15%~26%和31%~54%。W3、W4和W5污水中PFASs以PFBA和PFOA为主,分别占总PFASs的2%~48%和21%~79%。W2、W6、W7、W8、W9和W10污水中PFASs以PFBS为主,其次是PFBA和PFOA,分别占总PFASs的41%~91%、10%~27%和1%~51%。武汉市10个污水处理厂污水中PFASs污染特征与以往文献报道不同。Pan等[19]研究了北京市7个污水处理厂污水中PFASs水平,发现污水中PFASs以PFOA为主。而本研究所采集的武汉市污水处理厂污水样品中PFASs以短链PFASs为主,表现出不同的污染特征。随着国际组织对八碳全氟产品生产和使用的限制或者禁止,短链PFASs逐渐作为替代产品被广泛应用[20]。在武汉市污水样品中,发现了以短链为主的PFASs污染特征,表明现在短链替代效应已经渐渐在中国化工领域出现,说明中国全氟行业在响应国际组织规范和建议的基础上,做出了实质性进展。
在武汉市10个污水处理厂中,各个污水处理厂的总进水与总出水中PFASs水平相当(表1)。其中,W6污水中总PFASs浓度水平最高(总进水:9 970 ng·L-1;总出水:12 700 ng·L-1),其次是W7(总出水:276 ng·L-1)、W9(总进水:187 ng·L-1;总出水:202 ng·L-1)、W8(总进水:157 ng·L-1;总出水:165 ng·L-1)、W2(总进水:73 ng·L-1;总出水:105 ng·L-1)、W1(总进水:70.4 ng·L-1;总出水:57.5 ng·L-1),W3、W4和W5污水中总PFASs浓度水平相当(总进水:19.5~41.4 ng·L-1;总出水:11.8~34.7 ng·L-1),W10污水中总PFASs浓度最低(总进水:19.1 ng·L-1;总出水:20.0 ng·L-1)(图2B)。从10个污水处理厂的空间分布区域可以看出,位于汉口的W1和位于汉阳的W2~W5污水处理厂污水中PFASs浓度水平较低;位于武昌的W6~W9污水处理厂污水中PFASs浓度水平较高,特别是W6污水处理厂,其污水中PFASs浓度水平远高于本研究中所有其他污水处理厂污水中PFASs浓度水平。武昌区建有各种化工企业,特别是W6污水处理厂所服务的区域是高新技术开发区。可以推测,武昌地区各化工企业的工业排污,可能对该区域W6~W9这4个污水处理厂污水中PFASs污染具有一定的贡献。对于W10污水处理厂,其PFASs污染水平最低,可能由于其位于大学园生活区,工业污水排放量小而生活污水排放量大,在一定程度上稀释了工业污水造成的PFASs高污染。

图2 污水处理厂水样中全氟及多氟类化合物(PFASs)组成百分比(A)和∑PFAS浓度水平(B)注:a表示总进水,b表示总出水。PFBA, PFPeA, PFHxA, PFHpA, PFOA, PFNA, PFDA, PFBS, PFHxS, PFOS为全氟丁酸、全氟戊酸、 全氟己酸、全氟庚酸、全氟辛酸、全氟壬酸、全氟癸酸、全氟丁基磺酸、全氟己基磺酸和全氟辛基磺酸。Fig. 2 Relative composition (A) and levels (B) of per- and polufluoroalkyl substances (PFASs) in waste water samplesNote: a=influent; b=effluent. PFBA, PFPeA, PFHxA, PFHpA, PFOA, PFNA, PFDA, PFBS, PFHxS, PFOS stand for perfluorobutanoic acid, perfluoropentanoic acid, perfluorohexanoic acid, perfluoroheptanoic acid, perfluorooctanoic acid, perfluorononanoic acid, perfluorodecanoic acid, perfluorobutane sulfonate, perfluorohexane sulfonate and perfluorooctane sulphonate.

图3 地表水样品中PFASs组成百分比(A)和∑PFAS浓度水平(B)Fig. 3 Relative composition (A) and levels (B) of PFASs in surface water samples

表1 武汉地区污水处理厂各流程PFASs浓度水平(ng·L-1)Table 1 Concentrations of PFASs in water samples from treatment processes in WWTP (ng·L-1)
注:aNA未检测。
Note:aNA was no detected.
W6污水处理厂服务于高新技术开发区,该区域包含各种工业,如电子、制药、新材料、化工等。W6污水处理厂污水中PFASs浓度高于先前文献报道的其他地区污水处理厂浓度水平[3, 19, 21],可能源于周边化工污水的排放[22]。武汉市除W6以外其他9个污水处理厂总进水中PFOA浓度为5.22~17.6 ng·L-1(中位值:8.72 ng·L-1),PFOS浓度为0.20~8.30 ng·L-1(中位值:1.11 ng·L-1);总出水中PFOA浓度为4.66~16.8 ng·L-1(中位值:9.36 ng·L-1),PFOS浓度为0.05~19.0 ng·L-1(中位值:1.70 ng·L-1)。这些污水处理厂污水中PFOA和PFOS浓度与北京市部分污水处理厂污水中浓度水平相当,但是低于北京市污水处理厂污水中PFOA和PFOS总体水平[19, 23],更远低于其他国家/地区,如纽约、克里卡兰、北卡罗莱纳州的污水处理厂污水中PFOA和PFOS浓度水平[24-26]。这一结果一方面表明,武汉市城市污水受到相对较低浓度的PFOA和PFOS污染;另一方面,结合前面所提到的,武汉地区PFASs污染以短链PFASs为主,且PFOA和PFOS污染水平较低,可能源于短链替代效应的出现。

表2 武汉地区地表水中PFASs浓度水平(ng·L-1)Table 2 Concentrations of PFASs in surface water samples (ng·L-1)
2.2 地表水中PFASs水平及其空间分布
如图3A所示,在15个湖水样品和4个江水样品中,L1~L5、L7~L9和L12湖水中PFASs以PFBA和PFOA为主,分别占总PFASs的31%~72%和2%~43%。L10、L11以及L13~L15湖水中PFASs以PFBA和PFBS为主,分别占总PFASs的25%~53%和31%~57%。而L6湖水中PFASs以PFOS为主,其次是PFBA和PFBS,分别占总PFASs的59%、12%和25%。在4个江水样品(R1~R4)中,PFASs以PFBS和PFHxS为主,其次是PFBA,分别占总PFASs的28%~36%、21%~24%和16%~19%。与武汉市污水处理厂污水中PFASs污染特征一致,武汉市湖水和江水中PFASs均以短链同系物为主。这一特征与以往报道的自然水体以PFOA和PFOS为主的PFASs污染特征明显不同[21, 27],进一步说明短链替代效应已在中国全氟工业中逐渐显现。
武汉市15个湖水样品中PFASs水平各不相同(表2)。其中,L13湖水中PFASs浓度水平最高,总PFASs浓度高达10 900 ng·L-1。其次是L11(总PFASs:534 ng·L-1)、L6(总PFASs:321 ng·L-1)、L14(总PFASs:211 ng·L-1)、L2(总PFASs:195 ng·L-1)。L8、L10和L15浓度水平相当,总PFASs浓度分别为104 ng·L-1、103 ng·L-1和101 ng·L-1。L7和L12湖水总PFASs浓度分别为64.5 ng·L-1和54.3 ng·L-1。L1、L3~L5和L9湖水样品中PFASs浓度水平较低,总PFASs浓度在22.5~39.2 ng·L-1范围内(图3B)。从15个湖水样品的空间分布区域可以看出,武汉三镇(汉口、汉阳和武昌)各湖泊水样中PFASs总体水平:汉口 < 汉阳 < 武昌。此结果与武汉三镇污水处理厂污水中PFASs空间分布一致,进一步说明城市工业布局与人口密度程度直接影响城市PFASs污染空间分布。值得注意的是,在L13湖水中检测到很高浓度的PFASs污染,而湖L13与污水处理厂W6相邻。前期研究已证实,L13湖水中高浓度的PFASs污染源于W6污水处理厂出水的排放和周边未经处理的工业废水的直接排放[22]。
除了L13湖,武汉市其他14个湖泊中PFOA浓度为2.00~23.1 ng·L-1(中位值:7.92 ng·L-1),PFOS浓度为0.29~188 ng·L-1(1.04 ng·L-1)。这些湖水中PFOA浓度与中国白洋淀地区水样中PFOA浓度水平相当[28],低于中国太湖水样中PFOA浓度[29]。然而,湖水中PFOS浓度比白洋淀和太湖水样中PFOS浓度高[28,30-31]。另外,武汉地区湖水中短链PFASs浓度较高,比如PFBA(6.98~199 ng·L-1)、PFPeA(0.59~10.8 ng·L-1)、PFHxA(2.78~29.8 ng·L-1)、PFHpA(0.98~5.94 ng·L-1)、PFBS(1.54~302 ng·L-1),以及PFHxS(0.02~13.9 ng·L-1),它们比白洋淀和太湖地区湖水中短链PFASs浓度高1~2个数量级[28, 30-31]。
武汉市4个江水样品中PFASs浓度水平相当,总PFASs浓度为4.11~4.77 ng·L-1,比武汉市湖水样品中PFASs浓度低1~2个数量级。其中,PFOA和PFOS浓度分别为0.33~0.50 ng·L-1和0.14~0.21 ng·L-1,低于Jin等[18]所报道的武汉地区长江水域中PFOA和PFOS浓度。从采样图(图1)可以看出,本研究采集的4个江水样品位于汉江上游和汉江与长江交汇处,处于汉口和汉阳中间,汉江受到武昌地区污水排放的污染可能性小,而Jin等采集的长江水样受到武昌地区污水排放的污染可能性大,因此Jin等报道的长江水域中PFASs浓度水平比本研究汉江水样中浓度高。
美国环境保护署(USEPA)饮用水标准和健康公告(2011版)将饮用水中PFOS和PFOA健康参考值分别设定为200和400 ng·L-1;英国健康保护局(HPA)建议饮用水中PFOS和PFOA最大可接受浓度分别为300和10 000 ng·L-1[32-33]。本研究所有江水样品中PFOS和PFOA浓度均远低于USEPA和HPA建议的参考值。除了位于武昌的L13湖水中PFOS浓度高于USEPA建议的参考值以外,所有湖水样品中PFOS和PFOA浓度均低于USEPA和HPA建议的参考值。虽然L13湖水并没有用于饮用水,但是湖水经水渠进入长江,是否会影响长江饮用水水源中PFOS污染水平,还需要更进一步的研究。另外,虽然目前国际上还没有关于短链PFASs的健康安全参考值,但是,武汉地区水环境中普遍存在短链PFASs污染,其水环境生态风险值得关注。
综上所述:本文研究了中国氟化工行业主要的生产基地之一——武汉地区的10个污水处理厂进、出口污水和19个地表水样品中PFASs污染特征。结果发现,武汉地区水环境中PFASs总体水平呈现汉口 < 汉阳 < 武昌的趋势,表明城市工业布局与人口密度程度直接影响城市PFASs污染空间分布。值得注意的是,与以往水环境中PFASs污染以PFOA和PFOS为主不同,武汉地区水环境中PFASs污染以短链同系物为主,表明短链替代效应已经渐渐在中国化工领域出现,中国全氟行业在响应国际组织规范和建议的基础上做出了实质性进展。然而,对于短链PFASs的污染特征、迁移运输以及生态风险等科学问题,还需要更进一步的研究。
[1] Organisation for Economic Co-operation and Development. Hazard assessment of perfluorooctane sulfonate (PFOS) and its salts. ENV/JM/RD(2002)17/FINAL [R]. Paris: Organisation for Economic Co-operation and Development, 2002
[2] Qiu Y. Study on treatment technologies for perfluorochemicals in wastewater [D]. Kyoto: Kyoto Publisher University, 2007
[3] Boulanger B, Vargo J, Schnoor J L, et al. Detection of perfluorooctane surfactants in Great Lakes water [J]. Environmental Science & Technology, 2004, 38(15): 4064-4070
[4] So M K, Taniyasu S, Yamashita N, et al. Perfluorinated compounds in coastal waters of Hong Kong, South China, and Korea [J]. Environmental Science & Technology, 2004, 38(15): 4056-4063
[5] Jahnke A, Ahrens L, Ebinghaus R, et al. Urban versus remote air concentrations of fluorotelomer alcohols and other polyfluorinated alkyl substances in Germany [J]. Environmental Science & Technology, 2006, 41(3): 745-752
[6] Kärrman A, Ericson I, van Bavel B, et al. Exposure of perfluorinated chemicals through lactation: Levels of matched human milk and serum and a temporal trend, 1996-2004, in Sweden [J]. Environmental Health Perspectives, 2006, 115(2): 226-230
[7] Benskin J P, Phillips V, St. Louis V L, et al. Source elucidation of perfluorinated carboxylic acids in remote alpine lake sediment cores [J]. Environmental Science & Technology, 2011, 45(17): 7188-7194
[8] United Nations Environment Programme. Listing of perfluorooctane sulfonic acid, its salts and perfluorooctane sulfonyl fluoride [R]. Geneva: United Nations Environment Programme, 2009
[9] Lim T C, Wang B, Huang J, et al. Emission Inventory for PFOS in China: Review of past methodologies and suggestions [J]. The Scientific World Journal, 2011, 11: 1963-1980
[10] Loganathan B G, Sajwan K S, Sinclair E, et al. Perfluoroalkyl sulfonates and perfluorocarboxylates in two wastewater treatment facilities in Kentucky and Georgia [J]. Water Research, 2007, 41(20): 4611-4620
[11] Bossi R, Strand J, Sortkjr O, et al. Perfluoroalkyl compounds in Danish wastewater treatment plants and aquatic environments [J]. Environment International, 2008, 34(4): 443-450
[12] Murakami M, Imamura E, Shinohara H, et al. Occurrence and sources of perfluorinated surfactants in rivers in Japan [J]. Environmental Science & Technology, 2008, 42(17): 6566-6572
[13] Yu J, Hu J Y, Tanaka S, et al. Perfluorooctane sulfonate (PFOS) and perfluorooctanoic acid (PFOA) in sewage treatment plants [J]. Water Research, 2009, 43(9): 2399-2408
[14] North K D. Tracking polybrominated diphenyl ether releases in a wastewater treatment plant effluent, Palo Alto, California [J]. Environmental Science & Technology, 2004, 38(17): 4484-4488
[15] Guo R, Sim W J, Lee E S, et al. Evaluation of the fate of perfluoroalkyl compounds in wastewater treatment plants [J]. Water Research, 2010, 44(11): 3476-3486
[16] Zhou Q, Deng S B, Zhang Q Y, et al. Sorption of perfluorooctane sulfonate and perfluorooctanoate on activated sludge [J]. Chemosphere, 2010, 81(4): 453-458
[17] Wang Y, Fu J, Wang T, et al. Distribution of perfluorooctane sulfonate and other perfluorochemicals in the ambient environment around a manufacturing facility in China [J]. Environmental Science & Technology, 2010, 44(21): 8062-8067
[18] Jin Y, Ding M, Zhai C, et al. An investigation of the PFOS and PFOA pollution in Three Gorges Reservoir areas of the Yangtze River and surface water of Wuhan areas [J]. Ecology and Environment, 2006, 15(3): 486-489
[19] Pan Y, Shi Y, Wang J, et al. Evaluation of perfluorinated compounds in seven wastewater treatment plants in Beijing urban areas [J]. Science China Chemistry, 2011, 54(3): 552-558
[20] Ritter S K. Fluorochemicals go short [J]. Chemical & Engineering News, 2010, 88(5): 12-17
[21] Arvaniti O S, Ventouri E I, Stasinakis A S, et al. Occurrence of different classes of perfluorinated compounds in Greek wastewater treatment plants and determination of their solid-water distribution coefficients [J]. Journal of Hazardous Materials, 2012, 239-240: 24-31
[22] Zhou Z, Liang Y, Shi Y, et al. Occurrence and transport of perfluoroalkyl acids (PFAAs), including short-chain PFAAs in Tangxun Lake, China [J]. Environmental Science & Technology, 2013, 47(16): 9249-9257
[23] Kannan K, Tao L, Sinclair E, et al. Perfluorinated compounds in aquatic organisms at various trophic levels in a Great Lakes food chain [J]. Archives of Environmental Contamination and Toxicology, 2005, 48(4): 559-566
[24] Sinclair E, Kannan K. Mass loading and fate of perfluoroalkyl surfactants in wastewater treatment plants [J]. Environmental Science & Technology, 2006, 40(5): 1408-1414
[25] Hoff P T, Van de Vijver K, Van Dongen W, et al. Perfluorooctane sulfonic acid in bib (Trisopterus luscus) and plaice (Pleuronectes platessa) from the Western Scheldt and the Belgian North Sea: Distribution and biochemical effects [J]. Environmental Toxicology and Chemistry, 2003, 22(3): 608-614
[26] Nakayama S, Strynar M J, Helfant L, et al. Perfluorinated compounds in the Cape Fear Drainage basin in North Carolina [J]. Environmental Science & Technology, 2007, 41(15): 5271-5276
[27] Kwadijk C J A F, Korytar P, Koelmans A A. Distribution of perfluorinated compounds in aquatic systems in The Netherlands [J]. Environmental Science & Technology, 2010, 44(10): 3746-3751
[28] Zhou Z, Shi Y, Li W, et al. Perfluorinated compounds in surface water and organisms from Baiyangdian Lake in North China: Source profiles, bioaccumulation and potential risk [J]. Bulletin of Environmental Contamination and Toxicology, 2012, 89(3): 519-524
[29] Yu N, Shi W, Zhang B, et al. Occurrence of perfluoroalkyl acids including perfluorooctane sulfonate isomers in Huai River Basin and Taihu Lake in Jiangsu Province, China [J]. Environmental Science & Technology, 2013, 47(2): 710-717
[30] Yang L, Zhu L, Liu Z. Occurrence and partition of perfluorinated compounds in water and sediment from Liao River and Taihu Lake, China [J]. Chemosphere, 2011, 83(6): 806-814
[31] Qiu Y, Jing H, Shi H. Perfluorocarboxylic acids (PFCAs) and perfluoroalkyl sulfonates (PFASs) in surface and tap water around Lake Taihu in China [J]. Frontiers of Environmental Science & Engineering in China, 2010, 4(3): 301-310
[32] U.S. Environmental Protection Agency. Edition of the Drinking Water Standards and Health Advisories, EPA 820-R-11-0022011 [R]. Washington DC: U.S. Environmental Protection Agency, 2011
[33] Health Protection Agency. Maximum acceptable concentrations of perfluorooctane sulfonate (PFOS) and perfluorooctanoic acid (PFOA) in drinking water [R]. England: Health Protection Agency, 2007
◆
OccurrenceandDistributionofPer-andPolufluoroalkylSubstancesinWasteWaterandSurfaceWaterSamplesinWuhan
Zhou Zhen1, Hu Yuning1, Shi Yali2, Cai Yaqi2, Liang Yong1,3,*
1. Key Laboratory of Optoelectronic Chemical Materials and Devices, Ministry of Education, School of Chemical and Environmental Engineering, Jianghan University, Wuhan 430056, China2. State Key Laboratory of Environmental Chemistry and Ecotoxicology, Research Center for Eco-Environmental Science, Chinese Academy of Sciences, Beijing 100085, China3. Institute of Environment and Health, Jianghan University, Wuhan 430056, China
10.7524/AJE.1673-5897.20170115004
2017-01-15录用日期2017-03-08
1673-5897(2017)3-425-09
X171.5
A
梁勇(1976—),男,环境科学博士,教授,主要研究方向为环境毒理学。
国家自然科学基金(21477049);国家自然科学基金(21507044);环境化学与生态毒理学国家重点实验室开放基金(KF2014-21)
周珍(1986-),女,讲师,研究方向为环境化学,E-mail: zhouzhen86@163.com;
*通讯作者(Corresponding author), E-mail: ly76@263.net
周珍, 胡宇宁, 史亚利, 等. 武汉地区水环境中全氟化合物污染水平及其分布特征[J]. 生态毒理学报,2017, 12(3): 425-433
Zhou Z, Hu Y N, Shi Y L, et al. Occurrence and distribution of per- and polufluoroalkyl substances in waste water and surface water samples in Wuhan [J]. Asian Journal of Ecotoxicology, 2017, 12(3): 425-433 (in Chinese)
