Fatigue Crack Growth Calculation of a Surface Crack in a Ship Angular Joint
2017-10-11KONGXiaobingHUANGXiaopingZHAOPengyuanZHANGDaokun
KONG Xiao-bing,HUANG Xiao-ping,ZHAO Peng-yuan,ZHANG Dao-kun
(1.Collaborative Innovation Center for Advanced Ship and Deep Sea Exploration,Shanghai Jiao Tong University,Shanghai 200240,China;2.Technology Development&Research Center,China Classification Society,Beijing 100007,China)
Fatigue Crack Growth Calculation of a Surface Crack in a Ship Angular Joint
KONG Xiao-bing1,HUANG Xiao-ping1,ZHAO Peng-yuan1,ZHANG Dao-kun2
(1.Collaborative Innovation Center for Advanced Ship and Deep Sea Exploration,Shanghai Jiao Tong University,Shanghai 200240,China;2.Technology Development&Research Center,China Classification Society,Beijing 100007,China)
Abstract:An angular joint in a container is taken as the research object.Hydrodynamic response and structural hot spot stress response of a container were forecasted by using the finite element software WALCS and PATRAN respectively.In order to avoid using 3D solid element in the hot spot area in PATRAN finite element model for calculating the stress intensity factor(SIF)of a surface crack,a SIF calculation method for surface cracks in ship structures under wave loads was proposed.The accuracy of the proposed method was validated by comparing the calculated results with those of widely accepted empirical formulas.Then,the method was applied to an angular joint in the bottom at the midship.SIFs of surface cracks with different sizes in the joint under the wave induced pressure were calculated and dimensionless empirical formulas were summarized.The fatigue load spectrums were generated by using a method based on spectrum analysis.Fatigue crack growth was calculated by using the unique crack growth rate curve model.Calculation results showed that the discussed hot spot did not meet the requirement of design life and further modification will be needed.
Key words:wave load;angular type joint;surface crack;stress intensity factor;unique curve model
0 Introduction
Ships and marine structures suffer nearly one hundred million cycles random wave load during their service life.Crack defects,mostly in the form of surface cracks can be traced in the welded toes of key load carrying structures,which is the inevitable result of the structural fatigue damage[1-3].Large-scalization of ships and the wide use of the higher tensile steels in ship hulls make the fatigue problem imminent[4].It is of great significance to conduct fatigue crack propagation analysis on ships and marine structures which containing cracks to ensure the personal safety and property safety.
Stress intensity factor(SIF)is one of the important parameters in evaluating the crackedcomponent failure.To calculate the SIFs of surface cracks in details under real loading conditions is the basis of forecasting the structural fatigue life accurately.At present,cracks in ship structure details are commonly assumed as semi-elliptical surface cracks.Newman-Raju’s formulas for calculating SIFs of surface cracks in a plate under the tensile and bending loads have been widely recognized[5].On the basis of the formula,Bowness[6]put forward formulas for calculating the toe magnification factors for cracks in the weld toe of T-butt joints and they were adopted by BS7910[7].However,the above formulas for calculating the SIFs are only suitable for relatively simple structures under the simple load conditions.It is clearly not appropriate to apply them to joints in the real ships and marine structures.This is because the actual structures are under wave loads and the stress distribution in most typical fatigue assessment details are very complicated.
Aiming to solve this problem,Yan et al[8]has proposed a SIF calculation method for cracks in ship structures under wave loads.In that method,the hots pot areas are required to be modeled using 3D solid element in PATRAN,and then a macro-program patran2ansys.mac has been written to achieve the transformation boundary conditions from PATRAN whole model to the ANSYS submodel containing surface cracks.But it is extremely complex to model 3D solid element in the huge PATRAN ship model especially in the multiple plates intersecting joint area.Because of this shortcomings of the above method,this paper proposed a new method need not to model 3D solid element in PATRAN,and its calculation accuracy was validated by comparing the calculated results with those of widely accepted empirical formulas.
In this paper,the ship hydrodynamic response and hot spot stress response were performed by using the finite element software WALCS and PATRAN respectively.Then the above SIF calculation method was applied to calculate SIFs of surfaces cracks in an angular joint in the middle bottom at the midship.SIFs of surface cracks with different sizes in the joint under the wave induced loads were calculated and dimensionless empirical formulas were summarized.The fatigue load spectrums were generated by using a method based on spectrum analysis.Combined with the unique curve model,the fatigue crack propagation of a surface crack in the detail was calculated.
1 Hot spot stress response analysis
1.1 Hydrodynamic response
Ships and marine structures serve in ocean environment,and the main external load is wave load.The precision of the estimated structural response is depending on the precision of the calculated wave loads.Hydrodynamic software WALCS[9]can forecast the wave load of the ship and marine structures,which is based on three dimensional frequency domain linear hydrodynamics principle.It calculates three-dimensional hydrodynamic coefficient of radiation by combining the surface element method and the source distribution method.The wet surface model of the target ship in WALCS is shown in Fig.1 and the hydrodynamic analysis parame-ters are shown in Tab.1.

Tab.1 Hydrodynamic analysis parameters

Fig.1 Wet surface model of a ship
1.2 Hot spot stress response
The finite element model of the whole ship is modeled in PATRAN,including the whole hull structure,cargo tank and ship bow,etc.On the basis of the whole ship structure model,the lightweight and deadweight are automatically adjusted to the corresponding node of the structure model,making sure that the quality model is corresponding with the actual weight location in actual ship.The calculated wave pressures are transferred to the surface of the hull structure model,and the inertial release technology is used to make the hull structure in a state of dynamic balance.

Fig.2 Hot spot stress interpolation calculation
Angular joints widely exist in ship structures and are prone to fatigue failure,which are the key spots for fatigue assessments.In guidelines for fatigue strength of ship structure of CCS[10],hot spot stress method was adopted to assess the fatigue strength,which has clearly stated the requirement for the element size and determinnation of the hot spot stress.Because the shape of the weld toe is not considered in the finite element model,extrapolation method is used to get the stress of the weld toe.The common practice is to use stress at the locations away from the weld toe t/2 and 3t/2 for linear interpolation,as shown in Fig.2.The hot spot stress at the weld toe can be extrapolated using the following formula:

where σhis hot spot stress, σt/2and σ3t/2are element stresses at a distance t/2 and 3t/2.
The refine meshed model of an angular joint in the midship bottom is shown in Fig.3,thetransfer function of hot spot stress of the joint is shown in Fig.4.

Fig.3 Bottom tank angle refine finite element model

Fig.4 Transfer function of bottom tank angular
2 Stress intensity factor calculation method validation
2.1 Shell-to-solid submodel technology
Ship structure strength analysis is generally conducted based on finite element model using the software PATRAN which is widely used in ship building industry.Shell element,beam element and bar element are always used,but 3D solid element is always avoided to be used.Three-dimensional surface cracks in the structure need to be modeled using 3D solid element and the singular element is needed in the crack tip area where the peak stress exists.There is no singular element in PATRAN,but it is provided in ANSYS.The need of different types element makes the problem difficult,because the node of shell element has three translational degrees and three rotational degrees,but the node of the 3D solid element has three translational degrees only.

Fig.5 3D solid submodel superimposed on coarse shell model

Fig.6 Node rotation(a)before cbdof command(b)after cbdof command
A special submodel technology called shell-to-soild submodel is provided in ANSYS,which can transfer the loads from shell element to the solid element seamlessly.It means the coarse model is shell and the submodel is solid model.A 3D solid submodel superimposed on coarse shell model is shown in Fig.5.In a structural analysis,only the translational displace-ments are calculated for the nodes on the cut-boundary,but their values are based on the translations and rotations of the projected point.Also,the node is rotated such that the nodal UY direction is always perpendicular to shell plane,as shown in Fig.6.A UY constraint is calculated only for nodes that within 10 percent of the average shell element thickness from the shell plane,preventing over_constraint of the submodel in the transverse direction.
Therefore,we can first transfer the calculated results(translation and rotation degree)into the shell model of ANSYS,then the shell-to-solid submodel technology is used to transfer the calculated results from shell elment to solid model containing semi-elliptical surface crack in ANSYS.
2.2 Validaton with plate surface crack
In order to prove the accuracy of the proposed method above,SIFs of semi-elliptical surface crack with different size in a plate are calculated,and the results are compared with those of Newman-Raju formulas which are widely accepted.
A flat plate measures 5 m×2 m×20 mm and there exists a semi-elliptical surface crack in the middle section of the plate.It is subjected to uniformly distributed tensile stress 90(MPa)and bending stress 7(MPa)respectively.The coarse model of the plate modeled in PATRAN is shown in Fig.7.The elements in the crack location areas are refined and the refined plate model is shown in Fig.8.

Fig.7 Coarse model of the plate(PATRAN)

Fig.8 Refined plate model(PATRAN)
Then,a shell model measuring 500 mm×400 mm×20 mm is modeled using four node element in ANSYS.A 3D solid plate model measuring 400 mm×200 mm×20 mm containing a semi-elliptical surface crack is modeled using element solid 95.The 3D solid model superimposed on coarse shell model in ANSYS is shown in Fig.9 and the crack tip element can also be seen.The boundary of the shell model is loaded using the information from PATRAN by the improved macroprogram patran2ansys.mac which can consider both the translation and rotation degree.Shell-to-solid submodel technology can transform the calculated results from shell model to solid model.
SIFs of surface cracks with different sizes in the middle section of a plate are calculated and compared with those of the widely accepted Newman-Raju formulas which are shown in Figs.10-13.From the figures above,we can find that the calculated results by the above method are in good agreement with those of the empirical formulas under both tensile stress and bending stress.
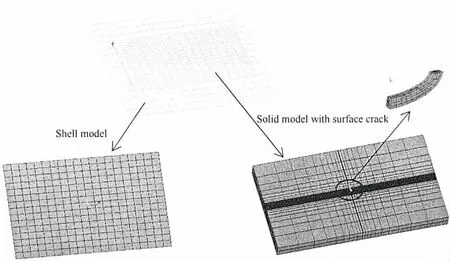
Fig.9 3-D solid submodel superimposed on coarse shell model in ANSYS

Fig.10 Comparison of crack surface under tensile

Fig.11 Comparison of crack surface under tensile

Fig.12 Comparison of crack surface under bending
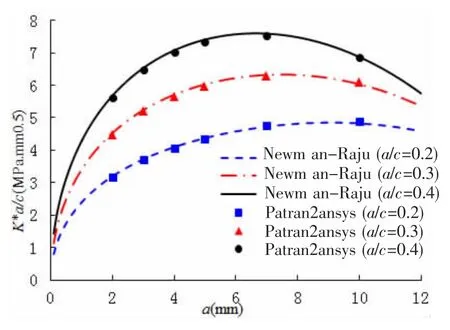
Fig.13 Comparison of crack deepest point under bending
3 Fatigue load generation based on spectral analysis
3.1 Equivalent stress intensity factor
When calculating the hot spot stress response amplitude of the structure,the method of‘real part and imaginary part’ is always used in the project.The stress response △σrealandcorresponding to 0°and 90°phase angle respectively are calculated and the equivalent stress response can be obtained by using the following formula:

where△σrealis the dynamic stress response value caused by unit-height wave at the phase angle 0°,△σimageis the dynamic stress response value caused by unit-height wave at the phase angle 90°.
Depending on the load types,a crack can be extended into three different modes in Fig.14.They are listed as follows:ModeⅠis the opening(tensile)mode where the crack surfaces move directly apart;ModeⅡis the sliding(in-plane shearing)mode where the crack surfaces slide over one another in the direction perpendicular to the leading edge of the crack;ModeⅢis the tearing(anti-plane shear)mode where the crack surfaces move relative to another and parallel to the leading edge of the crack.
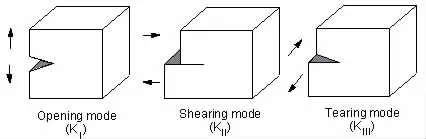
Fig.14 Three basic modes of farcture
It is dangerous to considerⅠcrack only,so equivalent SIF is used here.The specific formula is as follows:

where KⅠ,real,KⅠimage,KⅡ,real,KⅡimage,KⅢ,realand KⅢ,imagerespectively represent real part and image part SIF of the three types crack under wave pressure;μ is the material elastic modulus.
3.2 Norminal stress
It is well known that nominal stress is widely used in fracture mechanics,but methods on how to get it from finite element model are still not clearly defined.But there are specific rules and guidelines of the classification society on getting the hot spot stress,so stress concentration coefficient is used to determine norminal stress in this paper.The formula is shown as follows:

where σnrepresents norminal stress,σhrepresents hot spot stress,kgrepresents stress concentration factor(stress concentration factor of the bottom angular joint is shown in Tab.2)

Tab.2 Stress concentration factor of the bottom angular joint
3.3 SIFs calculation of cracks in ship middle angular joints
In ANSYS,the finite element of an angular joint in the bottom at the midship is modeled,as shown in Fig.15.The boundary of the shell model is loaded using the information getting from PATRAN with the improved macro-program patran2ansys.mac.Shell-to-solid submodel is used to transfer the result from shell model to solid model containing a semi-ellitical surface crack in ANSYS.

Fig.15 3D solid submodel with crack superimposed on coarse shell model in ANSYS
SIFs of a surface crack with different size(a/c=0.2,0.4,0.6,0.8)at the weld toe of an angular joint in the bottom at the midship are calculated.The SIFs of the surface point of crack are as shown in Fig.16,and the SIFs of the deepest point of crack as shown in Fig.17(wave direction 0,wave frequency 0.5).
3.4 Empirical formulas of ship middle angular joints
The crack tip stress intensity factor generally can be represented as:

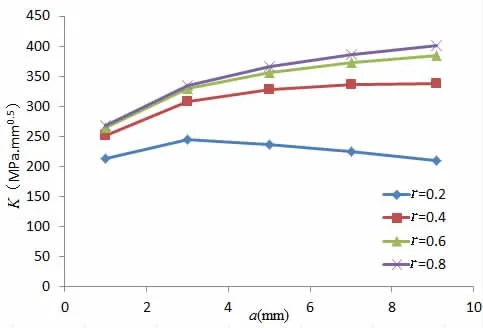
Fig.16 Stress intensity factor of crack surface point

Fig.17 Stress intensity factor of crack deepest point
where σnrepresents norminal stress,a represents crack depth,is a dimensionless parameter in terms of the crack geometry and type of load.
SIFs of surface cracks with different sizes in the weld toe of an angular joint are calculated in different wave direction and wave frequencies.The hot spot stress of the angular joint is calculated according to the guidelines of the classification society above.The dimesionless parameter can be backstepped by using the follow formula:

Dimensionless parameters of the surface point of the crack are shown in Fig.18 and the dimensionless parameters of the deepest point surface are shown in Fig.19.

Fig.19 of the crack deepest point
Through the above calculation,the empirical formulas for calculating SIFs of surface cracks with different sizes in an angular joint at the bottom in the midship are summarized as follows using MATLAB:

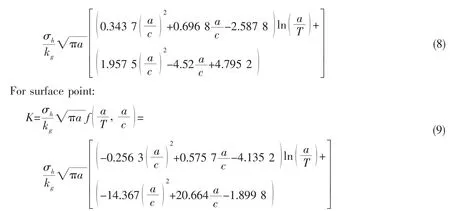
where σhis the hot spot stress amplitude,a is crack depth,c is crack length,T is the thickness of the inner bottom,kgis the stress concentration factor(stress concentration factor of the bottom angular joint is shown in Tab.2).
4 Fatigue life prediction of a bottom tank angle
4.1 Crack propagation model
The crack propagation rate is the core content of fatigue crack propagation analysis,many achievements have been made in this aspect.The Paris law[11]is widely studied and used in linear elastic fracture mechanics.Then,the modified formula of the fatigue crack was proposed by Forman[12],so as to consider the effect of mean stress.The above two formulas are widely used in engineering due to its simplicity.
Many subsequent studies found residual stress,stress ratio and load sequence also had influence on the fatigue crack propagation rate.As a result,modified formulas and new ones were proposed.Described so far,the formulas of crack propagation rate are not less than one hundred,and a suitable model is needed which has calculating accuracy and can be easily applied to engineering practice.The unique crack growth rate curve method,which is based on the equivalent stress intensity factor range as the driving force under constant amplitude external loading,has been proposed by Huang[13-14].The model has many advantages.On one hand,it can consider the effect of R-ratio including residual stress and loading sequence,on the other hand,it can use constants C and m in Paris law which has been frequently tested for different material.Its basic expression is:

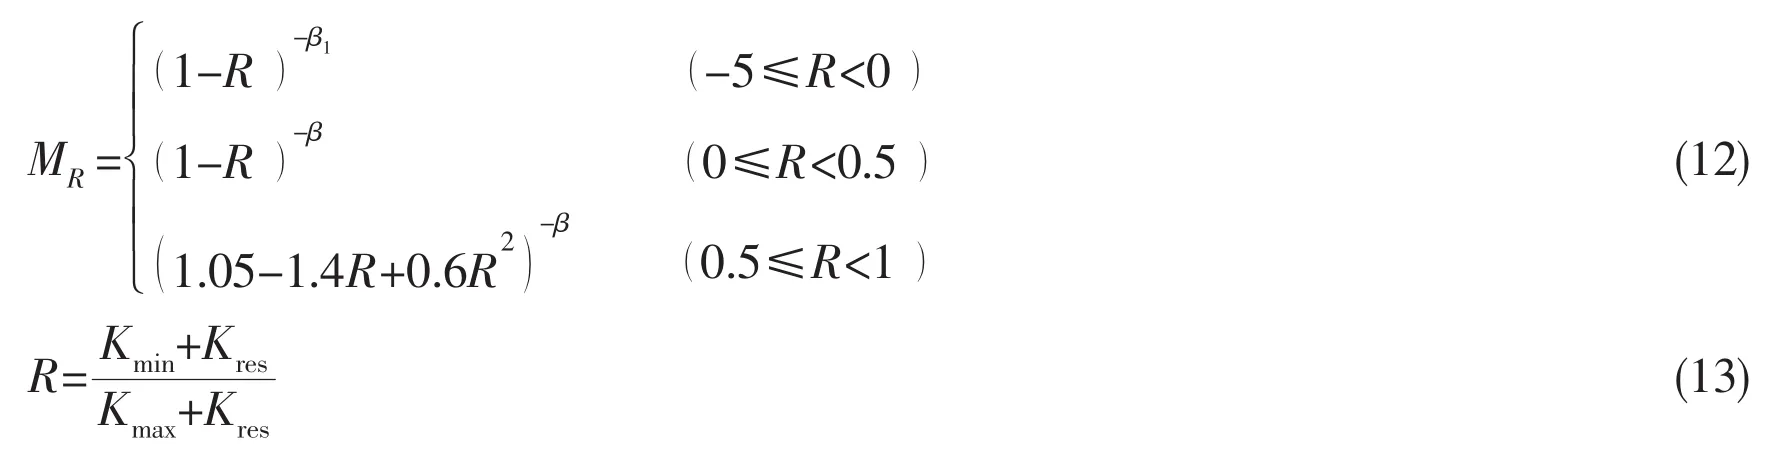
where a is the crack length;N is the number of applied cycles;C,m are the Paris parameters;△Keq0,△Kth0,respectively are the equivalent SIF range and threshold of SIF range corresponding to the stress ratio R=0;MRis the correction factor for stress ratio; β and β1depend on the material and the environment.Kresis the SIF caused by residual stress;MPis the correction factor for load sequence and can be calculated by:
where△Kuis the SIF range caused by underload follows an overload cycle;are the minimum SIF ranges of the current cycle and the prior cycle;aOLis the crack size when overload occurs;ryis the size of plastic zone at crack tip;rOLis the size of plastic zone at crack tip when overload occurs;r△is the increment of plastic zone size at crack tip caused by underload towards an overload;α is the plastic zone size factor;n is shaping exponent of plastic zone effect.
4.2 Generation of the fatigue load spectrum
To predict the fatigue life of structure accurately,fatigue load spectrums need to be as real as possible.The alternating stresses in ship and marine structures are wave-induced stresses.Huang[15]proposed a method for generating fatigue load spectrums based on spectrum analysis.The method is based on the real sea condition and loading condition,and it can consider the combination of different wave direction and frequency,having higher accuracy.It is used to generate fatigue load spectrums in this paper.
Double parameters P-M wave spectrum recommended by ISSC is used,the P-M spectrum expression is as follows:

where Hsis the wave height and Tzis the average cross zero cycle.
Spectral analysis method is based on the theory of linear system.The wave uses stationary Gaussian random process,and the alternating stress of the structure is also a stationary Gaussian random process.So the alternating stress of the structure can be expressed as:

In the evaluation of the ship response due to external wave-induced pressures,the effect of wave diffraction and radiation is taken into consideration.
The long-term state of ocean waves is composed of many short-term sequence sea conditions.Every sea condition is characterized by wave characteristic parameters and the frequency of sea conditions.In practical applications,alternating stress process is considered as a narrow band stationary stochastic process in a certain sea state and wave direction.According to the theory of stochastic process,the peak stress obeys Rayleigh distribution,and the probability density function is

The transfer function of the angular joint in the middle bottom of the ship is shown in Fig.4.Global wave scatter diagram is used.The probability density of the fatigue load spectrums is shown in Fig.20 and a random load sequence diagram(fragment)is shown in Fig.21.

Fig.20 Probability density of the fatigue load spectrum

Fig.21 Random load sequence diagram(fragment)
4.3 The fatigue life prediction
In crack growth prediction,the unique curve model was applied and the Paris constants in this model were referred to the recommendation of International Institude of Welding(IIW)[16],namelyWeld radius is 10 mm and weld angle is 45°.
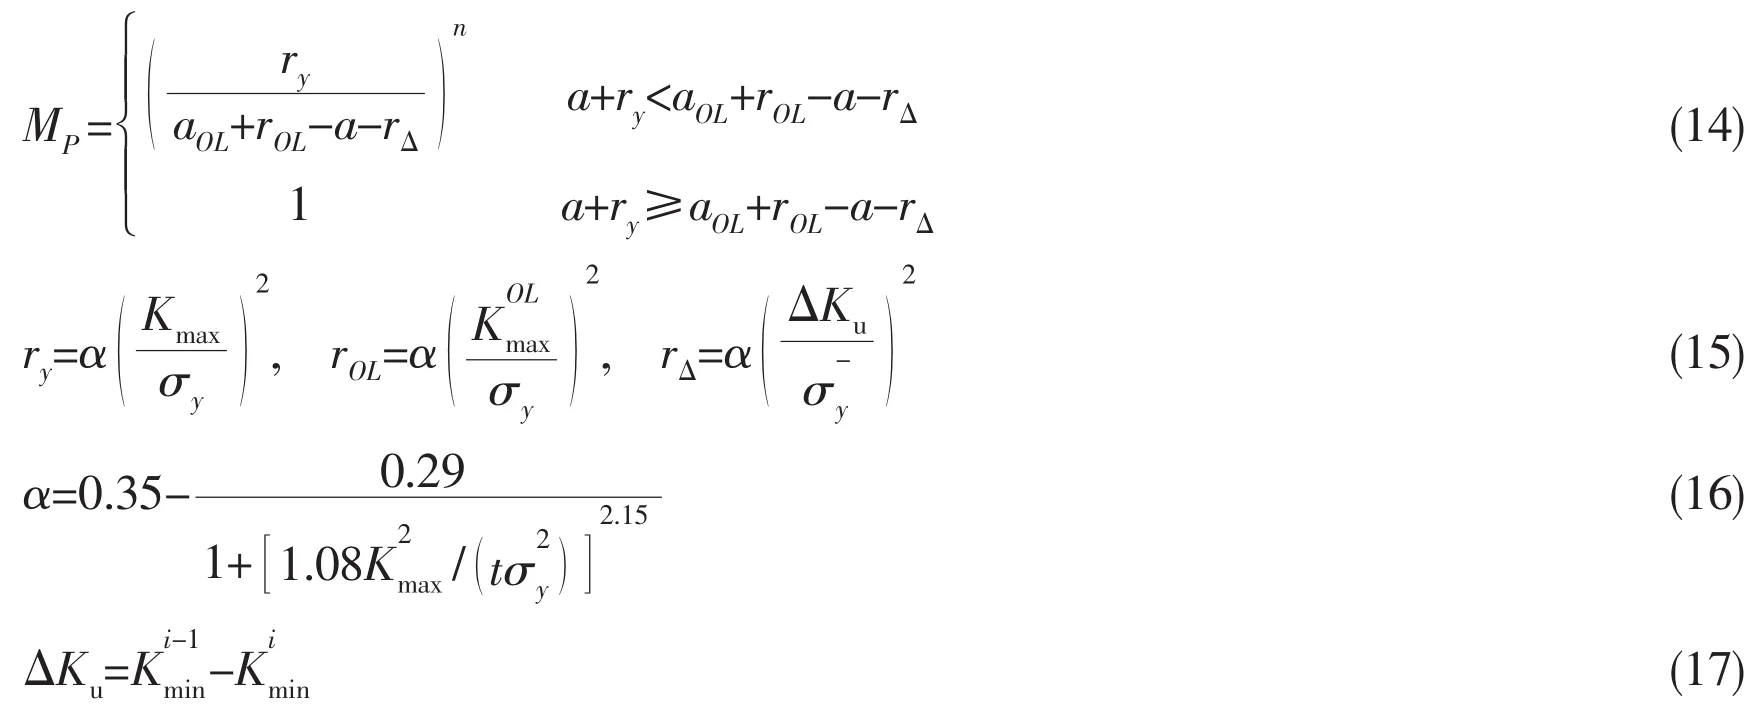
The initial depth of the surface crack was 0.2 mm,and the initial length was 2 mm.The structure was failure when the surface crack penetrates the thickness of the target plate.SIFs of a surface crack with different sizes of a angular joint in the bottom at the midship were calculated by the empirical formulas summarized above and the fatigue spectrums were generated by the method mentioned above.Fatigue crack growth calculation was conducted usingcycle-by-cycle method using MATLAB program and the calculated crack growth curves are shown in Fig.22.We can know the fatigue life of the joint is only 7 years.
Fig.22 Crack growth curve
5 Conclusions
The paper focused on the fatigue strength assessment of ship angular joint which widely exists in ship structures based on the finite element numerical analysis.The main conclusions are as follows:
(1)A SIF calculation method for surface cracks in ship structures under wave loads has been proposed which avoids using 3D element in the hot spot area in PATRAN finite element model for calculating the SIFs of a surface crack with different sizes.
(2)Dimensionless Empirical formulas for calculating SIFs of surface cracks in angular joint in the midship bottom of a container under wave-induced pressure are proposed.
(3)The results of fatigue life prediction for angular joint in the midship bottom based on crack propagation showed that the fatigue strength did not meet the design requirement.To modify the structure size of the details is needed.
Acknowledgements
This work was financially supported by the National Science Foundation of China(Grant No.51279102)and project‘Study on the fatigue strength of Thick High Tensile Steel plate’financially supported by China Classification Society.The support is gratefully acknowledged.
[1]Huang X,Jia G,Cui W,et al.Unique crack growth rate curve model for fatigue life prediction of marine steel structure[J].Journal of Ship Mechanics,2011,15(1):118-125.(in Chinese)
[2]Fricke W,Lilienfeld-Toal A V,Paetzold H.Fatigue strength investigations of welded details of stiffened plate structures in steel ships[J].International Journal of Fatigue,2012,34(1):17-26.
[3]Fricke W,Paetzold H.Full-scale fatigue tests of ship structures to validate the S-N approaches for fatigue strength assessment[J].Marine Structures,2010,23(1):115-130.
[4]Mao W,Li Z,Ogeman V,et al.A regression and beam theory based approach for fatigue assessment of containership structures including bending and torsion contributions[J].Marine Structures,2015,41(1):244-266.
[5]Newman J C,Raju I S.Analysis of surface cracks in a finite plate under tension or bending loads[R].NASA TP-1579,1979.
[6]Bowness D,Lee M M K.Prediction of weld toe magnification factors for semi-elliptical cracks in T-butt joints[J].International Journal of Fatigue,2000,22(5):369-387.
[7]BS7910.Guide to methods for assessing the acceptability of flaws in metallic structures[M].British Standards Institution,2005.
[8]Yan X,Huang X,Cui W.Prediction of fatigue crack growth in a ship detail under wave-induced loading[J].Ocean Engineering,2016,113:246-254.
[9]Tang S,Zhang H,Wu J,et al.Empirical formula for short-term forecast of bulk carriers and oil tanks’vertical wave loads[J].Ocean Engineering,2014,32(3):65-71.(in Chinese)
[10]CCS.Guidelines for fatigue strength assessment of offshore engineering structures[M].China Classification Society,2014.
[11]Paris P C,Gomez M,Anderson W.A rational analytic theory of fatigue[J].Trend Engng,1961,13:9-14.
[12]Forman R G,Kearney V E,Engle R M.Numerical analysis of crack propagation in cyclic-loaded structure[J].Sen-ito Kogyo,1993,49(3):459-464.
[13]Huang X,Torgeir M.Improved modeling of the effect of R-ratio on crack growth rate[J].International Journal of Fatigue,2007,29(4):591-602.
[14]Huang X,Moan T,Cui W.An engineering model of fatigue crack growth under variable amplitude loading[J].International Journal of Fatigue,2008,30(1):2-10.
[15]Yan X,Huang X,Cui W.An engineering method to predict fatigue crack propagation life for marine structures[J].Journal of Ship Mechanics,2016,20(3):323-334.
[16]IIW.Recommendations for fatigue design of welded joints and components[M].International Institute of Welding,2004.
船舶折角型节点的疲劳裂纹扩展计算
孔小兵1,黄小平1,赵鹏远1,张道坤2
(1.上海交通大学 高新船舶与深海开发装备协同创新中心,上海 200240;2.中国船级社研发中心,北京 100007)
文章以船舶折角型节点为研究对象,运用有限元软件WALCS和PATRAN分别预报某船的水动力响应和结构热点应力响应。为避免计算表面裂纹应力强度因子时需要在PATRAN有限元模型中疲劳热点区域采用体单元建模,文中提出了一种计算波浪载荷下船海结构物三维表面裂纹应力强度因子而无需在PATRAN中建立体模型的方法,并通过与广泛认可的经验公式对比验证其精度。将此方法应用于该船船舯底边舱折角处表面裂纹应力强度因子计算,计算并总结出波浪载荷下该类节点处表面裂纹应力强度因子的无量纲计算经验公式。应用一种基于谱分析构建结构疲劳载荷谱的方法,结合单一曲线模型对该节点进行裂纹扩展计算。计算结果表明:该船船舯底边舱折角疲劳寿命不满足设计要求,建议对节点进行改进。
波浪载荷;折角型节点;表面裂纹;应力强度因子;单一曲线模型
U661.4
A
国家自然科学基金资助项目(51279102)和中国船级社高强度钢超厚板疲劳强度研究项目
孔小兵(1991-),男,上海交通大学硕士研究生;黄小平(1963-),男,通讯作者,上海交通大学副教授,E-mail:xphuang@sjtu.edu.cn;赵鹏远(1992-),男,上海交通大学硕士研究生;张道坤(1978-),男,工程师。
10.3969/j.issn.1007-7294.2017.09.006
Article ID: 1007-7294(2017)09-1114-14
Received date:2017-05-19
Foundation item:Supported by National Natural Science Foundation of China(Project No.51279102)
Biography:KONG Xiao-bing(1991-),male,master student of Shanghai Jiao Tong University;HUANG Xiao-ping(1963-),male,Ph.D.,associate professor of Shanghai Jiao Tong University,corresponding author,E-mail:xphuang@sjtu.edu.cn;ZHAO Peng-yuan(1992-),male,master student of Shanghai Jiao Tong University.
猜你喜欢
杂志排行
船舶力学的其它文章
- Study on the Influence of Bulkhead Arrangement Form on the Structural Acoustic Characteristics of Cylindrical Shell
- Structural Design Exploration on Double Intersecting Spheres Manned Pressure Hull of Full Ocean Depth
- Research on Whipping and Springing Responses of Hull based on Different Experimental Method and Nonlinear Hydroelastic Time-domain Theory
- Real-Time Safety Estimation Method and Experimental Validation for Deep Sea Pressure Structural Health Monitoring
- Theoretical and Experimental Study on CTOD for Notch Plate Under Low Cycle Fatigue
- Using a Simple Method for Singularity Avoidance in Thrust Allocation for Marine Vessels