Identi fication of Superoxide O2−during Thermal Decomposition of Molten KNO3-NaNO2-NaNO3Salt by Electron Paramagnetic Resonance and UV-Vis Absorption Spectroscopy
2017-09-03ShutingLiuTaoSuPengZhangZejieFeiHongtaoLiu
Shu-ting Liu,Tao Su,Peng Zhang,Ze-jie Fei,Hong-tao Liu
Department of Molten Salt Chemistry and Engineering,Shanghai Institute of Applied Physics,Chinese Academy of Sciences,Shanghai 201800,China
Identi fication of Superoxide O2−during Thermal Decomposition of Molten KNO3-NaNO2-NaNO3Salt by Electron Paramagnetic Resonance and UV-Vis Absorption Spectroscopy
Shu-ting Liu,Tao Su∗,Peng Zhang,Ze-jie Fei,Hong-tao Liu*
Department of Molten Salt Chemistry and Engineering,Shanghai Institute of Applied Physics,Chinese Academy of Sciences,Shanghai 201800,China
On account of excellent thermal physical properties,molten nitrates/nitrites salt has been widely employed in heat transfer and thermal storage industry,especially in concentrated solar power system.The thermal stability study of molten nitrate/nitrite salt is of great importance for this system,and the decomposition mechanism is the most complicated part of it.The oxide species O22−and O2−were considered as intermediates in molten KNO3-NaNO3while hard to been detected in high temperature molten salt due to their trace concentration and low stability.In this work,the homemade in situ high temperature UVVis instrument and a commercial electron paramagnetic resonance were utilized to supply evidence for the formation of superoxide during a slow decomposition process of heat transfer salt(HTS,53 wt%KNO3/40 wt%NaNO2/7 wt%NaNO3).It is found that the superoxide is more easily generated from molten NaNO2compared to NaNO3,and it has an absorption band at 420−440 nm in HTS which red shifts as temperature increases.The band is assigned to charge-transfer transition in NaO2or KO2,responsible for the yellow color of the molten nitrate/nitrite salt.Furthermore,the UV absorption bands of molten NaNO2and NaNO3are also obtained and compared with that of HTS.
Superoxide,Decomposition of heat transfer salt,High temperature UV-visible, Electron paramagnetic resonance
I.INTRODUCTION
Concentrated solar power(CSP)uses molten salt as thermal energy storage(TES)and heat transfer fluid (HTF)medium,which have high energy density and high stability compared to photovoltaic or wind powers.CSP is gaining increasing interest and has become one of the most promising new energy technologies[1, 2].Molten nitrates/nitrites salt has been widely used for HTF and TES on account of their high working temperatures,good fluidity and heat storage capacity, relatively low vapor pressure and corrosion,and other good thermal physical properties[3−6].Two important nitrates/nitrites based molten salt mixtures have been employed in CSP plants:solar salt,an eutectic binary salt of 60 wt%NaNO3-40 wt%KNO3,melted at 221◦C and kept liquid at 288◦C in an insulated storage tank;and HTS(heat transfer salt or Hitec),an eutectic ternary salt of 40 wt%NaNO2/7 wt%NaNO3/53 wt% KNO3,operating beyond its melting point of 142◦C [7−9].Although solar salt and HTS have many merits,the thermal stability at the long term plays an important role in the running period of CSP system[10]. Generally,thermal stability involves the decomposition of every single component,and the mechanism is very complicated.
This is a consensus that HTS is much more unstable than solar salt at high temperature because of the low thermal decomposition temperature of sodium nitrite.Solar salt is commonly believed to be stable under 600◦C.While for Hitec/HTS,Alexander and Hindin [11]found it should be stable under 450◦C.Kearney et al.[5]showed that its thermal stability temperature could be up to 535◦C.While Peng and coworkers [12]suggested that the upper operating temperature of HTS was about 500◦C under air atmosphere.Olivares’s study[13]showed the stability changes in different atmosphere.Discrepancy comes that the same precise experimental conditions is hard to carry,as the decomposition will be affected by air,moisture,impurities and materials of container.Generally,the researchers identify the decomposition temperature by the macroscopic variations,such as the turning point on the curve of thermogravimetric,appearance of endothermic peak in differential scanning calorimetry(DSC)measurement, rapid gas emitting in mass spectrum measurement etc.Also,the decomposition reaction equations were speculated from the final products.
For NaNO2,between 330 and 380◦C,the reaction sequence is proposed to be as follows[14−16]:

Previous studies showed that the hyperoxides could be stabilized by interaction with the solution species such as alkali cations in molten nitrate salt[17].Furthermore,Freeman[18]attributed the evolution of N2to the formation of superoxide which later decomposes to Na2O and O2at higher temperatures.This view is also supported by Bond and Jacobs[19],they promoted a possible equation

For NaNO3,it is widely believed that the first stage of decomposition[14−16]is

Kust et al.[16]demonstrated that the NO2in alkali metal nitrate can be detected at temperature as low as 295◦C.Nissen and Meeker[20]monitored the concentration of NO2in solar salt at 550−600◦C with different oxygen partial pressures.It was found that the percentage of nitrite ion increased with the rising of temperature and the decrease of oxygen partial pressure.In addition,the oxide species,O2−,O22−or O2−,were unable to be detected in their experiments and their concentrations could be less than 10−5mol/kg,which are below the detection limit of the pH measurements. However,Zambonin’s studies[21−23]showed the oxide species were produced in molten NaNO3-NaNO3, as follows:

Eqs.(7),(8)and(9)existed with equilibrium constants of K7≈3,K8≈6.7×10⁻¹¹and K9≈3.5×10⁵all at 229◦C by electrochemical method.Afterwards,in view of the paramagnetism of O2−,Zambonin[24]used electron paramagnetic resonance(EPR)to detect the signal of O2−in the quenched NaNO3-KNO3salt.The signal was still detected after preserving in inert atmosphere for months,which implies that O2−can exist in the binary nitrate salts under room temperature.Nevertheless,the in situ probe on O2−in molten ternary nitrates/nitrites salt(HTS)was never performed,and the way of superoxide anion generation in molten nitrates salt is still undeterminable.
Generally,many analytical methods[25]are able to be used to identify O2−,for instance,EPR[26],Raman[27],UV-visible[28−31]and IR[32]spectroscopic methods,etc.However,the spectral detection of O2−is hard to carry out because of its low concentration and high reactivity in high temperature molten salt, especially,for in situ probe.Although UV-visible,IR absorption and Raman spectroscopy instruments have been used to study the spectra of high temperature molten nitrates/nitrites salt[33−35],the results did not show a spectral evidence for the presence of O2−. While by adding KO2into FLiNaK(LiF/NaF/KF, 46.5 mol%/11.5 mol%/45 mol%),Young and coworkers[36]observed an absorption peak at 254 nm which was assigned to O2−by subtracting origin absorption spectrum of molten FLiNaK at 500◦C.This peak quickly disappeared afterwards.Alkali metal superoxide presents yellow.And the higher the temperature, the deeper the color.So it is very likely that superoxide ion can be discerned by visible absorption spectra in molten alkali metal salt if it really exists.
In this work,the high temperature UV-visible absorption spectrometer was built,by which decomposition mechanism of the molten HTS salt was investigated. In this process,it mainly was involving production and identi fication of O2−.Additionally,EPR experiment was also carried out to further verify the conclusion from UV-visible absorption spectroscopy.
II.EXPERIMENTS
A.Sample preparation
NaNO3,NaNO2,KNO3(AR)and KO2(>96.5% pure)obtained from Sinopharm Chemical Reagent Co., Ltd.NaNO3and KNO3are pure white crystals while NaNO2is slightly yellow crystals,KO2is golden yellow powder.All reagents are placed into the glovebox to avoid air and moisture due to the hygroscopicity of solid salts and strong reactivity of superoxide.Besides, the samples will be sealed during transfer.
The procedure of HTS preparation includes three steps.Firstly,drying operation at 120◦C on three components(NaNO3,NaNO2,and KNO3)was conducted for two days to eliminate the potential free water.Secondly,three components were weighed by proportion of 7 wt%,40 wt%,and 53 wt%and placed into vitreous carbon crucible for grounding uniformly,after that, they were heated to 120◦C for 10 h in furnace to reeliminate the free water,Thirdly,it keeps the temperature at 250◦C for 24 h,three components can form the eutectic salt(HTS).Finally,after the eutectic salt was cooled,it was transferred to glovebox.The prepared molten salt was sampled to perform the differential scanning calorimetry(DSC)test to verify its quantity.The result was shown in FIG.1,from which the melting point can be determined to be 142.9◦C that isin good agreement with the authentic one.
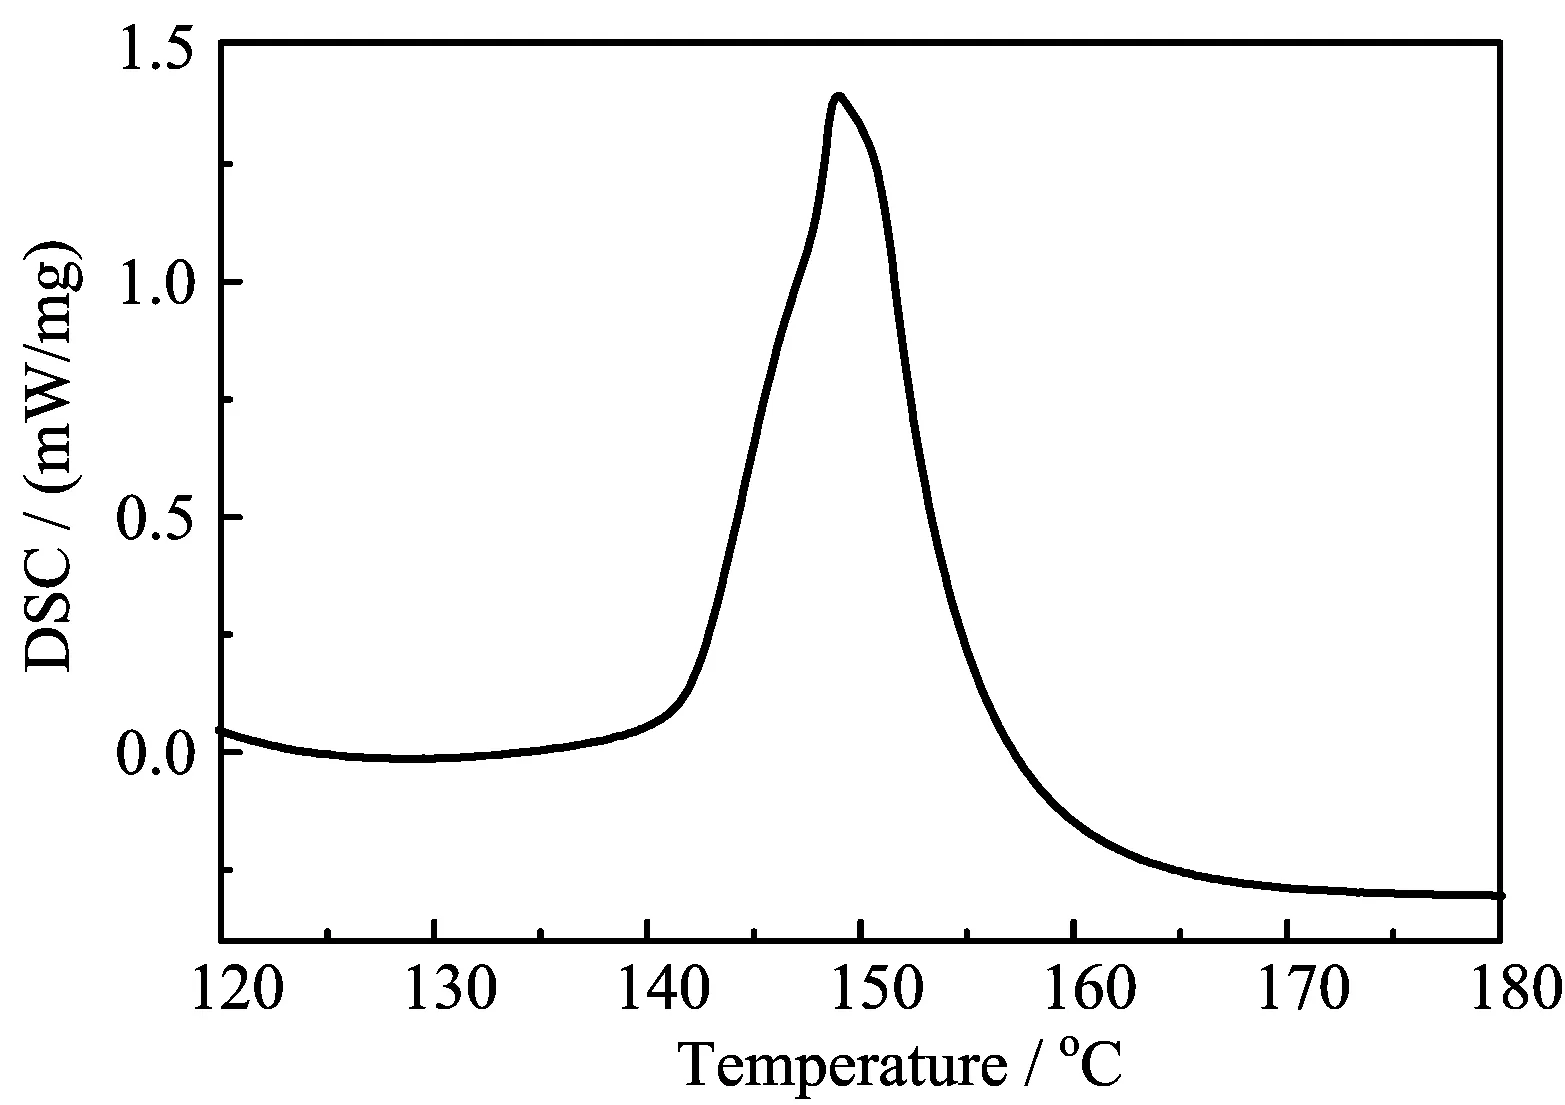
FIG.1 DSC result of HTS samples.
B.Ultraviolet-visible absorption spectroscopy
Owing to no standard instrument competent for the high temperature measurement of molten salts,a UV-visible spectrometer was built to obtain molten salts in situ absorption spectra at high temperature.
The system includes three main components,the light source,furnace,and a fiber spectrometer.The light source is deuterium lamp with iDH2000-UV bought from Shanghai Ideaoptics Corp.,Ltd.that is connected with one fiber.The apparatus scheme of furnace is displayed in FIG.2.
The cover of furnace is two-half pattern with a hole of diameter 20 mm in the center and four windows are situated on the opposition and same level position that can allow the light beam to pass through.A metal base is located at the bottom of the furnace hearth that can be used to orientate the cuvette.A temperature controller connected with the furnace provided both the actual temperature readout and the means for setting the target temperature with actual power control.The light goes straightly through the furnace to the fiber linked with the spectrometer of QE pro 65 bought from Ocean Optics.
The spectrometer is controlled by a computer,on which the processed real-time spectrum is recorded.In addition,the sample cell is a modi fied quartz cuvette welded a long tube of 15 cm,which is designed to allow the tube mouth out of the furnace hearth and away from high temperature,so that the routine seal methods can be adopted.For example,a rubber plug or rubber membrane can be used to seal the cuvette.In the experiment,it was found that a closed system isolated from air can be obtained using these routine seal methods.Procedures to obtain the spectra are described here.Firstly,the empty cuvette was employed to get the background.After that,the sample was loaded into cuvette in glovebox and then sealed by the rubber membrane which can relieve the increased pressure caused by the slow gas emission from molten salt.The cuvette with sample was then transferred to furnace to be heated for obtaining the absorption spectra,the heating rate is 5◦C/min until the target temperature.After the spectrum reached stable for 5 min,spectroscopic data began to be recorded.To observe the variation of spectra with temperature increasing,it grows to a new target temperature with 50◦C interval for several times and separately recorded the spectra.Every recording result repeated for five times to ensure the reliability of results.
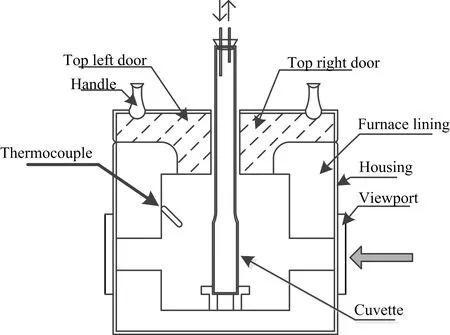
FIG.2 The overview of furnace for high temperature UV-visible absorption spectroscopy.
C.Electron paramagnetic resonance
EPR spectrometer is the JES-FA200,from JEOL, Ltd.The operation temperature range is from−75◦C to 200◦C.Unlike O2−and O22−,the superoxide(O2−) has an unpaired electron in the antibonding orbital,so it is paramagnetic and can be probed by EPR.The 100% pure KNO3,NaNO2and NaNO3are believed diamagnetic while the analytical grade reagents may include trace of paramagnetic impurities which may affect the background signal.In spite of this,if O2−is generated during the heating process of HTS and stable after natural cooling,even at a low concentration,a sharp firstderivative EPR signal should show up which may be similar to the case of KO2/NaO2.
The EPR signal of powdered HTS and its components at room temperature were measured in the experiments,and a contrast experiment was carried out. We obtained the EPR results of two samples:HTS,the one being heated to the molten state and then cooled quickly to solid in sample room of EPR instrument;and a powdered mixture,with original component of 80 wt% KNO3and 20 wt%KO2,which was heated at 300◦C to form a transparent yellow molten salt and then cooled down to be solid and preserved in inert atmosphere.
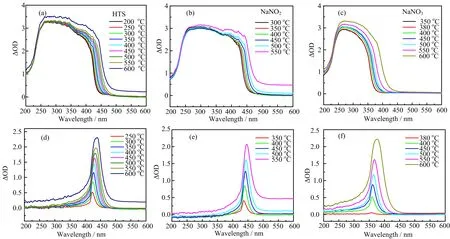
FIG.3 UV-visible absorption spectra of(a)HTS,(b)NaNO2,(c)NaNO3at different temperatures.(d)Results of HTS spectra at 250−600◦C subtracting that of HTS at 200◦C.(e)Results of NaNO2spectra at 350−550◦C subtracting that of NaNO2at 300◦C.(f)Results of NaNO3spectra at 380−600◦C subtracting that of NaNO3at 200◦C.
III.RESULTS AND DISCUSSION
A.Production of superoxide(O2−)veri fied by UV-visible spectra
The absorption spectra experiment was performed on HTS,NaNO2,and NaNO3,which are all sealed in the cuvette and located in the inert atmosphere at the beginning.As the decomposition process of KNO3is very similar to NaNO3,we only measured the spectra of NaNO3.For HTS,it began to melt at about 150◦C in the cuvette and became totally melted and homogeneous at about 200◦C,which can be judged from the real-time spectrum.Considering the baselines obtained by measuring the empty cuvette are always stable(no baseline fluctuation with time going or temperature increasing),the homogeneity(no obvious bubbles or defects inside)of sample can be veri fied by the stability of the spectral curve to a certain extent,and particularly, from the absorbance(∆OD)whose value should be very closely to zero when the curve is a horizontal line.Scattering loss can be ignored when there are no bubbles or other particles in molten salt.For the HTS sample, the measurements started at 200◦C when the HTS was completely melted,and spectra were recorded for every 50◦C intervals with the HTS heated up to 600◦C. For NaNO2and NaNO3,they melted completely at 300 and 350◦C and their measurement ended at 550 and 600◦C respectively.Particularly,a spectrum of NaNO3at 380◦C was measured,because it is widely believed that NaNO3decomposes slowly to NaNO2and O2at 380◦C.In order to study how the spectra change with temperature increasing,a series of spectra obtained by subtracting the original spectra at the beginning tempratrue from the one at higher temperature.The results are all shown in FIG.3.
It is found that there are no obvious gas products in HTS below 550◦C(see FIG.3(a)),because the curves in FIG.3(a)below and at 550◦C in long wavelength region are almost the same and undistinguishable.However,the contour of spectra grows largely at 600◦C because the evident gas causes scattering loss, which means the rapid decomposition happening at this temperature.From FIG.3(b)and(c),the NaNO2is found much more unstable than HTS at high temperature,since the first rising curve is at about 500◦C in FIG.3(b),lower than the one in HTS.So the experiments of HTS and NaNO2stopped at 600 and 550◦C to prevent the cuvette from high pressure and heavy corrosion[17]caused by O2−,which will react with SiO2to generate SiO32−.
Further evaluating FIG.3(a−c)shows that a dramatically absorption is located in the ultraviolet range. Due to the over-long(1 cm)optical path,the authentic absorption peak was saturated and could not be discerned.With the temperature increasing,the absorption bands of the three salts underwent red-shift,which can also be seen clearly from FIG.3(d−f).It is interesting to find some new absorption bands appearing when heating HTS,NaNO2and NaNO3to different temper-atures.Obviously,the main absorption differences in FIG.3(a),(b)or(c),derive not only from temperatures,but also from characteristic absorption of new species formed during the heating.Thanks to over-long optical path,the absorption bands of new species become discerned.The absorption peaks in FIG.3(d), (e),and(f)were denoted as A,B,and C,respectively. It can be seen from FIG.3(d)that the absorption peak of A is situated at about 422 nm at 250◦C and it redshifts to about 439 nm at 600◦C with the intensity enhancing.From FIG.3(e),like A,during the temperature range of 350−550◦C,the absorption peak of B red shifts from 436 nm to 446 nm.Unlike A and B, the absorption peak of C in FIG.3(f)redshifts from 357 nm(380◦C)to 376 nm(600◦C),the peak of A is at 427 nm(350◦C)and 435 nm(550◦C).Absorption bands of A are almost the same as the one of B at the same temperature.In addition,the NaNO2was as slightly yellow as HTS when melted,so it is reasonable to believe that two new species A and B could have the same absorption band.Plausible products derived from nitrates and nitrites are speculated in the light of considering the Eq.(5)and equilibria(7)−(9),the yellow new species(A/B)are supposed to be alkali metal superoxides.
Grein and Bruna’s theoretical study[37]of vertical electronic spectra of O2−shows that there is a calculated charge-transfer excitation O2−→Na+/1πg→3s at 2.7 eV,which will achieve the state 12B1(2b2→4a1). This kind of excitation corresponds to the absorption band at 463 nm,which makes the superoxide NaO2yellow.The color is induced owing to matter selectively absorbing photons according to modern matter structure theory[38].When the energy gap(∆E)between ground state and excited state is about 1.71−3.10 eV, photons with wavenumber at visible range can be absorbed to generate color.In FIG.3(d)and(e),the absorption bands of A and B situated at 400−490 nm represent the yellow color,which is consistent with what we observed by eyes.Bosch and Kanzig[30]also got the UV-visible absorption spectrum of solid powdered NaO2at room temperature by re flection method.It was found that the saturated absorption band was between 300 and 550 nm,making the maximum of absorption peak indiscernible.Mahanti and Khan[29]also thought that it is also responsible for the yellow color of the solid KO2by obtaining an absorption band at 350 nm by reflection at room temperature.In the molten HTS,there is trace of O2−but bulk of Na+and K+,so the chargetransfer transitions 1πg→3s or 1πg→4s can still occur. While in molten NaNO2,there is only charge-transfer transition 1πg→3s,which could also be responsible for the discrepancy of the absorption bands between HTS and NaNO2in the same temperature.With rising of temperature,the ground state energy of superoxide also grows,so the energy gap(∆E)between ground state and excited state shrinks,which corresponds to the absorption band undergoing redshift.
Other than charge transfer,other kinds of transition happen in O2−itself[37]. For isolated O2−, with a ground state X2Πg(2σg21πu41πg3),the transition 1πu→1πgor 1πg→2σuis with high∆E corresponding to an absorption band at UV or deep UV(<200 nm) and the former with a strong absorption coefficient.In Andrews’s group[28],they obtained the UV absorption spectra of alkali metal superoxides made by matrix isolation method at 17 K.An absorption band at about 250 nm was found and assigned to the transition 1πu→1πg.However,this band will be overlapped and covered by that of NaNO2and NaNO3(at 400◦C, 244 and 242 nm respectively,see FIG.4(a)and(b)). Therefore,it is rational that this kind of absorption was not found in our result spectra FIG.3(d)and(e).
The short optical path cuvette was used to get spectra of NaNO2and NaNO3at 400◦C when they were films in cuvette(see FIG.4(a)and(b)).The spectrum of NaNO3has a strong band at about 242 nm and a weak band at about 300 nm at high temperature.For NaNO2,they are at 244 and 354 nm.This is similar to that obtained in aqueous solution.The spectra of NaNO2and NaNO3obtained from dilute aqueous solution(0.004−1 mg/L)show a strong band at 210 and 202 nm.While in saturated aqueous solution,the absorption of two bands is saturated and shown at 354 nm (NaNO2)and 300 nm(NaNO3),the same as the result at high temperature.
From FIG.3(f),a very small peak can be seen at 357 nm at 380◦C,where the slow decomposition begins, and the absorption band of C redshifts from 359 nm to 376 nm from 400◦C to 600◦C.According to the high temperature spectrum of NaNO2film at 400◦C,it is reasonable to conclude that the new species generated from NaNO3is NaNO2.Previously,Young and coworkers[36]by adding NO2−into FLiNaK,obtained a band at 365 nm at 500◦C and assigned to NO2−.The band in our result of spectra at 500◦C is located at 364 nm. Consequently,our findings are in great agreement with that in the literatures,and by the way the reliability of the experimental method is veri fied.
Through above analysis,it can be concluded that superoxide O2−is generated during the decomposition of molten HTS.To be detailed,the O2−is mainly derived from nitrite salt.Eq.(6)is of certain possibility because a number of N2was found at a relatively low temperature[19].
B.Further veri fication of production of superoxide by EPR
In order to verify the formation of superoxide from HTS decomposition,the EPR experiments were also conducted.About 30−50 mg powdered KNO3,NaNO2, NaNO3and HTS were loaded into the quartz pipe in glovebox,then they were sealed by sealing film and measured by EPR at the room temperature.The experi-mental results showed no paramagnetic signal of the four samples,which means there is no superoxide in analytically pure KNO3,NaNO2,NaNO3and prepared HTS kept in glovebox for a relatively long time.
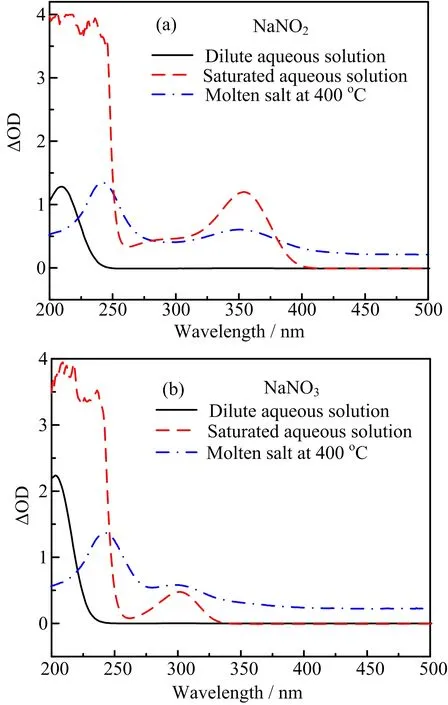
FIG.4(a)UV-visible spectra of NaNO2dissolved in aqueous at room temperature and the thin liquid film molten NaNO2at 400◦C.(b)UV-visible spectra of NaNO3dissolved in aqueous at room t◦emperature and the thin liquid film molten NaNO3at 400C.
However,a sharp first-derivative signal shows up when the solid HTS which was heated to molten state, which means that the superoxide was possibly generated when heating HTS and it can be stable for a short time.Further validating the formation of superoxide, the comparison experiment was done between HTS and KNO3with addition of KO2.Due to instability,KO2can be decomposed when heated,while it has been reported that KO2and KNO3can form eutectic structure [17,39].Therefore,a mixture of KNO3with addition of KO2was selected to be compared with the quickly cooled HTS after heating to molten salt.The mixture was transferred into quartz pipe and sealed,heating to 300◦C,then cooled down to room temperature.Both the cooled mixture and HTS were used to do EPR experiment.Results are displayed in FIG.5.
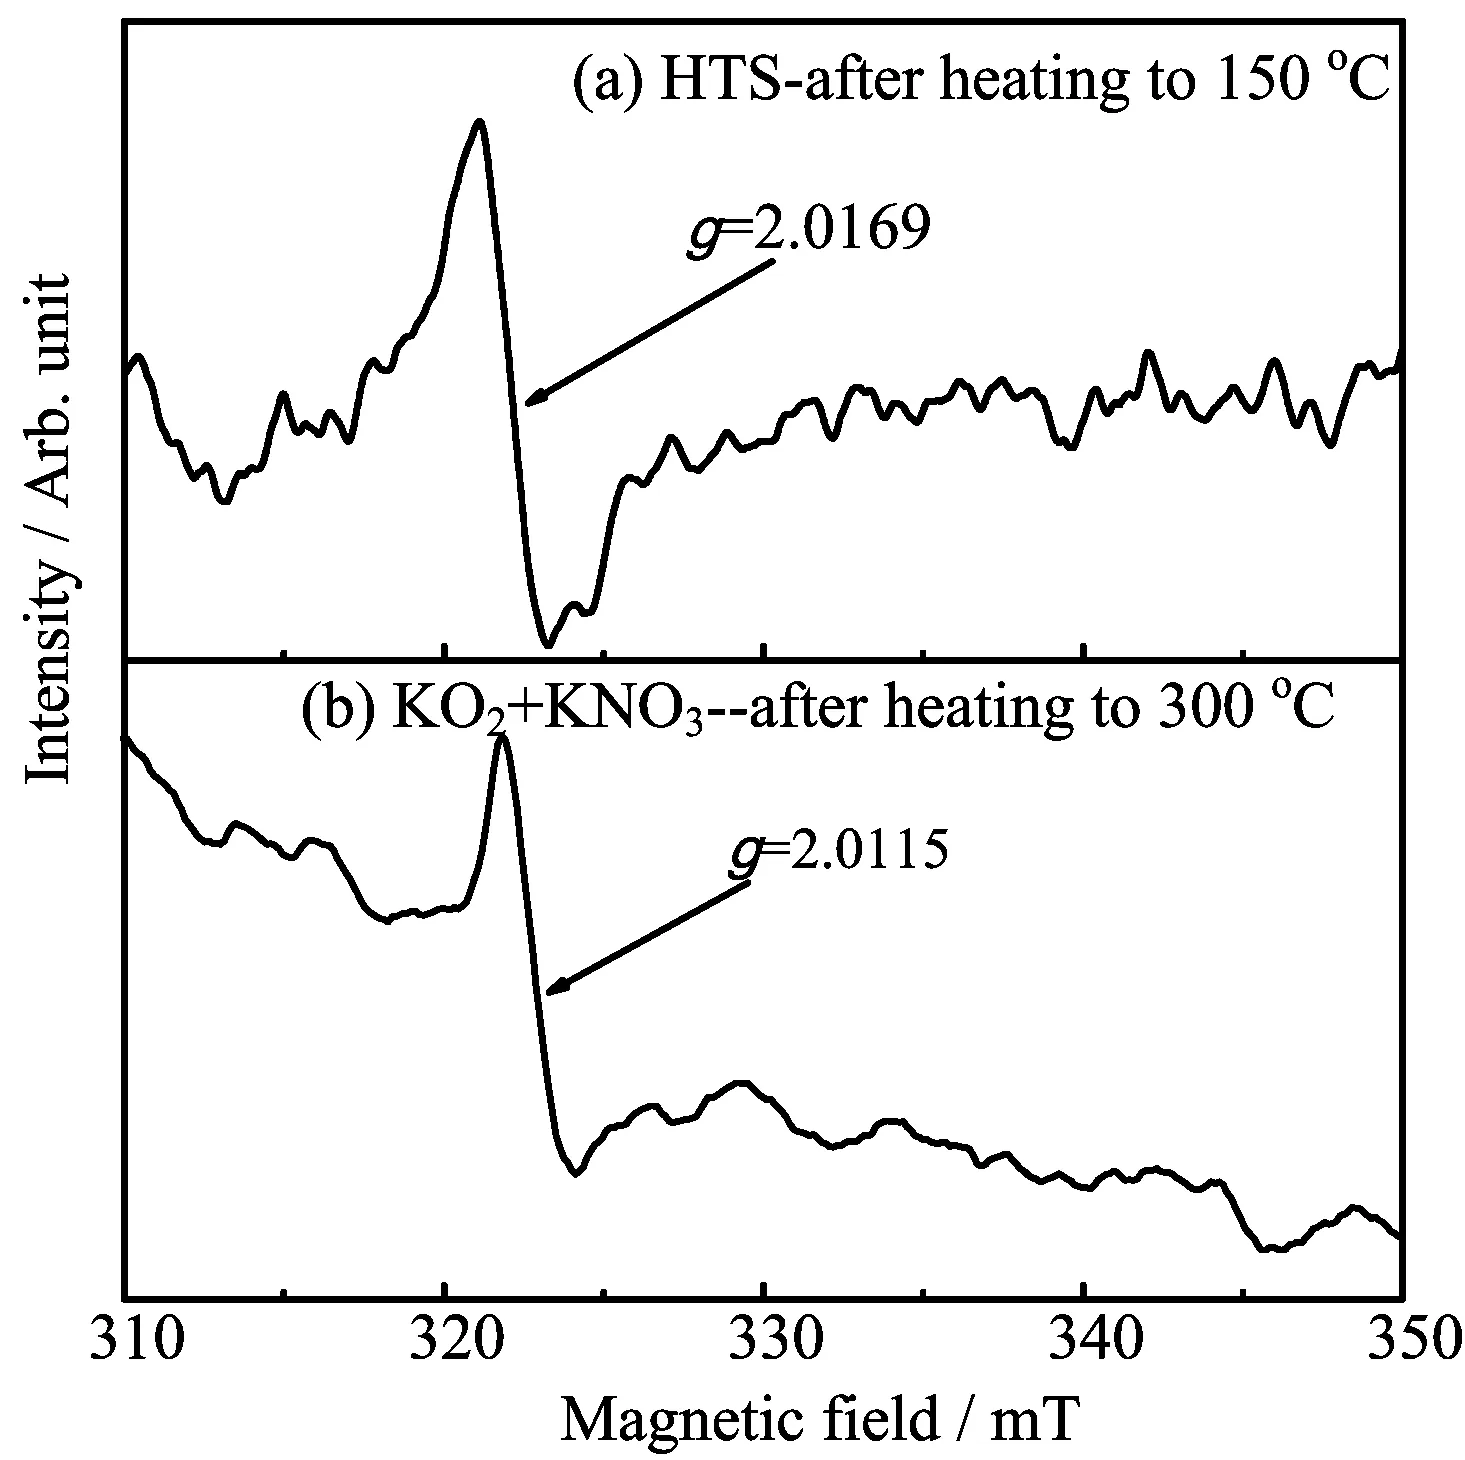
FIG.5 The EPR signal in quickly cooled HTS and a mixture of KO2and KNO3.
A very similar signal appeared at the same magnetic field point with an average g value of 2.0169 and 2.0115 respectively,seeing FIG.5(a)and(b),proving the existence of O2−,although the backgrounds were a little different.It was indicated in Ref.[24]that superoxide species dissolved in various solid matrixes give origin to ESR signals presenting nonaxial tensors.So,geometry of the superoxide in molten salt is certainly in disagreement with the geometry of“free“superoxide ions.In addition,it was also showed that diatomic radicals having three electrons in a π level(such as O2−)usually presented a g value great than free-spin value 2.0023 [40],which were almost identical.Therefore,it is not surprising that the g value of the superoxide ion in the two samples is greater than the one of the free electron O2−which is unstable in NaNO2,and it will further decompose into O22−,O2−,and O2,and in addition,O2−will react with NaNO2to form NaNO3and O2−.However,in HTS,NO−3,and NO2−account for a large proportion,and K+and Na+are able to stabilize O22−and O2−,respectively,to a certain extent.Therefore,equilibriums(Eqs.(7)and(8))[22,24]are possible present in the HTS with certain reaction equilibrium constants, which may explain why the O2−in HTS is detectable by EPR.
IV.CONCLUSION
The UV-visible absorption spectra of molten HTS, NaNO3and NaNO2were gained at different temperature.Due to the strong absorption band,no obvious peak was discerned.Therefore,spectra at high temperature subtracted the spectrum at the lowest temperature,which gives a new absorption band.With temperature rising,this new band redshifts and intensity enhances.Through analysis and comparison,it is concluded that they were assigned to superoxide(O2−)derived from HTS decomposition.EPR results also verify this conclusion.In addition,the UV-visible result also implies that the nitrite salt is more instable than nitrate salt and easy to generate superoxide.For nitrate salt,it firstly decomposed to give nitrite salt followed byfurther decomposition to form superoxide.The yellow color can also be identi fied as the formation of superoxide.The study of superoxide is not only bene ficial to deeply explore the decomposition mechanism of molten nitrates/nitrites salt,but also helpful to analyze the corrosion process between molten salt and metallic material in CSP system.
V.ACKNOWLEDGMENTS
This work was supported by the“Strategic Priority Research Program,TMSR”of the Chinese Academy of Sciences(No.XD02002400),the National Natural Science Foundation of China(No.51506214),the Hundred Talents Program,CAS and Shanghai Pujiang Program.
[1]H.L.Zhang,J.Baeyens,J.Degr`eve,and G.Cac`eres, Renew.Sustain.Energy Rev.22,466(2013).
[2]B.Xu,P.W.Li,and C.Chan,Appl.Energy 160,286 (2015).
[3]R.I.Dunn,P.J.Hearps,and M.N.Wright,Proc.IEEE 100,504(2012).
[4]L.J.Wang and Q.Y.Yan,Mater.Sci.5,72(2015).
[5]D.Kearney,U.Herrmann,P.Nava,B.Kelly,R.Mahoney,J.Pacheco,R.Cable,N.Potrovitza,D.Blake, and H.Price,J.Sol.Energy Eng.125,293(2003).
[6]K.Vignarooban,X.H.Xu,A.Arvay,K.Hsu,and A. M.Kannan,Appl.Energy 146,383(2015).
[7]U.Herrmann,B.Kelly,and H.Price,Energy 29,883 (2004).
[8]D.Kearney,B.Kelly,U.Herrmann,R.Cable,J. Pacheco,R.Mahoney,H.Price,D.Blake,P.Nava,and N.Potrovitza,Energy 29,861(2004).
[9]G.J.Janz and G.N.Truong,J.Chem.Eng.Data 28, 201(1983).
[10]C.T.Yang,X.L.Wei,W.L.Wang,Z.H.Lin,J.Ding, Y.Wang,Q.Peng,and J.P.Yang,Appl.Energy 184, 346(2016).
[11]J.Alexander Jr.and S.G.Hindin,Ind.Eng.Chem.39, 1044(1947).
[12]Q.Peng,X.X.Yang,J.Ding,X.L.Wei,and J.P. Yang,CIESC J.64,1507(2013).
[13]R.I.Olivares,Sol.Energy 86,2576(2012).
[14]K.H.Stern,J.Phys.Chem.Ref.Data 1,747(1972).
[15]C.M.Kramer,Z.A.Munir,and J.V.Volponi,Sol. Energy 29,437(1982).
[16]R.N.Kust and J.D.Burke,Inorg.Nucl.Chem.Lett. 6,333(1970).
[17]A.A.El Hosary,D.H.Kerridge,and A.M.Shama El Din,Oxide Species in Molten Salts.Ionic Liquids,D. Inman and D.G.Lovering Eds.,New York:Springer, (1981).
[18]E.S.Freeman,J.Am.Chem.Soc.79,838(1957).
[19]B.D.Bond and P.W.M.Jacobs,J.Chem.Soc.A 1265 (1966).
[20]D.A.Nissen and D.E.Meeker,Inorg.Chem.22,716 (1983).
[21]P.G.Zambonin and J.Jordan,J.Am.Chem.Soc.89, 6365(1967).
[22]P.G.Zambonin and J.Jordan,J.Am.Chem.Soc.91, 2225(1969).
[23]P.G.Zambonin,F.Paniccia,and A.Bufo,J.Phys. Chem.76,422(1972).
[24]P.G.Zambonin,Chemischer Informationsdienst 5, 1294(1974).
[25]M.Hayyan,M.A.Hashim,and I.M.Alnashef,Chem. Rev.116,3029(2016).
[26]D.M.Lindsay,D.R.Herschbach,and A.L.Kwiram, Chem.Phys.Lett.25,175(1974).
[27]R.R.Smardzewski and L.Andrews,J.Chem.Phys. 57,1327(1972).
[28]L.Andrews,J.Mol.Spectrosc.61,337(1976).
[29]A.U.Khan and S.D.Mahanti,J.Chem.Phys.63, 2271(1975).
[30]M.Bosch and W.Kanzig,Helv.Phys.Acta 48,743 (1975).
[31]T.Ozawa and A.Hanaki,FEBS Lett.74,99(1977).
[32]L.Andrews,J.Phys.Chem.73,3922(1969).
[33]S.Passerini and T.Mckrell,J.Nano fluids 1,78(2012). [34]J.Z.Li and P.K.Dasgupta,Rev.Sci.Instrum.71, 2283(2000).
[35]X.W.Hu,Z.Sheng,B.L.Gao,Z.N.Shi,C.S.Huang, and Z.W.Wang,Metall.Anal.34,32(2014).
[36]F.L.Whiting,G.Mamantov,and J.P.Young,J.Inorg. Nucl.Chem.34,2475(1972).
[37]P.J.Bruna and F.Grein,Mol.Phys.97,321(1999).
[38]G.D.Zhou,Inorganic Structural Chemistry,Beijing: Science Press,(1982).
[39]X.L.Lv,Chemistry of Inorganic Hyperoxide,Beijing: Science Press,(1987).
[40]H.R.Zeller and W.Kanzig,Helv.Phys.Acta 40,845 (1967).
ceived on March 21,2017;Accepted on June 20,2017)
∗Authors to whom correspondence should be addressed.E-mail: liuhongtao@sinap.ac.cn
杂志排行
CHINESE JOURNAL OF CHEMICAL PHYSICS的其它文章
- γ-Ray Irradiation-Derived MnO/rGO Composites for High Performance Lithium Ion Batteries
- Intermolecular Interactions in Self-Assembly Process of Sodium Dodecyl Sulfate by Vertically Polarized Raman Spectra
- Binding Mechanism and Molecular Design of Benzimidazole/Benzothiazole Derivatives as Potent Abl T315I Mutant Inhibitors
- Highly Responsive and Selective Ethanol Gas Sensor Based on Co3O4-Modi fied SnO2Nano fibers
- Geometric Design of Anode-Supported Micro-Tubular Solid Oxide Fuel Cells by Multiphysics Simulations
- Laser-Assisted Stark Deceleration of Polar Molecules HC2n+1N(n=2,3,4) in High-Field-Seeking State
