Intermolecular Interactions in Self-Assembly Process of Sodium Dodecyl Sulfate by Vertically Polarized Raman Spectra
2017-09-03YuxiWngKeLinLinChenXioguoZhouShilinLiu
Yu-xi Wng,Ke Lin,Lin Chen,Xio-guo Zhou,Shi-lin Liu∗
a.Hefei National Laboratory for Physical Sciences at the Microscale,Department of Chemical Physics, University of Science and Technology of China,Hefei 230026,China
b.School of Physics and Optoelectronic Engineering,Xidian University,Xi’an 710071,China
ARTICLE
Intermolecular Interactions in Self-Assembly Process of Sodium Dodecyl Sulfate by Vertically Polarized Raman Spectra
Yu-xi Wanga,Ke Linb∗,Lin Chena,Xiao-guo Zhoua,Shi-lin Liua∗
a.Hefei National Laboratory for Physical Sciences at the Microscale,Department of Chemical Physics, University of Science and Technology of China,Hefei 230026,China
b.School of Physics and Optoelectronic Engineering,Xidian University,Xi’an 710071,China
Molecular self-assembly is extremely important in many fields,but the characterization of their corresponding intermolecular interactions is still lacking.The C−H stretching Raman band can re flect the hydrophobic interactions during the self-assembly process of sodium dodecyl sulfate(SDS)in aqueous solutions.However,the Raman spectra in this region are seriously overlapped by the OH stretching band of water.In this work,vertically polarized Raman spectra were used to improve the detection sensitivity of spectra of C−H region for the first time.The spectral results showed that the first critical micelle concentration and the second critical micelle concentration of SDS in water were 8.5 and 69 mmol/L,respectively, which were consistent with the results given by surface tension measurements.Because of the high sensitivity of vertically polarized Raman spectra,the critical micelle concentration of SDS in a relatively high concentration of salt solution could be obtained in our experiment. The two critical concentrations of SDS in 100 mmol/L NaCl solution were recorded to be 1.8 and 16.5 mmol/L,respectively.Through comparing the spectra and surface tension of SDS in water and in NaCl solution,the self-assembly process in bulk phase and at interface were discussed.The interactions among salt ions,SDS and water molecules were also analyzed. These results demonstrated the vertically polarized Raman spectra could be employed to study the self-assembly process of SDS in water.
Vertically polarized Raman spectroscopy,Sodium dodecyl sulfate,Selfassembly,Critical micelle concentration,Intermolecular interactions
I.INTRODUCTION
The self-assembly process of surfactants is of great signi ficance in many fields.The critical micelle concentration of surfactants(CMC),which refers to the concentration of the surfactant required to form micelles, has been extensively studied[1–8].Surface tension[9], light scattering[10,11], fluorescence[12],and X-ray scattering[13]can be used to obtain the CMC values.At the first critical micelle concentration(FCMC), the surfactant monomers begin to aggregate to form spherical micelles[14–18],and at the second critical micelle concentration(SCMC),the spherical micelles transform into rod-like micelles[19–22].Light scattering[10],X-ray scattering[13],small angle neutron scattering(SANS)[11],and other methods can be used to determine the shape and size of micelles.
Although these technologies were used to measure the CMC and shape of micelle in the process of selfassembly,few studies were focused on the molecular interaction details.Raman spectroscopy is an important method to study molecular interactions.While Raman spectroscopy is used,parallel polarized Raman spectra are usually collected because of the high spectral intensity.However,parallel polarized Raman spectra in the C−H stretching region in diluted aqueous solutions are usually overlapped by the O−H stretching Raman bands of water,thus the detection sensitivity is relatively low.As a result,studies on the aggregation process of surfactants in water have been limited to relatively high concentrations[2,23].
Actually,both the parallel and vertical polarized Raman spectra play a very important role in spectral analysis.For example,through the parallel polarized Raman spectra and vertically polarized Raman spectra, the depolarization ratio can be obtained,and it is used to re flect the symmetry of vibration modes and to assign the Raman spectra[24–26].The parallel and vertical polarized spectra were used to study the reorientation motion of alcohol molecules in water[27].Both polarized spectra were used to measure the isotropic spectra, which were used to simplify the Raman spectra in the C−H stretching region of alcohols,and the gauche con-formers of the alcohols were identi fied in the spectra[28].
In this study,the vertically polarized Raman spectra were used to study the self-assembly process of the important anionic surfactant-sodium dodecyl sulfate(SDS)[29,30].Through using the vertically polarized spectra,the OH stretching Raman bands of water were suppressed,and the spectra of SDS in the C−H stretching region were simpli fied.As a result,the detection sensitivity of spectra of C−H stretching region was improved.The CMC values of SDS in H2O and NaCl/H2O solutions were obtained from vertically polarized Raman spectra.The aggregation process of SDS and the molecular interactions in the process of aggregation were also discussed.
II.EXPERIMENTS
SDS(99%)was purchased from Sigma Aldrich,and used without further puri fication.NaCl(99.5%)was purchased from Sinopharm Chemical Reagent Co.Ltd. and heated at 650◦C for 10 h to remove the impurities.Deionized water was prepared from a Milli-Q reference system(Millipore,Bedforrd,MA,8.4 MΩ·cm). SDS/H2O solutions were prepared from 0.5 mmol/L to 294.8 mmol/L,SDS/(NaCl/H2O)solutions,were prepared from 0.4 mmol/L to 292.7 mmol/L,and the concentration of NaCl solution were kept at 100 mmol/L.
The spontaneous Raman setup was described in our previous studies[31–37],and described brie fly here. In this experiment,a cw laser(Coherent,Verdi V5, 532 nm)with 4.0 W power was used as the excitation light.Its polarization was puri fied by a Glan prism,and was controlled by a half wave plate.The Raman scattering light was collected at 180◦geometry relative to the direction of laser.The polarization of the Raman light was selected by a Glan prism,and then scrambled by a depolarizer.The scattering light was dispersed by the triple monochromator(Acton Research, TriplePro)and was recorded by a liquid-nitrogen-cooled CCD detector(Princeton Instruments,Spec-10:100B). The aqueous solutions were hold in SiO2cuboid cell (1 cm×1 cm×3 cm).The temperature of samples was kept at(25±0.1)◦C by a heating bath(THD-2006, Ningbo).
The surface tension experiments were performed with the Wilhelmy plate method that measures the capillary force exerted on a flat plate by a tensiometer(BZY-1). The measuring accuracy is 0.1 mN/m.
III.RESULTS AND DISCUSSION
A.Parallel polarized Raman spectra of SDS in diluted aqueous solution
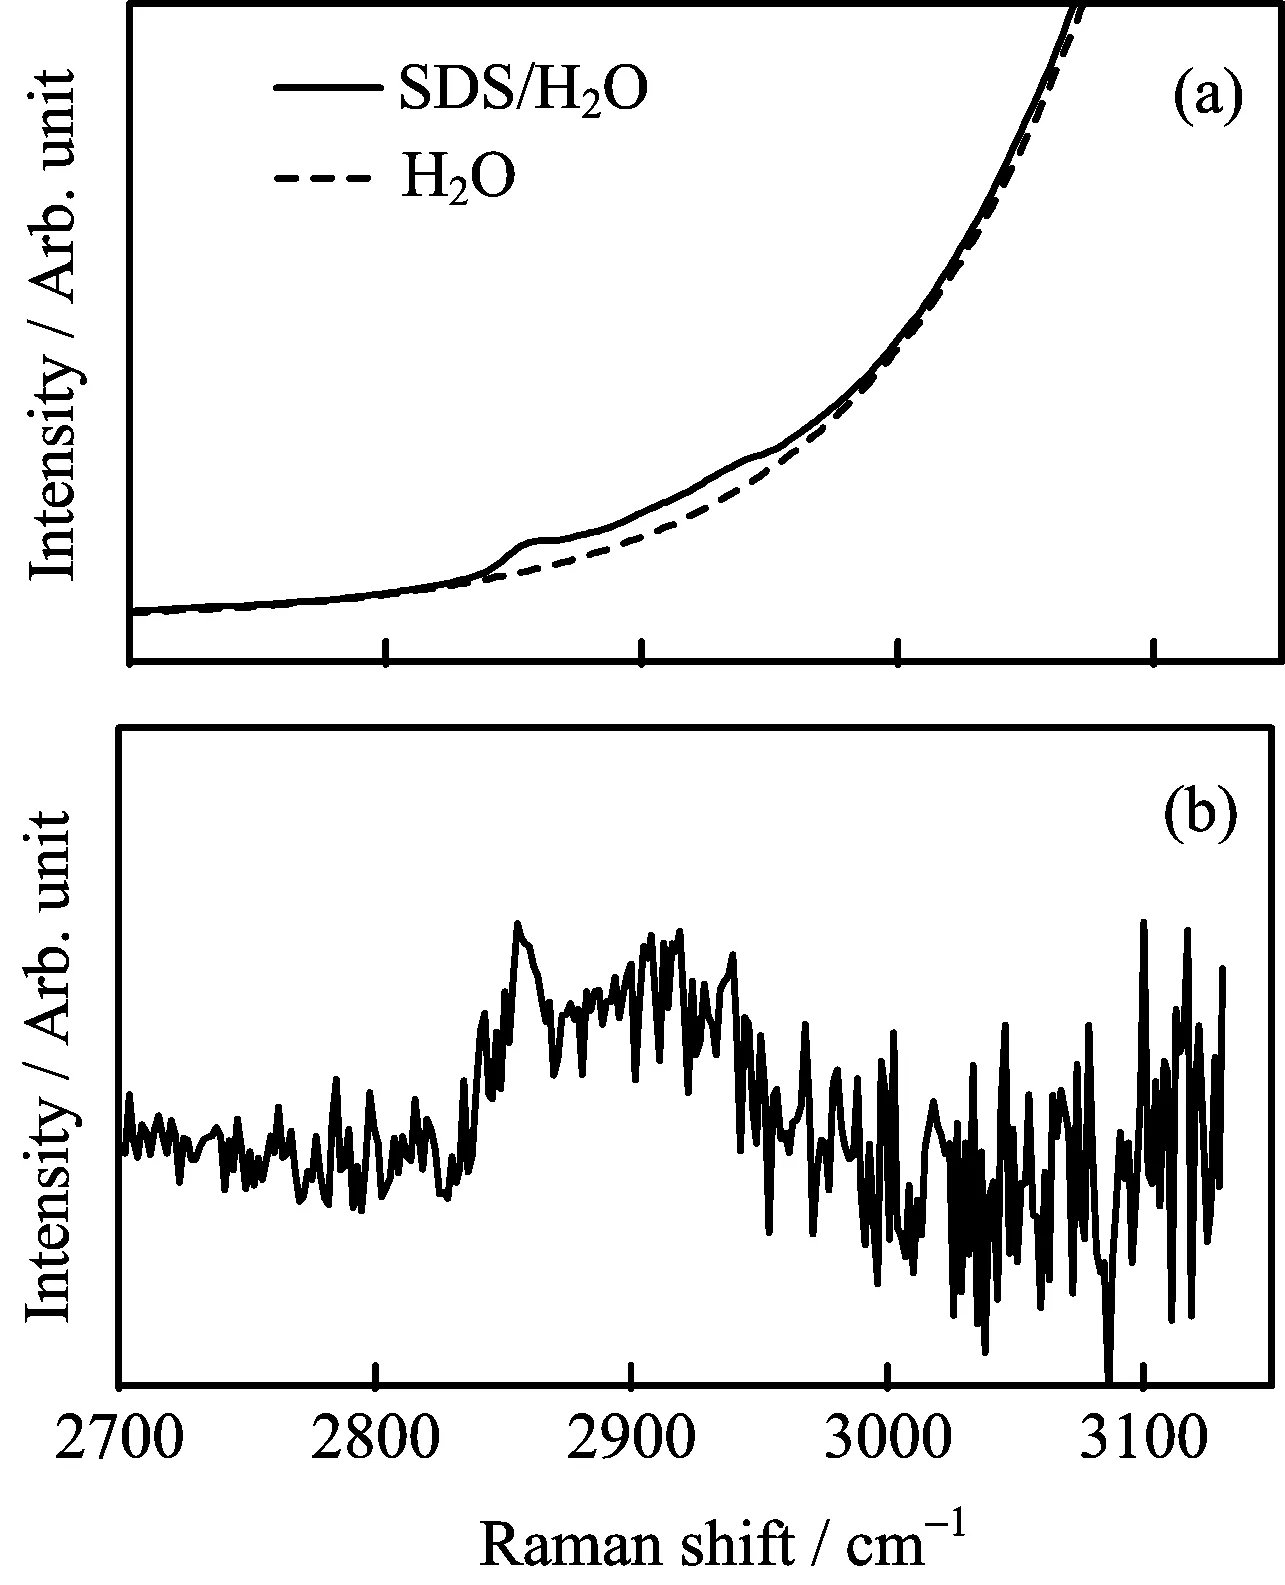
FIG.1(a)Experimental parallel polarized Raman spectra of SDS/H2O solution(solid line)and pure water(dashed line)in the C−H stretching region,(b)The spectrum of SDS in the C−H stretching region;The concentration of SDS/H2O solution is 0.8 mmol/L.
SDS can form micelles in water via the hydrophobic interaction of alkyl groups.The conformation and surrounding environment of the long alkyl chains change signi ficantly during the formation of the micelles[38]. The asymmetric CH2stretching mode(νas(CH2))is sensitive to these change.Therefore,νas(CH2)can be used as an indicator for the SDS self-assembly process[16]. Due to the high spectral intensity,parallel polarized Raman spectra are used in previous Raman spectroscopic studies[2,23].We also record the parallel polarized Raman spectra of extremely diluted aqueous SDS solution(0.8 mmol/L)and pure water at 2700−3150 cm−1.The Raman spectrum of aqueous SDS solution in the C−H stretching region presents a very strong background that interfered with the C−H stretching Raman bands,as shown in FIG.1(a)(solid line).The background is mainly contributed by the O−H stretching band of water,as shown in FIG.1(a) (dash line).The spectrum of C−H stretching vibrational mode was obtained by subtracting the O−H stretching band,as shown in FIG.1(b).The peak at 2855 cm−1was assigned to the symmetric CH2stretching mode(νs(CH2)),and the broad peak at~2900 cm−1was attributed to the asymmetric CH2stretching mode (νas(CH2)),the CH3stretching mode,and their corresponding Fermi resonance peaks.These peaks overlapped severely,and it was difficult to accurately determine the peak position of νas(CH2).
B.Vertical polarized Raman spectra of SDS in diluted aqueous solution
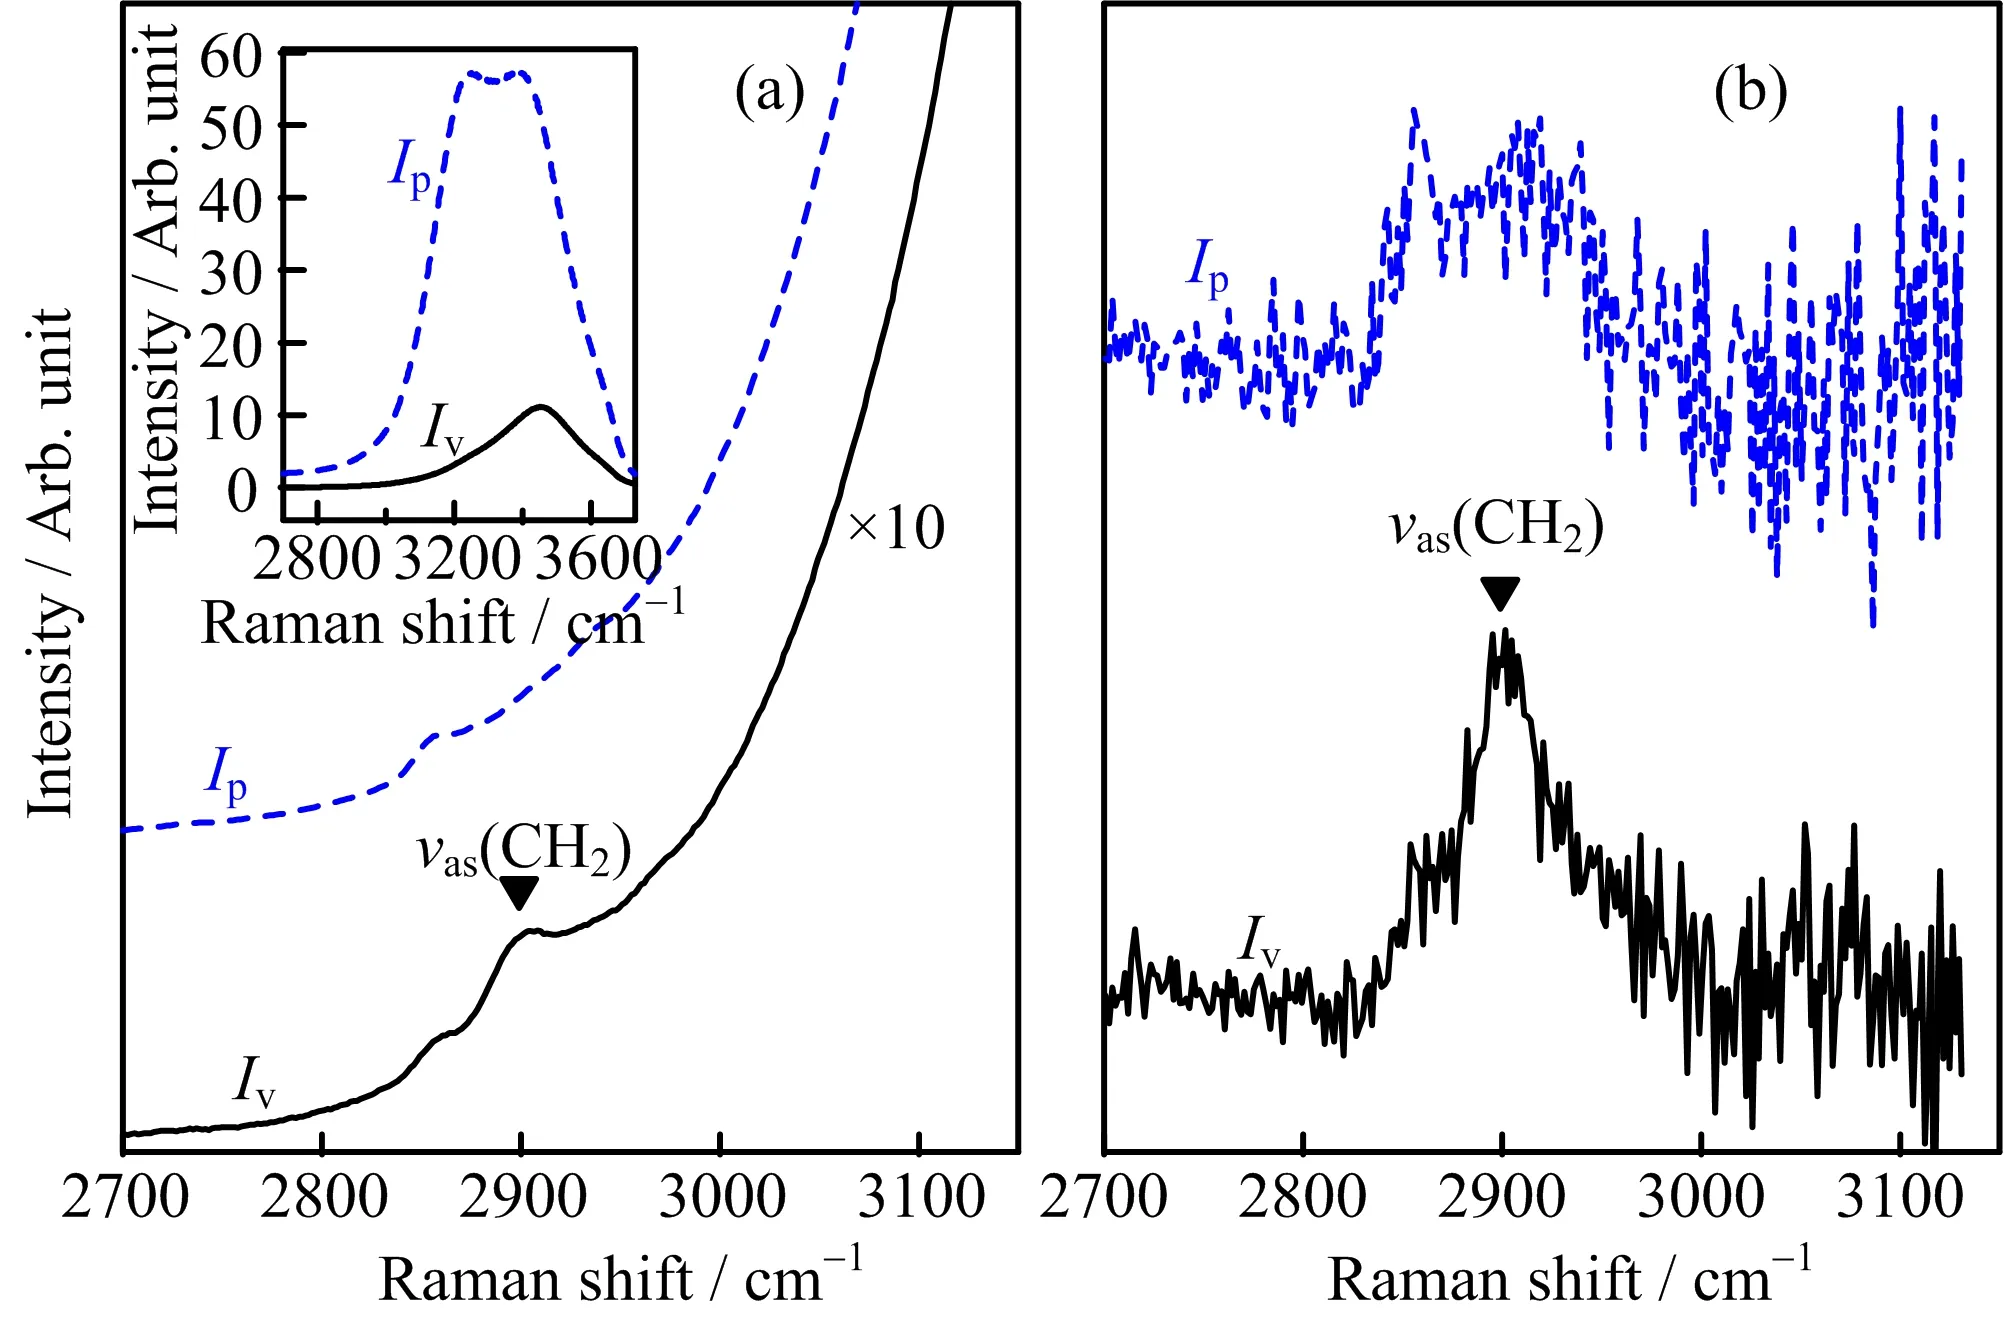
FIG.2 Parallel(dashed line)and vertical(solid line)polarized Raman spectra of SDS/H2O solution in the C−H stretching region with(a)and without O−H stretching band background(b).Insert spectra in(a)is Ipand IvRaman spectrum of H2O in the O−H stretching region.The concentration of SDS/H2O solution is 0.8 mmol/L,Ivmeans vertically polarized Raman spectroscopy,Ipmeans parallel polarized Raman spectroscopy,νas(CH2)means antisymmetric -CH2stretching mode.
Unlike most studies using parallel polarization Raman spectra[2,23],vertically polarized Raman spectra of aqueous SDS solution were recorded in the CH stretching region in this study,as shown in FIG.2(a) (solid line).Although the intensity of the vertically polarized Raman spectrum is weaker than that of parallel polarized Raman spectrum,the νas(CH2)in the vertically polarized spectrum was more apparent than in the parallel polarized spectrum(FIG.2(a)dashed line). This was because the intensity of the O−H stretching band of water in these spectral region was signi ficantly weakened in the vertically polarized spectrum[31].In the spectral region,the OH stretching bands were assigned to the in-phase vibration mode of the water molecules with strong hydrogen bonds,and the Raman spectra of this mode are weak in the vertically polarized Raman spectra,as shown in the inserted spectra in FIG.2(a).After the O−H stretching band of water was subtracted,the spectrum of C−H stretching mode was obtained,as shown in FIG.2(b)(solid line).Compared with the parallel polarized spectrum(FIG.2(b) dash line),the vertically polarized spectrum exhibited an improved signal to noise ratio.More importantly, in vertically polarized spectra,νs(CH2)is signi ficantly weakened[33,39],thus the antisymmetric-CH2stretching band νas(CH2)was fully resolved at~2885 cm−1. Consequently,even at a very low concentration,the accurate peak position of νas(CH2)can be obtained from the vertically polarized Raman spectra.
C.Self-assembly process in aqueous SDS solution
FIG.3 shows the vertically polarized Raman spectra of SDS in water with different concentrations in the C−H stretching region.A weak peak at 2855 cm−1was assigned to νs(CH2).A strong peak at~2885 cm−1was assigned to νas(CH2).The νas(CH2)could still be observed in very low concentration,even in 0.5 mmol/L solution.This indicates that vertically polarized Raman spectra can be used to characterize SDS in very diluted solutions.
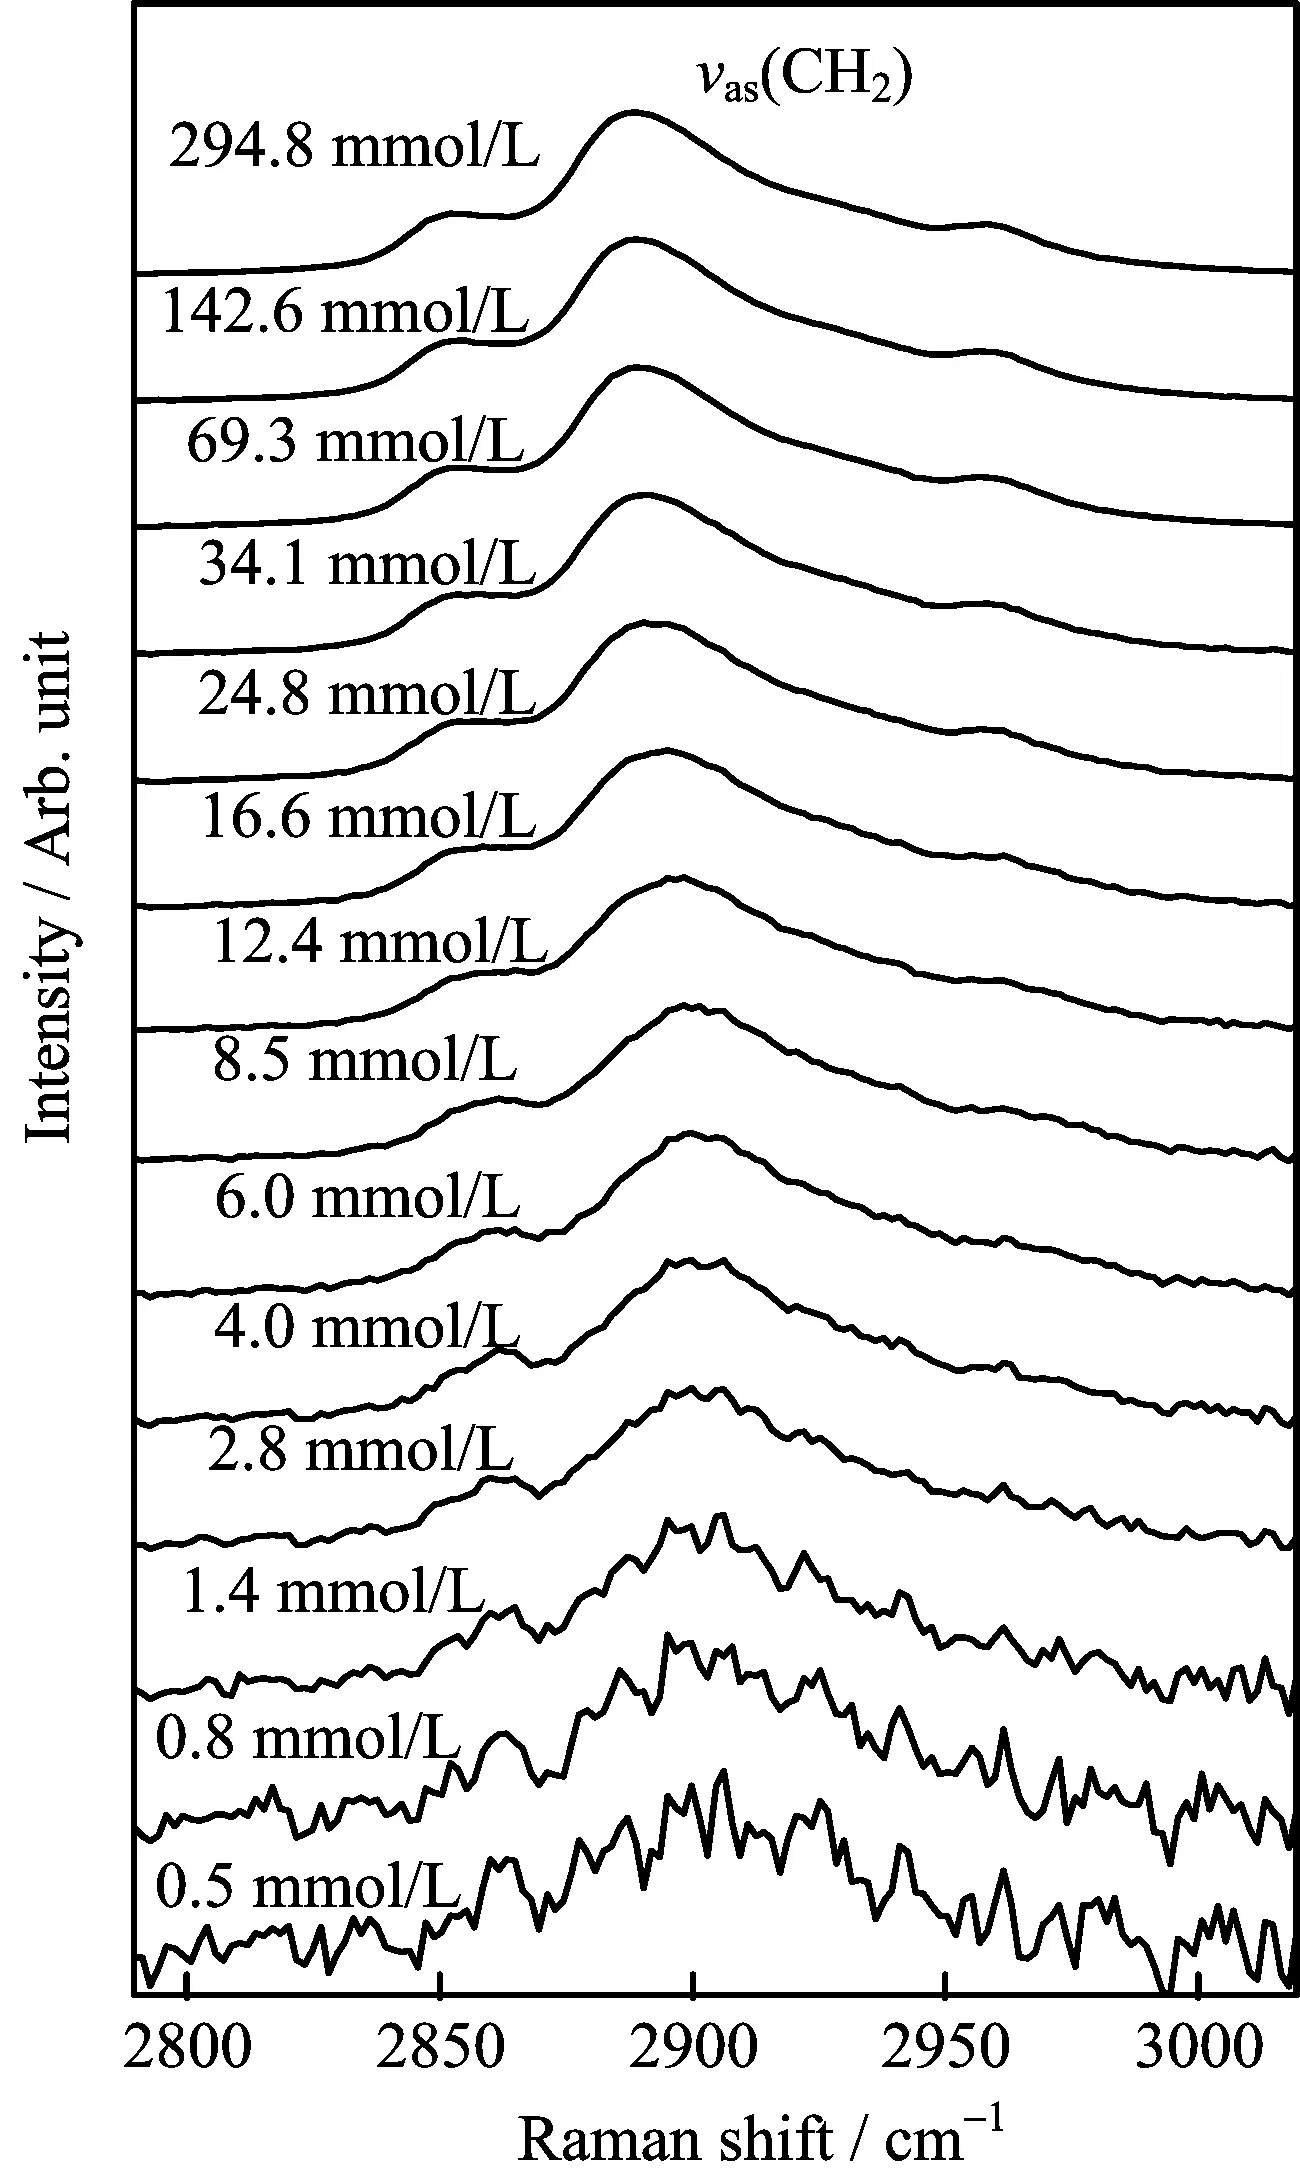
FIG.3 Vertical polarized Raman spectra in the C−H stretching region of aqueous SDS solutions,the concentrations of SDS in water solutions solutions are from 0.5 mmol/L to 294.8 mmol/L.
FIG.4 shows the concentration dependent peak position of νas(CH2)in aqueous SDS solutions.We found that the peak positions could be divided into three regions with increasing SDS concentration.For concentrations less than 8.5 mmol/L,the position of νas(CH2) did not change and remained at~2899 cm−1.This indicated that the conformation and environment of the alkyl chains did not change.In this range,SDS was in the form of monomer,which was consistent with the results of previous studies[16]. The SDS monomer was encapsulated by water molecules,and in order to reduce the contact surface of the SDS hydrophobic alkyl chains with water,the conformation of SDS alkyl chains was random.When the concentration of SDS was more than 8.5 mmol/L,the peak position of νas(CH2)showed a strong red shift,indicating drastic changes in the conformation and environment of SDS alkyl chains.It meaned that 8.5 mmol/L was the FCMC of the SDS aqueous solution.At this concentration,the alkyl chains start to aggregate,which is driven by hydrophobic attractive forces,and the SDS molecules began to form spherical micelles.Our FCMC value was consistent with the results obtained by light scattering[40]and ultraviolet-visible(UV-Vis)absorption measurements[17].Previous studies have shown that the conformation of the SDS alkyl chains changeto all trans conformation and become orderly under this condition[16,41].When the SDS alkyl chains changed to all trans conformation,the hydrophobic interaction of the alkyl-alkyl groups can be enhanced,making the spherical micelles more stable.When the concentration of SDS was more than~69 mmol/L,the peak position of νas(CH2)showed a weak red shift.Previous studies have shown that this concentration(69 mmol/L)was the SCMC[19,22,40].At the higher concentration, the SDS in solution gradually transformed from spherical micelles to rod-like micelles[4].The further red shift of the νas(CH2)indicated that the interaction between SDS alkyl groups was further enhanced.Due to the more and more short distance between the SDS alkyl chains,the alkyl chains were more likely to exist in the all-trans conformation.
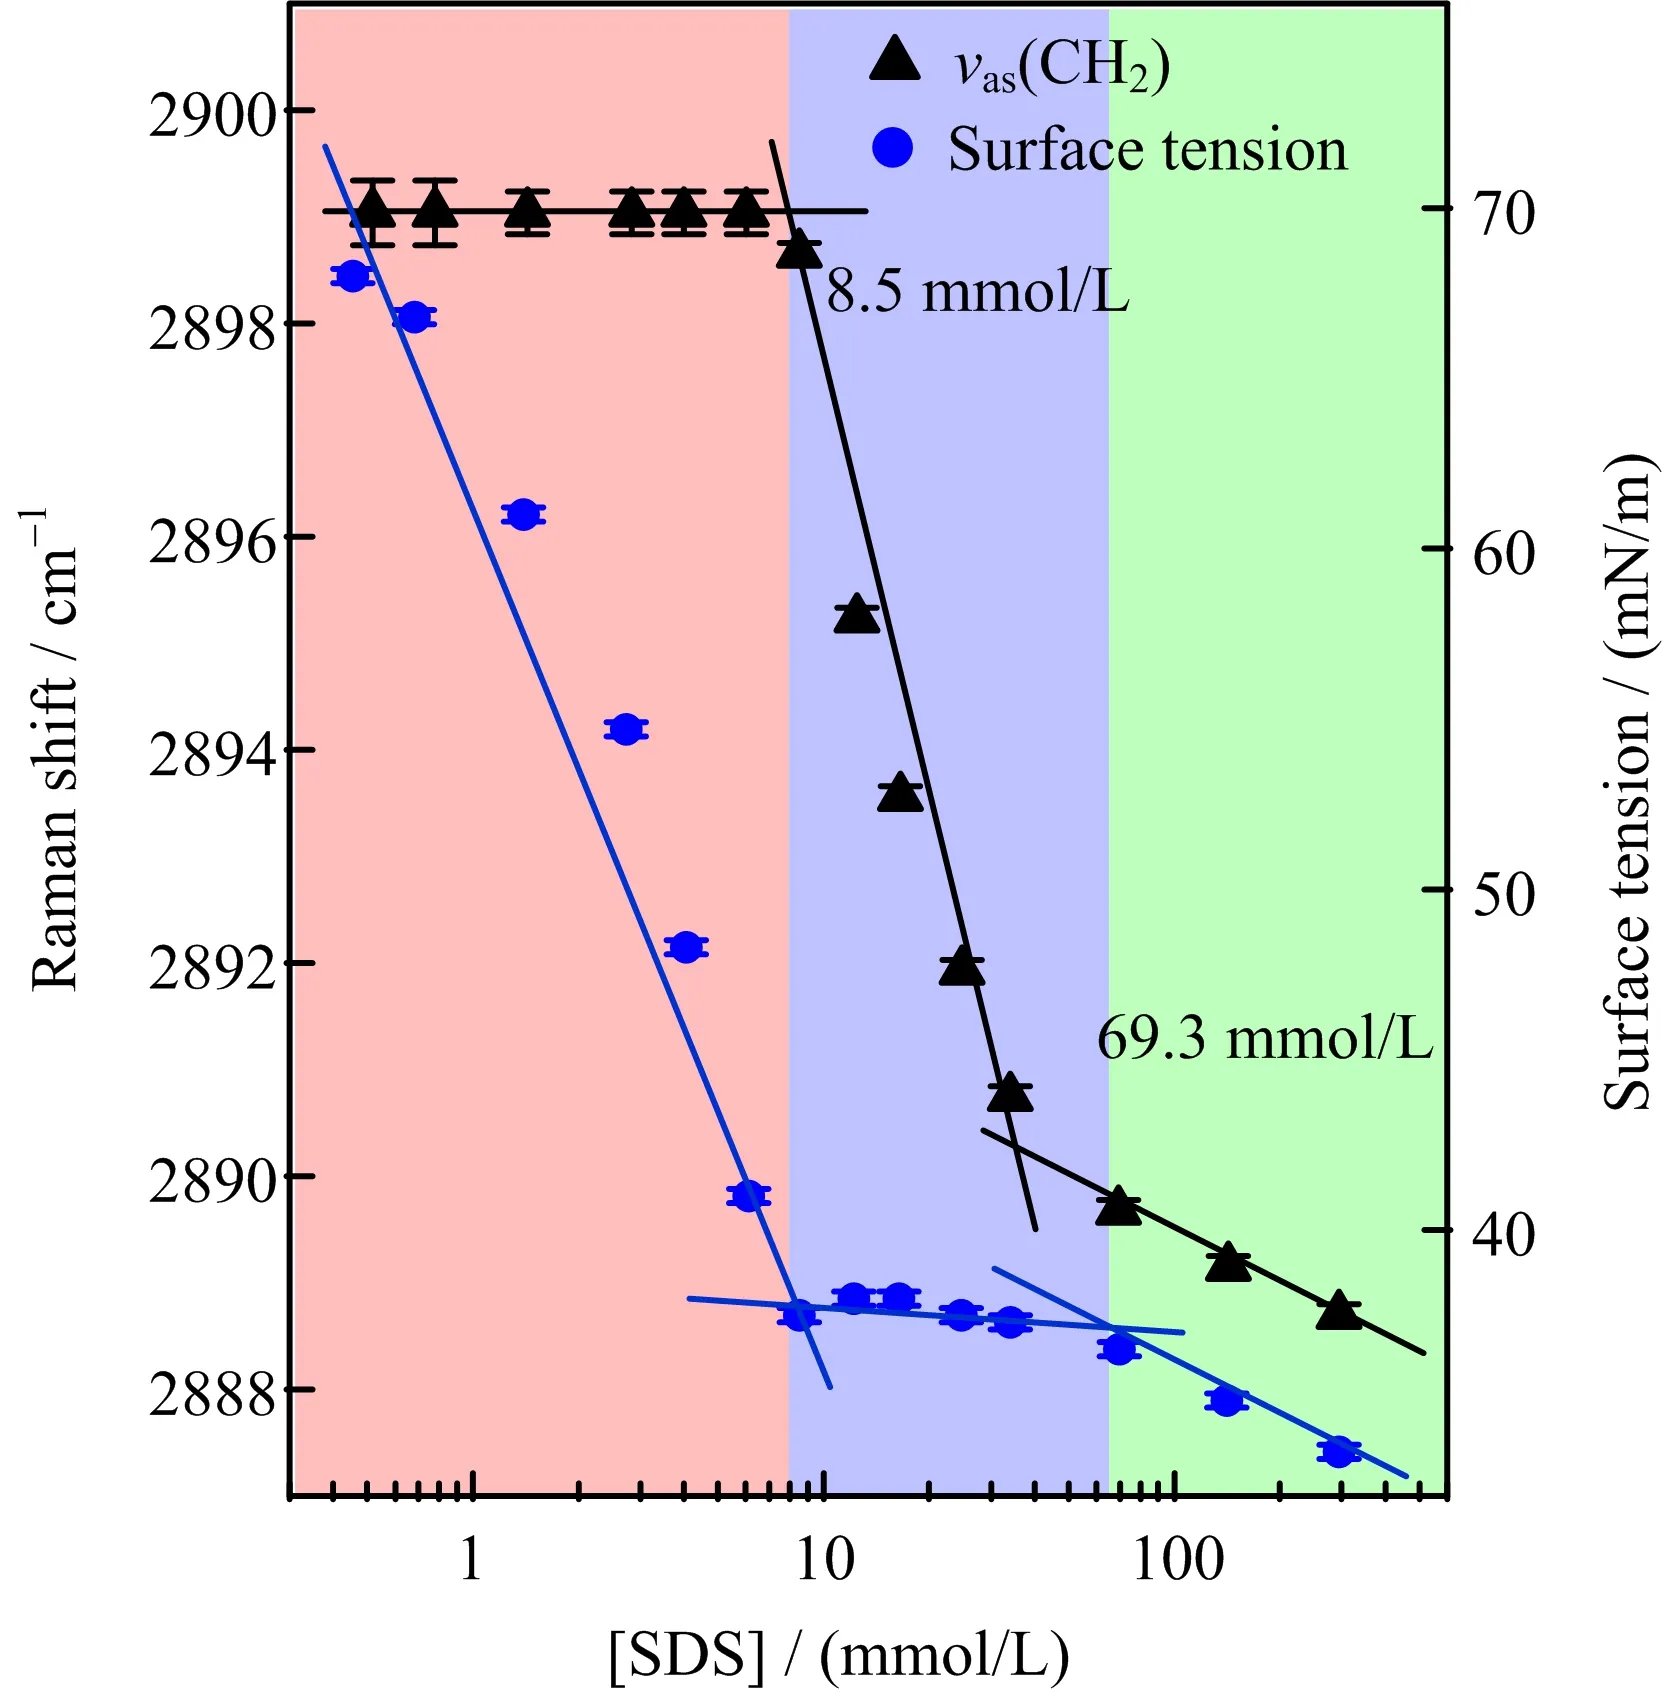
FIG.4 Concentration dependent Raman shifts of νas(CH2) (triangle)and the surface tension(dot)of SDS/H2O solutions,error bars for Raman shifts represent fitting errors of the Raman band,error bars for surface tension are systematical error.
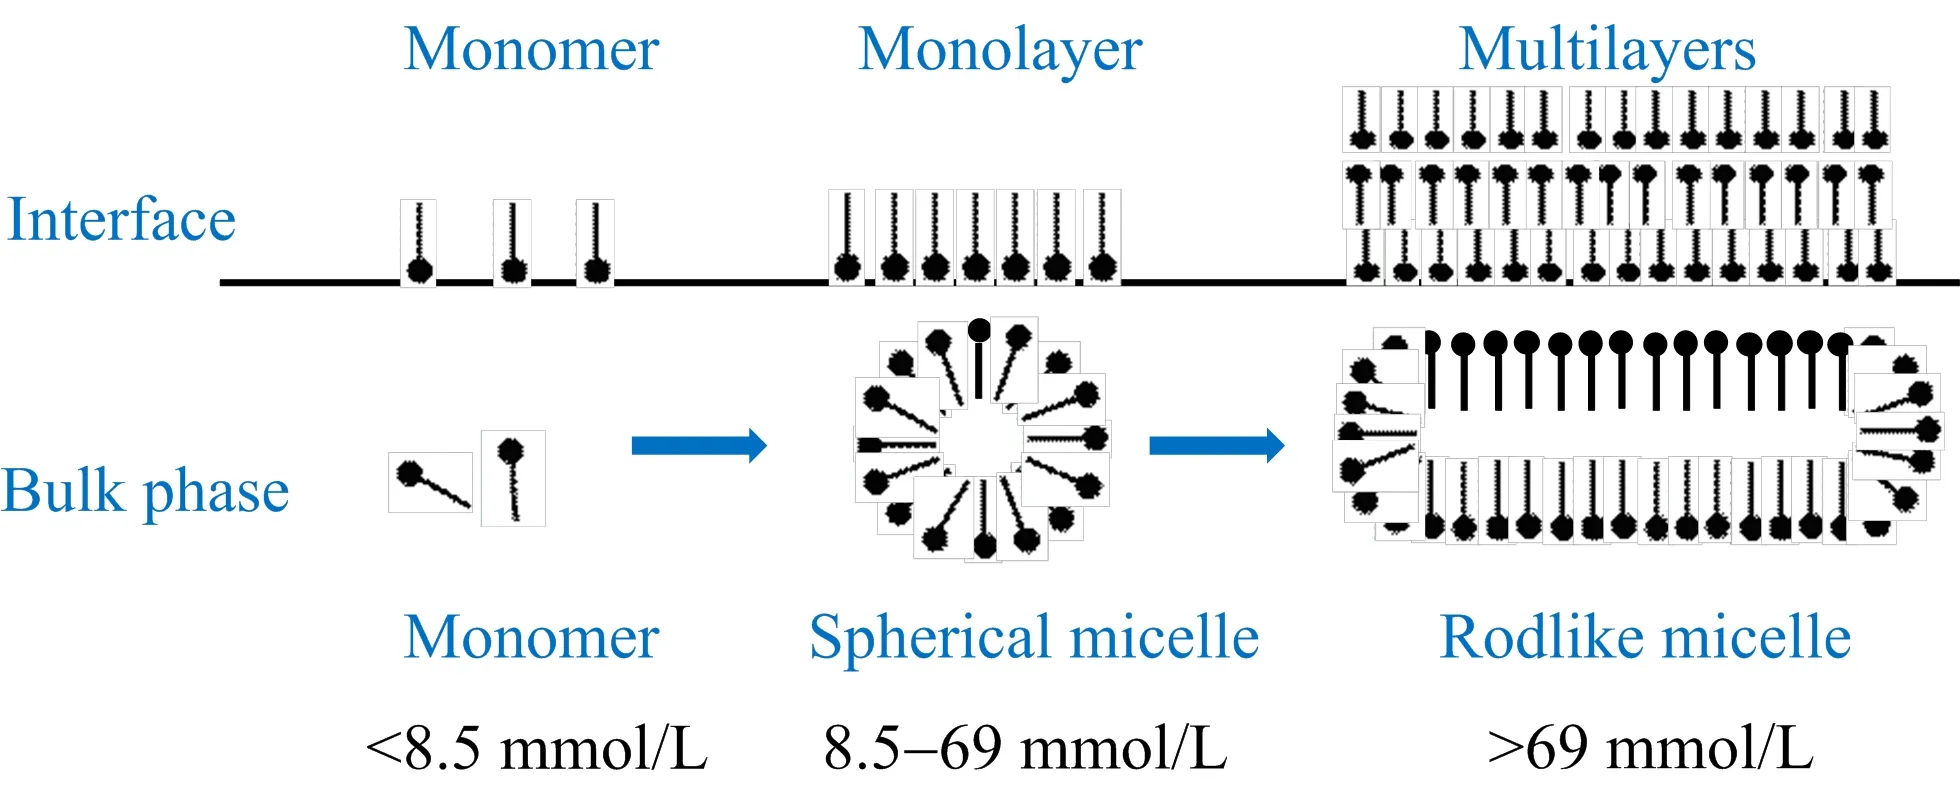
FIG.5 The complete process of SDS micelle formation in bulk phase and at interface.
In addition to Raman spectra,we also measured the surface tension of aqueous SDS solution at different concentrations.The results are shown in FIG.4.Similar to the changes of the peak position of νas(CH2) with increasing SDS concentration,the surface tension is divided into three identical regions.When the SDS concentration was less than~8.5 mmol/L,the surface tension decreased signi ficantly.When the concentration was in the range of 8.5 mmol/L to 69 mmol/L, the surface tension remained essentially unchanged.At concentrations higher than~69.3 mmol/L,the surface tension continued to decrease,but the rate of decrease was slower than that of the first stage.These two concentrations,~8.5 and~69 mmol/L,corresponded to the FCMC and SCMC of aqueous SDS solution,respectively.These two values were consistent with values obtained from the Raman spectra,indicating that self-assembly of SDS occurred synergistically in the solution and at the interface.Comparing surface tension data and the Raman spectra data,the self-assembly process of SDS in aqueous solution and at the interface can be better understood(FIG.5).When the SDS concentration was less than 8.5 mmol/L,the number of SDS molecules increased at the interface and in the solution with increasing concentration.The increase of SDS molecules at the interface led to a decrease in surface tension[42].Although the number of SDS molecules in solution increased,SDS remained in the form of monomer,and thus,the peak position of asymmetric C−H2stretching vibration did not change.When the concentration reached~8.5 mmol/L, the number of SDS molecules at the interface was saturated,forming an SDS monolayer[5,16].Furthermore,the SDS monomer molecules in solution were also saturated.When the concentration was more than~8.5 mmol/L,SDS molecules were self-assembled into spherical micelles in the solutions,which led to a red shift of νas(CH2).The additional SDS molecules were all self-assembled in solution and no longer gathered on the surface,thus the surface tension remained stable.When the concentration reached~69.3 mmol/L, the spherical micelles also reached saturation.As the concentration increased,SDS molecules aggregated at the interface into a multilayer film,causing the surface tension to decrease.Previous molecular dynamics simulations have shown that at higher SDS surface densities,multilayers can be formed at the solution surface [43].At this stage,SDS spherical micelles in the solution transformed into rod-like micelles,which led to a further red shift of the peak position of νas(CH2).
D.Self-assembly of SDS in NaCl/H2O solution
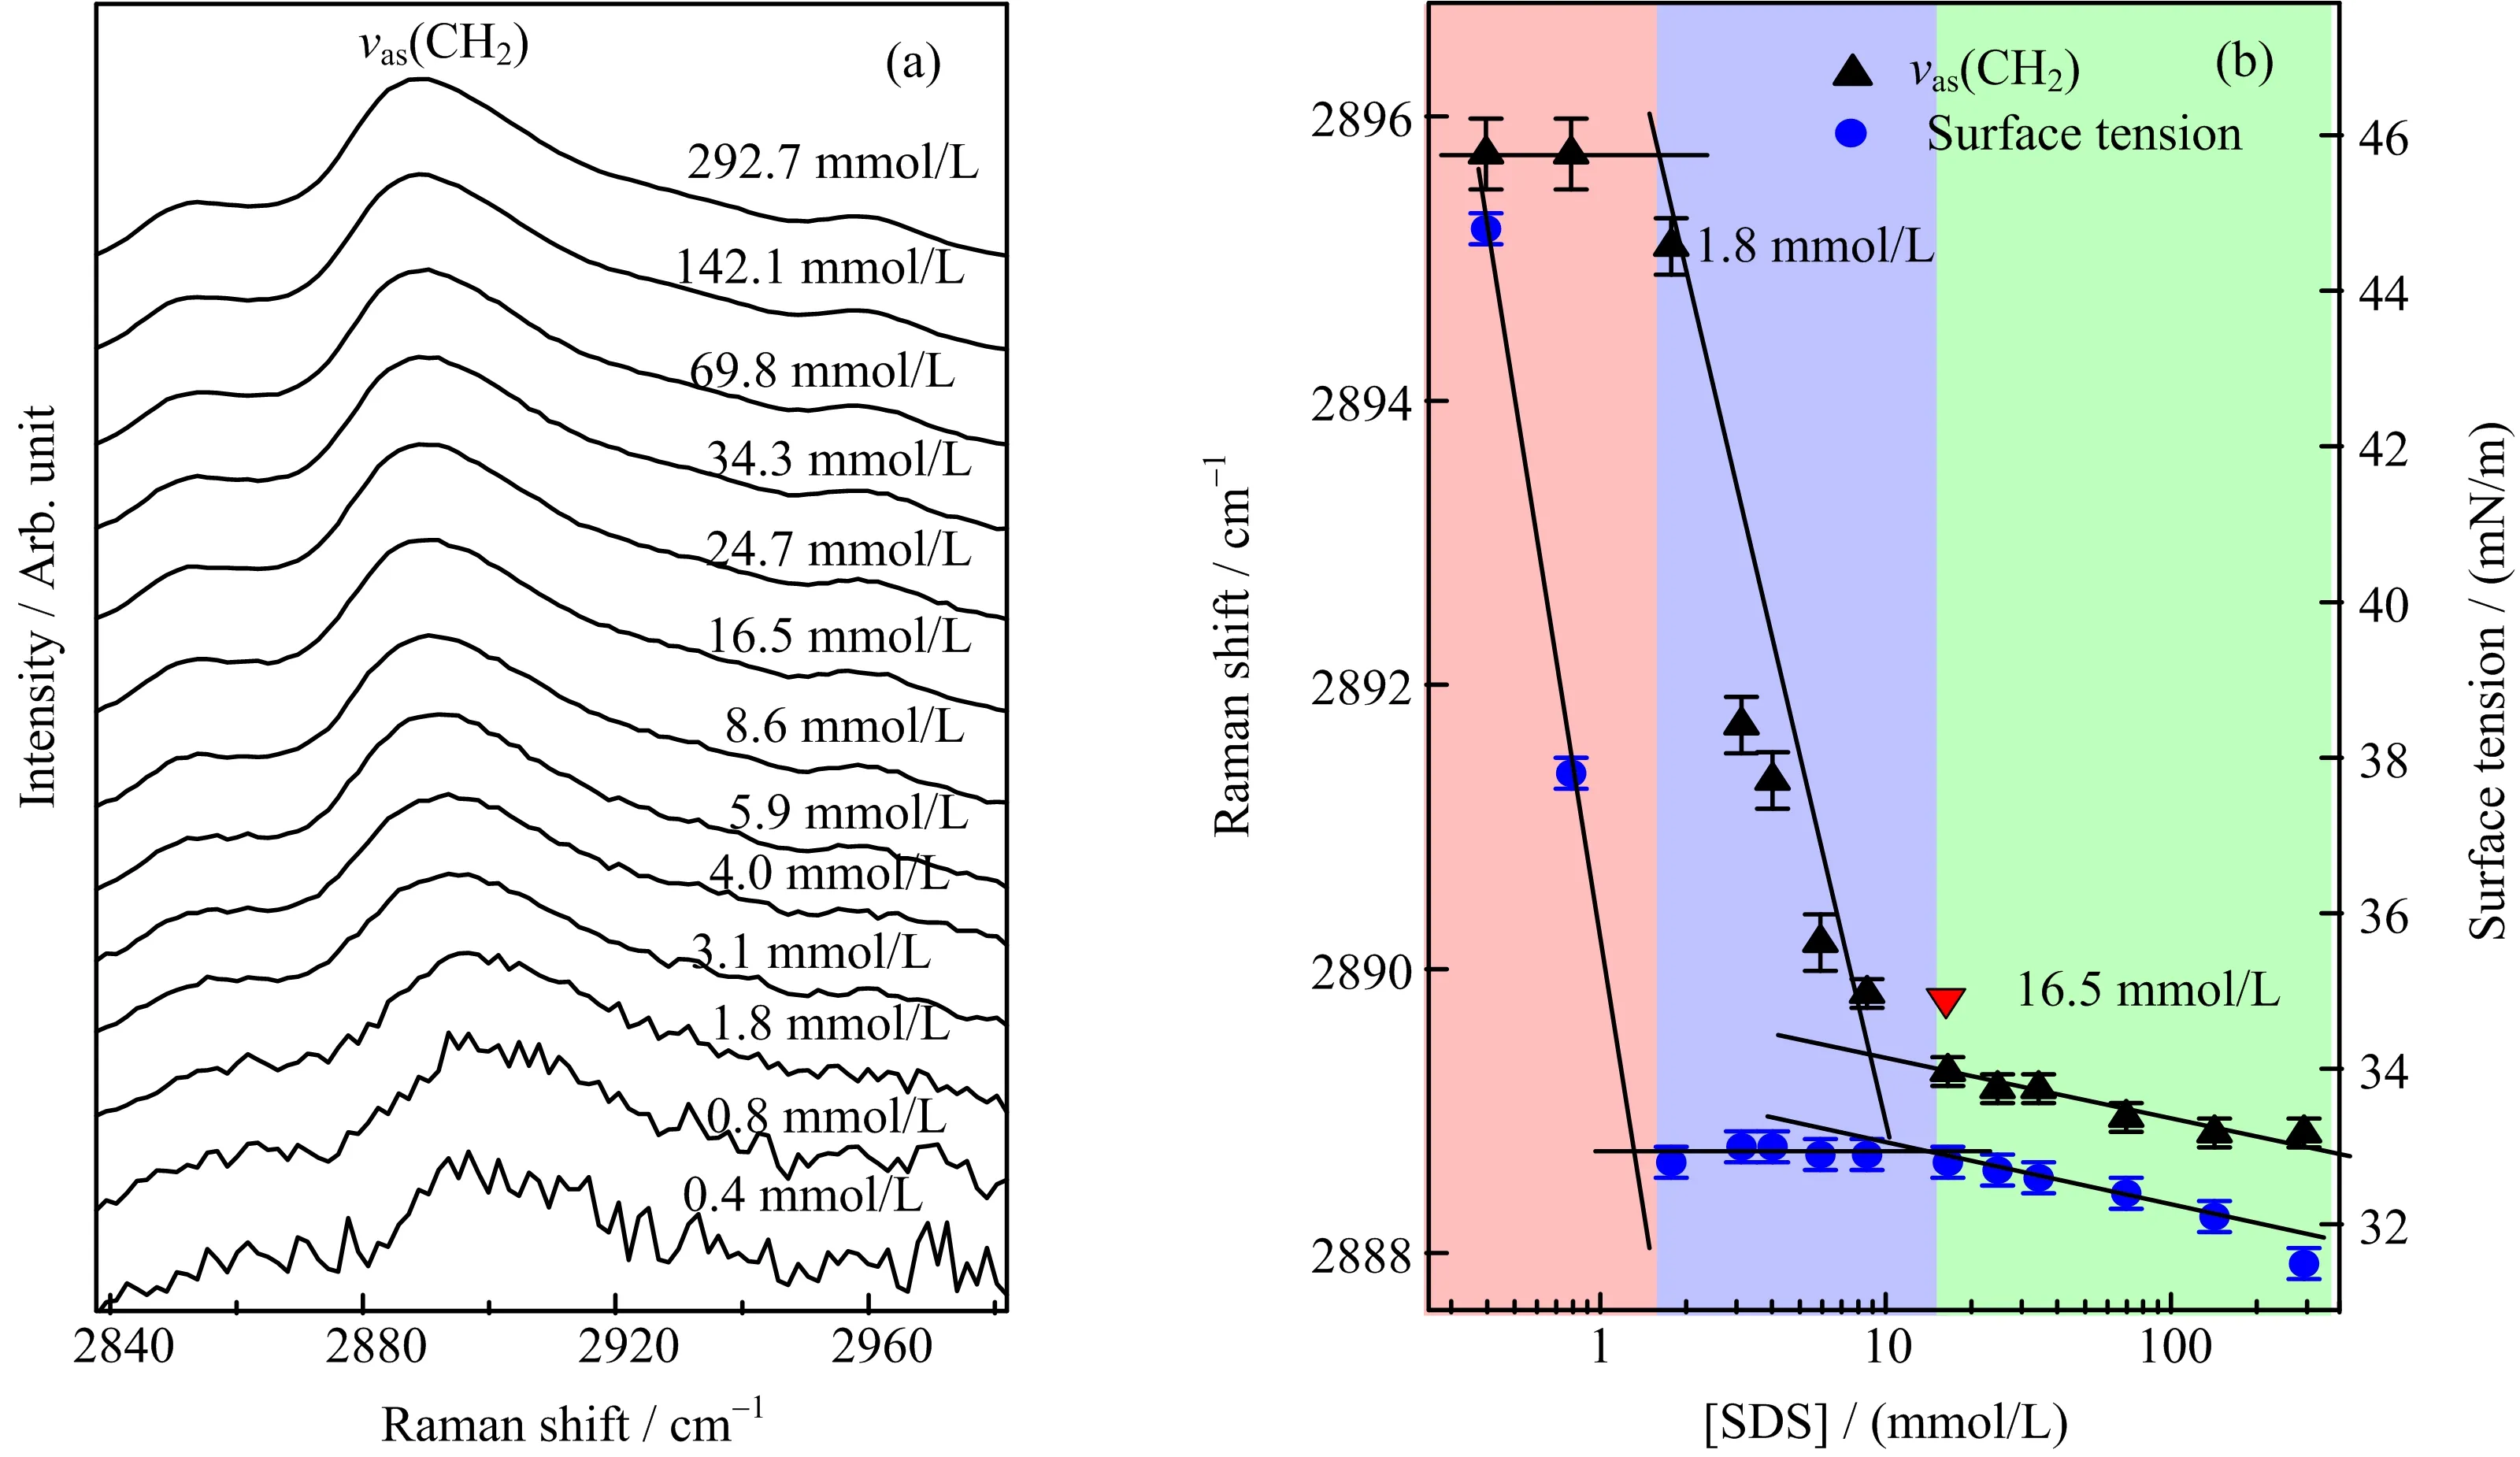
FIG.6(a)Vertical polarized Raman spectra of SDS in aqueous NaCl solutions in the C−H stretching region.(b)Concentration dependent Raman shifts of νas(CH2)(triangle)and the surface tension(dot)of SDS/(NaCl/H2O)solutions. The concentration of NaCl/H2O solutions is 100 mmol/L.The concentrations of SDS/(NaCl/H2O)solutions are from 0.39 mmol/L to 292.74 mmol/L.Error bars for Raman shifts represent fitting errors of the Raman band,error bars for surface tension are systematical error.
Usually,the salt ions were added into the solution to control the molecular self-assembly.For example,salt has a signi ficant effect on the aggregation of long-chain alkanes[44–50]. Conductivity,light scattering and other methods have suggested that the presence of ions can reduce the CMC[51–53].Here,vertically polarized Raman spectra were used to analyze the self-assembly of SDS in aqueous NaCl solution.FIG.6(a)shows the vertically polarized spectra of SDS in 100 mmol/L aqueous NaCl solution of different concentrations in the CH stretching region.The relationship between the peak position of νas(CH2)with the concentration of SDS in NaCl solution was presented in FIG.6(b).It can be seen that the change of the peak position with increasing SDS concentration could be divided into three regions. When the concentration was less than~1.8 mmol/L, the peak position of νas(CH2)did not change and was located at~2896 cm−1.When the concentration of SDS was higher than~1.8 mmol/L,a red shift was observed. The FCMC of SDS in NaCl/H2O solution was determined to be~1.8 mmol/L,where SDS began to form spherical micelles,which was driven by the hydrophobic interaction of alkyl-alkyl interactions[54].When the concentration of SDS was higher than~16.5 mmol/L,a continuous red shift of νas(CH2)was observed,but the magnitude of the shift decreased.The SCMC was determined to be~16.5 mmol/L,where the spherical micelles began to transform into rod-like micelles[4,6,54]. The surface tension of this solution was also measured, and the data are shown in FIG.6(b).It can be seen that the surface tension across the entire concentration range could also be divided into three identical regions with increasing SDS concentration.When the SDS concentration was lower than~1.8 mmol/L,the surface tension decreased signi ficantly.When the SDS concentration was in the range of 1.8 mmol/L to 16.5 mmol/L, the surface tension remained essentially unchanged.At concentrations higher than 16.5 mmol/L,the surface tension continued to decrease,but the rate of decrease was lower than that of the first stage. These two values were consistent with the CMC values obtained from the Raman spectra,indicating that self-assembly of SDS occurred synergistically in the solution and at the interface.When the concentration was lower than~1.8 mmol/L,the SDS molecules gradually aggregated at the interface.At a concentration of 1.8 mmol/L,the SDS molecules formed a single molecular layer at the surface.When the SDS concentration was in the range of 1.8 mmol/L to 16.5 mmol/L,the SDS molecules did not aggregate at the interface,instead,the aggregation occurred in the bulk phase to form spherical micelles.When the SDS concentration was higher than 16.5 mmol/L,SDS molecules further aggregated at the interface to form a multilayer film and formed rod-like micelles in the bulk phase.The SDS self-assembly process at the SDS/(NaCl/H2O)solution surface and in the bulk solution was consistent with that in SDS/H2O,but the corresponding FCMC and SCMC values were lower. This was due to the attraction between SD−anions and the large amounts of Na+cations.The attraction reduced the repulsion between the adjacent SD−anions, which promoted the self-assembly of SDS and reduced the CMC value.
E.Effect of salt ions on the self-assembly process of SDS
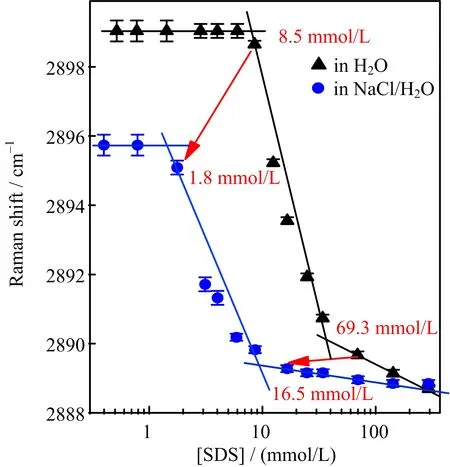
FIG.7 Concentration dependent Raman shifts of νas(CH2) of SDS/H2O solutions(triangle)and SDS/(NaCl/H2O)solutions(dot),error bars for surface tension are systematical error.
In FIG.7,the Raman shifts of νas(CH2)at various concentrations in pure water and aqueous NaCl solutions were compared.It is worth noting that a signi ficant difference was observed between the peak positions of νas(CH2)when there no micelles were formed.When the concentration was lower than the FCMC value,the position of the peak position of νas(CH2)in water was at~2898.6 cm−1,while that in the NaCl solution shifted to~2895.1 cm−1.In this concentration region,only the SDS monomer existed in solution.Hence then, the difference between the Raman shifts of νas(CH2) demonstrated the interactions between Cl−and water molecules[34]changed the water environment around the alkyl groups,meanwhile the interaction between Na+and the sulfate anion of SDS affected the conformation of the alkyl chain.These factors led to the red shift of the peak position of νas(CH2)in the salt solution. However,with the formation of micelles,the difference in the peak position of νas(CH2)in different solutions decreased,indicating that the in fluence of salt ions gradually became weak along with SDS alkyl groups aggregating.When the SCMC was achieved,the peak position of νas(CH2)of SDS in pure water and aqueous NaCl were located at~2889.7 and~2889.4 cm−1, respectively,and the difference in Raman shift almost disappeared.When the SDS transformed from spherical to rod-like micelles,the hydrophobic cores of the micelles became extremely tight and the hydrophobic interaction between alkyl groups was dominant.Therefore,salt ions have almost no effect on the νas(CH2).
IV.CONCLUSION
Our results demonstrate the vertically polarized Raman spectra could suppress the OH stretching band of water in aqueous SDS solution,simplify the C−H stretching band of SDS,and improve the detection sensitivity of the spectra in C−H stretching region. The CMC values of SDS in water and NaCl/H2O solutions were obtained using vertically polarized Raman spectra,and the results were consistent with surface tension measurements and literature values.The FCMC and the SCMC of SDS in water were 8.5 and 69.3 mmol/L,respectively.In 100 mmol/L concentration of NaCl/H2O solution,the FCMC and the SCMC were decreased to 1.8 and 16.5 mmol/L,respectively. Additionally,the self-assembly process of SDS in bulk phase and at interface was discussed.What’s more, through comparing the spectra of SDS in water and in NaCl solutions,the interactions among the salt ions, SDS molecules and water molecules during the selfassembly process of SDS were discussed.
V.ACKNOWLEDGMENTS
This work is supported by the National Natural Science Foundation of China(No.21473171 and No.21573208),the Fundamental Research Funds for the Central Universities(No.JB160508),and the Huashan Mountain Scholar Program.
[1]R.B.Viana,A.B.da Silva,and A.S.Pimentel,Adv. Phys.Chem.2012,1(2012).
[2]G.Cazzolli,S.Caponi,A.Defant,C.Gambi,S. Marchetti,M.Mattarelli,M.Montagna,B.Rossi,F. Rossi,and G.Viliani,J.Raman Spectrosc.43,1877 (2012).
[3]L.Lanzi,M.Carl`a,L.Lanzi,and C.M.Gambi,J. Colloid Interface Sci.330,156(2009).
[4]S.May and A.Ben-Shaul,J.Phys.Chem.B 105,630 (2001).
[5]T.Kawai,H.Kamio,and K.Kon-No,Langmuir 14, 4964(1998).
[6]S.Ikeda,S.Hayashi,and T.Imae,J.Phys.Chem.85, 106(1981).
[7]X.Tang,P.H.Koenig,and R.G.Larson,J.Phys. Chem.B 118,3864(2014).
[8]M.Pal,R.Rai,A.Yadav,R.Khanna,G.A.Baker,and S.Pandey,Langmuir 30,13191(2014).
[9]M.J.Rosen and S.Aronson,Colloids Surf.3,201 (1981).
[10]P.Ekwall,L.Mandell,and P.Solyom,J.Colloid Interface Sci.35,519(1971).
[11]B.Hammouda,J.Res.Natl.Inst.Stand.Technol 118, 151(2013).
[12]¨O.Topel,B.A.C¸akır,L.Budama,and N.Hoda,J. Mol.Liq.177,40(2013).
[13]F.Reiss-Husson and V.Luzzati,J.Phys.Chem.68, 3504(1964).
[14]C.Th´evenot,B.Grassl,G.Bastiat,and W.Binana, Colloids Surf.A 252,105(2005).
[15]C.M.Johnson and E.Tyrode,Phys.Chem.Chem. Phys.7,2635(2005).
[16]T.Kawai,H.Kamio,T.Kondo,and K.Kon-No,J. Phys.Chem.B 109,4497(2005).
[17]A.Beyaz,W.S.Oh,and V.P.Reddy,Colloids Surf.B 35,119(2004).
[18]J.Newbery,Colloid Polym.Sci.257,773(1979).
[19]Y.Shi,H.Q.Luo,and N.B.Li,Spectrochim.Acta, Part A 78,1403(2011).
[20]K.Chen,G.Cao,Z.Huang,F.Zhao,M.Liu,and Y. Chen,Tenside Surfact Det.52,280(2015).
[21]L.M.Bergstr¨om,Curr.Opin.Colloid Interface Sci.22, 46(2016).
[22]J.S.Kim,C.K.Kim,P.S.Song,and K.M.Lee,J. Colloid Interface Sci.80,294(1981).
[23]M.Picquart,J.Phys.Chem.90,243(1986).
[24]Y.Q.Yu,Y.X.Wang,N.Y.Hu,K.Lin,X.G.Zhou, and S.L.Liu,J.Raman Spectrosc.45,259(2014).
[25]Y.Q.Yu,Y.X.Wang,N.Y.Hu,K.Lin,X.G.Zhou, and S.L.Liu,Phys.Chem.Chem.Phys.18,10563 (2016).
[26]Y.Q.Yu,Y.X.Wang,K.Lin,X.G.Zhou,S.L.Liu, and J.Sun,J.Raman Spectrosc.47,1385(2016).
[27]K.Lin,N.Y.Hu,X.G.Zhou,S.L.Liu,and Y.Luo, J.Raman Spectrosc.43,82(2012).
[28]L.Chen,W.D.Zhu,K.Lin,N.Y.Hu,Y.Q.Yu,X. G.Zhou,L.F.Yuan,S.M.Hu,Y.Luo,and S.L.Liu, J.Phys.Chem.A 119,3209(2015).
[29]R.Sperline,Y.Song,and H.Freiser,Langmuir 13,3727 (1997).
[30]A.Paschoal,A.Ayala,R.Pinto,C.Paschoal,and A. Tanaka,J.Boaventura Filho,and N.Jose,J.Raman Spectrosc.42,1601(2011).
[31]K.Lin,X.G.Zhou,Y.Luo,and S.L.Liu,J.Phys. Chem.B 114,3567(2010).
[32]C.C.Wang,K.Lin,N.Y.Hu,X.G.Zhou,and S.L. Liu,Acta Phys.Chim.Sin.28,1823(2012).
[33]C.Q.Tang,K.Lin,X.G.Zhou,and S.L.Liu,Chin. J.Chem.Phys.29,129(2016).
[34]Y.X.Wang,W.D.Zhu,K.Lin,L.F.Yuan,X.G.Zhou, and S.L.Liu,J.Raman Spectrosc.47,1231(2016).
[35]X.C.Yu,K.Lin,N.Y.Hu,X.G.Zhou,and S.L.Liu, Acta Phys.Chim.Sin 26,2473(2010).
[36]C.Q.Tang,K.Lin,X.G.Zhou,and S.L.Liu,Chin. J.Chem.Phys.1,129(2016).
[37]K.Lin,X.G.Zhou,S.L.Liu,and Y.Luo,Chin.J. Chem.Phys.25,121(2013).
[38]T.Kawai,J.Umemura,and T.Takenaka,Colloid Polym.Sci.262,61(1984).
[39]J.H.Campbell,J.Fisher,and J.Jonas,J.Chem.Phys. 61,346(1974).
[40]M.Kodama,Y.Kubota,and M.Miura,Bull.Chem. Soc.Jpn.45,2953(1972).
[41]T.Kawai,J.Umemura,and T.Takenaka,Colloid Polym.Sci.262,61(1984).
[42]X.Y.Hua and M.J.Rosen,J.Colloid Interface Sci. 124,652(1988).
[43]S.Baoukina,L.Monticelli,H.J.Risselada,S.J.Marrink,and D.P.Tieleman,Proc.Natl.Acad.Sci.105, 10803(2008).
[44]O.R.Howell and H.Robinson,Proc.R.Soc.London, Ser.A 155,386(1936).
[45]K.A.Wright,A.D.Abbott,V.Sivertz,and H.Tartar, J.Am.Chem.Soc.61,549(1939).
[46]N.A.Mazer,G.B.Benedek,and M.C.Carey,J.Phys. Chem 80,1075(1976).
[47]K.Maiti,D.Mitra,S.Guha,and S.P.Moulik,J.Mol. Liq.146,44(2009).
[48]M.Ropers,G.Czichocki,and G.Brezesinski,J.Phys. Chem.B 107,5281(2003).
[49]F.Wei,H.C.Li,and S.J.Ye,J.Phys.Chem.C 117, 26190(2013).
[50]F.Wei,S.J.Ye,H.C.Li,and Y.Luo,J.Phys.Chem. C 117,11095(2013).
[51]K.D.Danov,P.A.Kralchevsky,and K.P.Ananthapadmanabhan,Adv.Colloid Interface Sci.206,17(2014). [52]H.Lange,Kolloid Z.121,66(1951).
[53]B.Naskar,A.Dey,and S.P.Moulik,J.Surfactants. Deterg.16,785(2013).
[54]S.Hayashi and S.Ikeda,J.Phys.Chem.84,744(1980).
ceived on April 26,2017;Accepted on May 31,2017)
∗Authors to whom correspondence should be addressed.E-mail: klin@xidian.edu.cn,slliu@ustc.edu.cn
杂志排行
CHINESE JOURNAL OF CHEMICAL PHYSICS的其它文章
- γ-Ray Irradiation-Derived MnO/rGO Composites for High Performance Lithium Ion Batteries
- Identi fication of Superoxide O2−during Thermal Decomposition of Molten KNO3-NaNO2-NaNO3Salt by Electron Paramagnetic Resonance and UV-Vis Absorption Spectroscopy
- Binding Mechanism and Molecular Design of Benzimidazole/Benzothiazole Derivatives as Potent Abl T315I Mutant Inhibitors
- Highly Responsive and Selective Ethanol Gas Sensor Based on Co3O4-Modi fied SnO2Nano fibers
- Geometric Design of Anode-Supported Micro-Tubular Solid Oxide Fuel Cells by Multiphysics Simulations
- Laser-Assisted Stark Deceleration of Polar Molecules HC2n+1N(n=2,3,4) in High-Field-Seeking State
