剪切波超声弹性成像定量评估腓肠肌和比目鱼肌硬度的初步研究
2017-08-07WENJing
文 晶 WEN Jing
王月香 WANG Yuexiang
罗渝昆 LUO Yukun
张 颖 ZHANG Ying
杨 明 YANG Ming
剪切波超声弹性成像定量评估腓肠肌和比目鱼肌硬度的初步研究
文 晶 WEN Jing
王月香 WANG Yuexiang
罗渝昆 LUO Yukun
张 颖 ZHANG Ying
杨 明 YANG Ming
目的 探讨超声切面、患者体位等对肌肉杨氏模量和剪切波速度测值的影响,及杨氏模量与剪切波速度反映肌肉硬度的一致性。资料与方法 应用剪切波超声弹性成像技术对健康青年男女各10例进行检测,于踝关节自然位、最大跖屈位、最大背屈位下分别纵切和横切检测腓肠肌和比目鱼肌的杨氏模量和剪切波速度。结果①腓肠肌和比目鱼肌弹性测值比较:纵切下最大跖屈位杨氏模量、最大背屈位杨氏模量和剪切波速度差异有统计学意义(P<0.05),腓肠肌测值高于比目鱼肌测值;横切下自然位和最大背屈位杨氏模量及剪切波速度差异有统计学意义(P<0.05),比目鱼肌测值高于腓肠肌测值。②腓肠肌或比目鱼肌在踝关节各体位下纵切和横切的弹性测值差异有统计学意义(P<0.01),且纵切测值高于横切。③腓肠肌或比目鱼肌不同踝关节体位弹性测值比较:纵切下自然位和最大跖屈位分别与最大背屈位差异有统计学意义(P<0.01),最大背屈位测值较高;横切下仅比目鱼肌自然位和最大跖屈位分别与最大背屈位弹性测值差异有统计学意义(P<0.01),最大背屈位测值较高。结论 腓肠肌、比目鱼肌超声弹性测值的大小与超声纵切或横切、踝关节体位有关,且两肌肉间的弹性测值也存在一定差异,在应用剪切波超声弹性成像定量评估肌肉硬度时应给予考虑。
肌,骨骼;超声检查;弹性成像技术
肌肉硬度的改变是某些神经肌肉疾病重要的病理特征之一[1-2]。因此,定量检测肌肉的硬度变化对评估肌肉功能状态具有重要的临床意义。剪切波超声弹性成像(shear wave ultrasound elastography,SWUE)是新近发展的能定量评价组织硬度的新技术,目前已开始应用于甲状腺、乳腺、肝脏、前列腺、泌尿生殖系统及淋巴结等疾病的相关研究[3]。初步研究结果显示其在良恶性肿瘤的鉴别上具有潜在的临床应用价值。应用SWUE检测四肢肌肉硬度目前已有初步报道[4]。但由于四肢肌肉具有收缩性、各向异性等特点,因此其弹性测值可受到多种因素的影响。如何在临床中正确应用SWUE定量评估肌肉硬度仍需进一步研究。
本研究拟应用SWUE检测正常受试者在不同超声切面、不同体位下小腿腓肠肌和比目鱼肌的弹性测值,并探讨体重指数(body mass index,BMI)、感兴趣区(ROI)肌肉厚度等因素对肌肉弹性测值的影响,为该技术在评估四肢肌肉的硬度方面提供有价值的参考。
1 资料与方法
1.1 研究对象 收集2016年6-12月解放军总医院超声诊断科门诊的健康青年志愿者20例,男10例,年龄20~32岁,平均(28.0±4.4)岁;身高170~190 cm,平均(176.4±5.9)cm;体重60~100 kg,平均(77.4±11.1)kg。女10例,年龄24~27岁,平均(25.5±1.3)岁;身高158~172 cm,平均(165.6±4.8)cm;体重46~77 kg,平均(56.5±10.0)kg。本研究经医院伦理委员会审核批注,所有志愿者均签署知情同意书。纳入标准:无下肢畸形及外伤手术史;无肌纤维炎、重症肌无力、进行性肌营养不良等各类肌肉病史;无神经系统类疾病史;无系统性、代谢性、内分泌等疾病史,包括但不限于高血压、糖尿病、痛风、强直性脊柱炎、甲状腺功能亢进症、甲状腺功能低下等;无家族遗传病史。
1.2 仪器与方法 SWUE检测采用声科影像公司(SuperSonic Imagine)的Aixplorer声蓝超声系统,所有图像采集和弹性成像检测使用SuperlineTM10-2探头,选择常规模式。
所有志愿者均采取俯卧位,在踝部自然位(图1A)、最大跖屈位(图1B)、最大背屈位(图1C)3个体位下[5],分别在纵切面和横切面下对腓肠肌和比目鱼肌内侧近中段进行弹性检测,测量时局部涂较厚耦合剂,注意勿加压,室温保持在平均(24.8±1.1)℃以减少温度对肌肉组织弹性的影响[6]。纵切面测量时,应使探头平行于肌肉长轴,切面内可显示肌纤维走行长轴;横切面测量时,应使探头垂直于肌肉的长轴,切面内可显示肌间隔或肌纤维的短轴,呈线状或点状高回声,并避免肌肉的各向异性伪像。首先显示ROI灰阶图像,测量ROI纵切面下腓肠肌厚度,然后切换至SWUE模式待弹性图像稳定后冻结测值,弹性参数测量圈直径为6 mm,其距离骨表面和较厚筋膜表面至少5 mm以上[7],同时获取肌肉的杨氏模量均值(kPa)和剪切波速度均值(m/s),同一部位测量3次取平均值,且每次获取的弹性图至少间隔3 s以上[8]。SWUE取样测值见图2、3。

图1 SWUE检测体位,黑色区域为探头放置区域。A.自然位;B.最大跖屈位;C.最大背屈位
1.3 统计学方法 采用SPSS 19.0软件。符合正态分布的计量资料以x±s表示,各体位腓肠肌和比目鱼肌之间比较采用t检验,用SNK法分别进行腓肠肌和比目鱼肌在不同体位下相应SWUE测值两两比较;不符合正态分布的计量资料以M±Q表示,各体位腓肠肌和比目鱼肌之间测值以Mann-Whitney U检验进行比较分析,P<0.05表示差异有统计学意义。用Kruskal-Willis H检验分别进行腓肠肌和比目鱼肌在不同体位下相应SWUE测值两两比较,P<0.01表示差异有统计学意义。腓肠肌或比目鱼肌各弹性测值与BMI、各体位下纵切腓肠肌各弹性测值与相应RIO肌肉厚度行线性相关分析。

图3 横切腓肠肌(图中浅层肌肉)和比目鱼肌(图中深层肌肉),SWUE取样和测值图,左侧上半部分图像彩色区域为剪切波弹性图像区域及测值区域,左侧下半部分图像为灰阶图像显示同一区域;A.自然位;B.最大跖屈位;C.最大背屈位
2 结果
2.1 腓肠肌和比目鱼肌弹性测值比较 各体位下纵切和横切腓肠肌、比目鱼肌杨氏模量测值和剪切波速度测值见表1。纵切下最大跖屈位杨氏模量、最大背屈位杨氏模量和剪切波速度差异有统计学意义(P<0.05),腓肠肌测值高于比目鱼肌测值;横切下自然位和最大背屈位杨氏模量及剪切波速度差异有统计学意义(P<0.05),比目鱼肌测值高于腓肠肌测值。

表1 腓肠肌和比目鱼肌各体位下纵切、横切的杨氏模量测值及剪切波速度测值比较(x±s)
2.2 纵切与横切弹性测值比较 同一踝关节体位下,比较同一肌肉纵切和横切的杨氏模量测值及剪切波速度测值,差异均有统计学意义(P<0.01),且纵切杨氏模量和剪切波速度测值均高于横切测值,见表2。

表2 腓肠肌、比目鱼肌各体位下杨氏模量及剪切波速度纵切测值和横切测值比较(x±s)
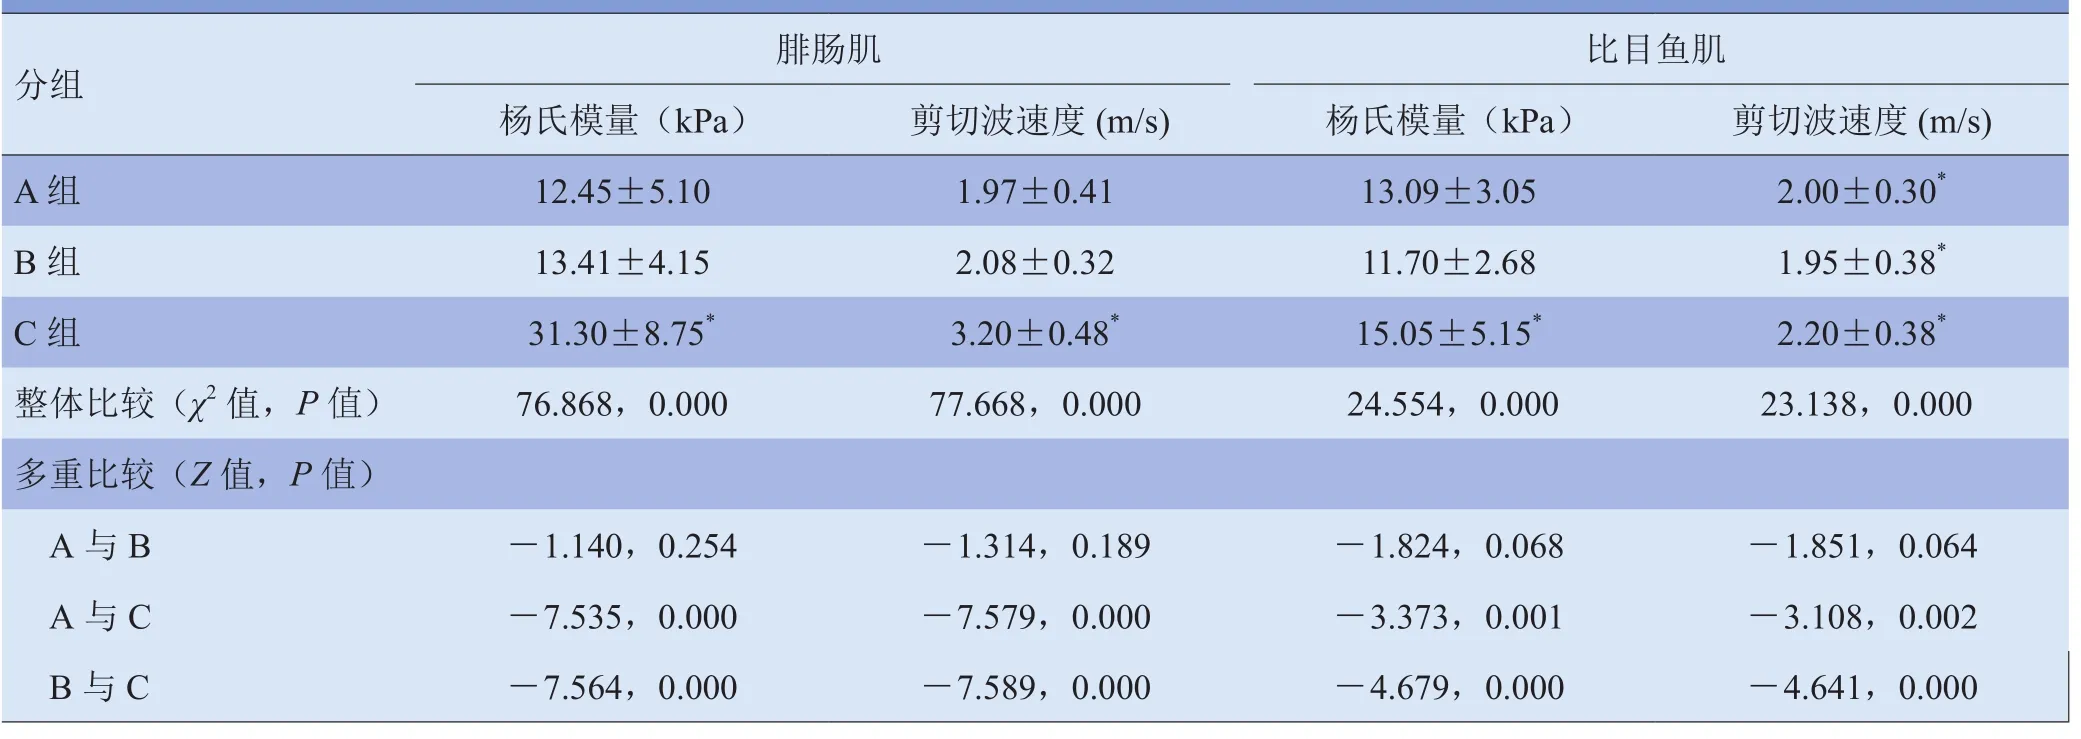
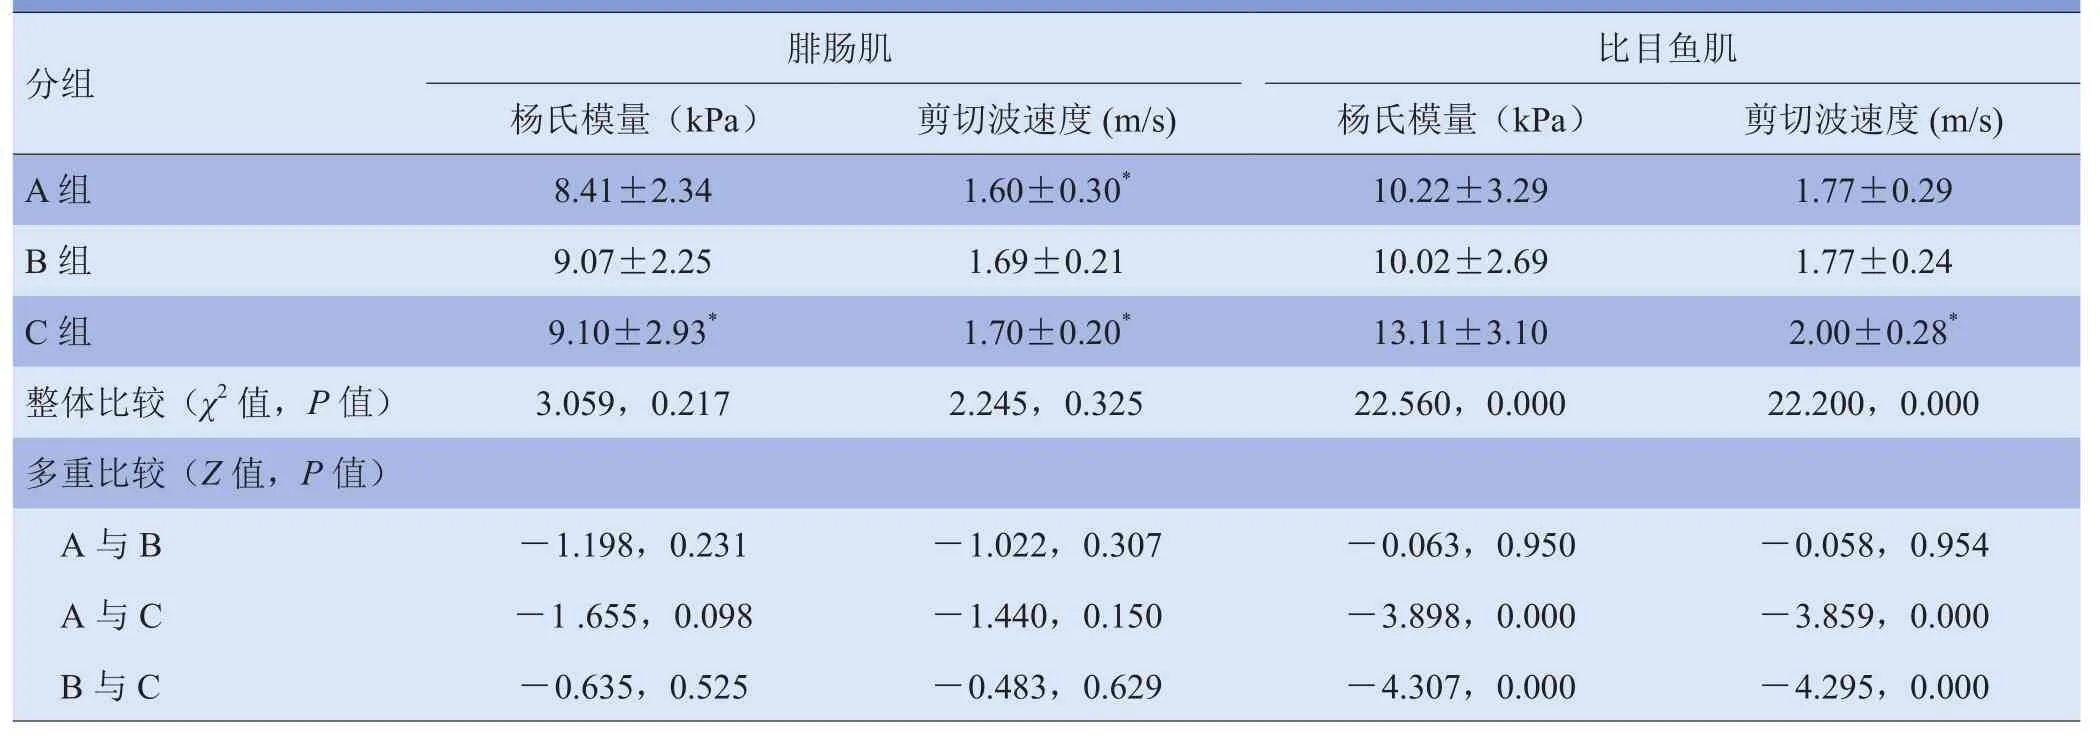
2.3 踝关节不同体位同一肌肉弹性测值的比较 在3个不同踝关节体位间腓肠肌和比目鱼肌各自弹性测值比较,见表3~4。纵切下自然位和最大跖屈位分别与最大背屈位差异有统计学意义(P<0.01),最大背屈位测值较高(表3);横切下仅比目鱼肌自然位和最大跖屈位分别与最大背屈位弹性测值差异有统计学意义(P<0.01),最大背屈位测值较高(表4)。
2.4 BMI及肌肉厚度与弹性测值的线性相关分析 各踝关节体位下,腓肠肌或比目鱼肌各弹性测值与BMI均未见线性相关(P>0.05)。各体位下纵切腓肠肌,杨氏模量或剪切波速度各测值与相应ROI厚度未见线性相关(P>0.05)。

表3 腓肠肌、比目鱼肌不同体位间杨氏模量及剪切波速度纵切测值比较(x±s)

表4 腓肠肌、比目鱼肌不同体位间杨氏模量及剪切波速度横切测值比较(x±s)
3 讨论
本研究中,以健康青年为研究对象,避免了年龄增长及疾病因素对肌肉状态及硬度的影响所致弹性测值干扰。SWUE能实时获得肌肉定量弹性测值,对肌肉硬度进行直接客观量化显示。尽管本研究中腓肠肌和比目鱼肌肌纤维方向与探头有一定的夹角;但Miyamoto等[9]比较探头与肌束方向夹角及探头与皮肤夹角对测量杨氏模量值的影响,发现探头与肌束夹角<20°时差异无统计学意义,探头与皮肤表面夹角不影响弹性测值。本研究比较了腓肠肌和比目鱼肌在同一体位下和同一切面下杨氏模量及剪切波速度测值的差异,结果显示纵切时,最大背屈位杨氏模量和剪切波速度测值差异均有统计学意义(P<0.05),自然位杨氏模量和剪切波速度测值差异无统计学意义(P>0.05);横切时,自然位和最大背屈位的杨氏模量及剪切波速度测值差异均有统计学意义(P<0.05),而在最大跖屈位杨氏模量和剪切波速度差异均无统计学意义(P>0.05)。各块肌肉平时功能状态不同及肌肉在相同体位下所受牵拉后被动收缩程度不同,以及各肌肉内筋膜和血管分布差异[10]。上述因素可能是造成不同肌肉弹性测值差异的主要原因。另外,最大跖屈位纵切时仅杨氏模量测值差异有统计学意义(P<0.05),而剪切波速度测值差异无统计学意义(P>0.05),提示在应用SWUE评估不同肌肉间硬度差异时,杨氏模量与剪切波速度测值可存在少部分不一致,而以往的研究以杨氏模量或剪切波速度1个指标量化评估肌肉硬度均显示出较好的可行性和可信度[5,8,11-16],提示杨氏模量和剪切波速度对肌肉硬度评价均有参考意义。因此,在应用SWUE进行肌肉硬度量化评估时,应考虑到不同肌肉弹性测值的差异,尽可能对相同肌肉的相同部位进行测量,同时参考杨氏模量和剪切波速度2个量化指标,以利于前后对比或不同受试者之间的对比。
本研究中,同一踝关节体位下纵切和横切腓肠肌或比目鱼肌的杨氏模量和剪切波速度测值差异均有统计学意义(P<0.01),且纵切测值均高于横切测值。这可能是受肌肉纤维方向的影响,横切时探头方向因与肌纤维延伸方向垂直导致剪切波传播衰减明显[17],而纵切时因超声声束沿肌纤维方向平行而剪切波传播衰减不明显[18],因而横切时SWUE测值较纵切明显减小。Chino等[10]研究显示,剪切波速度测值随切面不同而变化,腓肠肌纵切时其剪切波速度测值较横切测值高并存在差异,另外Cortez等[19]研究亦显示应用剪切波速度评估肌肉硬度纵切较横切测值更好,这些与本研究中的不同切面剪切波速度测值的结果一致。因此,在应用SWUE评估肌肉组织硬度时,应使探头平行于肌肉长轴进行弹性测值。
本研究还显示,不同踝关节体位对腓肠肌和比目鱼肌的弹性测值有较大影响。纵切时自然位和最大跖屈位分别与最大背屈位的弹性测值差异有统计学意义(P<0.01),且最大背屈位测值高于另外2个体位,而最大跖屈位和自然位之间弹性测值差异无统计学意义(P>0.01),这表明肌肉受牵拉后被动收缩强度增大时肌肉变硬,而其弹性测值随之增大,这与既往量化评估肌肉硬度的研究[12,20-21]相符。在最大背屈位时小腿后部肌肉受牵拉后被动收缩增强而变硬,使得弹性测值较另外2个体位增加明显[5,22-25],而在自然位和跖屈位之间变换时腓肠肌和比目鱼肌受牵拉及收缩状态改变不明显[21]。横切时,腓肠肌杨氏模量和剪切波速度在3个体位间差异无统计学意义(P>0.01),提示纵切面下检测肌肉的剪切波弹性值比横切面更能反映关节体位变化对肌肉硬度变化的影响。不同于腓肠肌,横切时比目鱼肌杨氏模量和剪切波速度测值体现出和纵切时测值同样的差异趋势,提示比目鱼肌与腓肠肌可能存在结构或功能的差异。
本研究探讨了BMI、肌肉厚度与SWUE测值的线性相关性,结果显示在踝关节各体位下,腓肠肌或比目鱼肌杨氏模量和剪切波速度各测值与BMI、纵切腓肠肌杨氏模量和剪切波速度测值与相应ROI肌肉厚度均未见线性相关(P>0.05),提示应用SWUE评估肌肉硬度时BMI和肌肉厚度对弹性测值量化评估无显著影响。
本研究尚存在一定的局限性,如未设计重复性验证,但既往研究显示SWUE量化评估肌肉硬度具有较好的可重复性[16,23,26];未探讨如测值部位深度等其他因素对弹性测值的影响,需待后续研究中进一步探讨。另外,踝关节背屈和跖屈的角度并未测量,因此,受试者之间踝关节背屈和跖屈角度的差异及其对肌肉弹性测值的影响无法得知。
总之,腓肠肌、比目鱼肌超声弹性测值的大小与超声纵切或横切、踝关节体位有关,且两肌肉间的弹性测值也存在一定差异,在应用SWUE定量评估肌肉硬度时应给予考虑,同时参考杨氏模量和剪切波速度2个指标评估肌肉的硬度。
[1]Barrett RS. What are the long-term consequences of botulinum toxin injections in spastic cerebral palsy? Dev Med Child Neurol, 2011, 53(6): 485.
[2]Cornu C, Goubel F, Fardeau M. Muscle and joint elastic properties during elbow flexion in Duchenne muscular dystrophy. J Physiol, 2001, 533(Pt 2): 605-616.
[3]Cosgrove D, Piscaglia F, Bamber J, et al. EFSUMB guidelines and recommendations on the clinical use of ultrasound elastography. Part 2: clinical applications. Ultraschall Med, 2013, 34(3): 238-253.
[4]王艳春,肖沪生,徐芳,等.实时剪切波弹性成像在骨骼肌系统中的应用.中国医学影像学杂志, 2016, 24(3): 238-240.
[5]Chernak LA, DeWall RJ, Lee KS, et al. Length and activation dependent variations in muscle shear wave speed. Physiol Meas, 2013, 34(6): 713-721.
[6]Akagi R, Takahashi H. Acute effect of static stretching on hardness of the gastrocnemius muscle. Med Sci Sports Exerc, 2013, 45(7): 1348-1354.
[7]Ewertsen C, Carlsen JF, Christiansen IR, et al. Evaluation of healthy muscle tissue by strain and shear wave elastographydependency on depth and ROI position in relation to underlying bone. Ultrasonics, 2016, 71:127-133.
[8]Koo TK, Guo JY, Cohen JH, et al. Relationship between shear elastic modulus and passive muscle force: an ex-vivo study. J Biomech, 2013, 46(12): 2053-2059.
[9]Miyamoto N, Hirata K, Kanehisa H, et al. Validity of measurement of shear modulus by ultrasound shear wave elastography in human pennate muscle. PLoS One, 2015, 10(4): e0124311.
[10]Chino K, Kawakami Y, Takahashi H. Tissue elasticity of in vivo skeletal muscles measured in the transverse and longitudinal planes using shear wave elastography. Clin Physiol Funct Imaging, 2017, 37(4): 394-399.
[11]Nordez A, Hug F. Muscle shear elastic modulus measured using supersonic shear imaging is highly related to muscle activity level. J Appl Physiol, 2010, 108(5): 1389-1394.
[12]Shinohara M, Sabra K, Gennisson JL, et al. Real-time visualization of muscle stiffness distribution with ultrasound shear wave imaging during muscle contraction. Muscle Nerve, 2010, 42(3): 438-441.
[13]Eby SF, Song P, Chen S, et al. Validation of shear wave elastographyin skeletal muscle. J Biomech, 2013, 46(14): 2381-2387.
[14]Nakamura M, Ikezoe T, Kobayashi T, et al. Acute effects of static stretching on muscle hardness of the medial gastrocnemius muscle belly in humans: an ultrasonic shear-wave elastography study. Ultrasound Med Biol, 2014, 40(9): 1991-1997.
[15]Itoigawa Y, Sperling JW, Steinmann SP, et al. Feasibility assessment of shear wave elastography to rotator cuff muscle. Clin Anat, 2015, 28(2): 213-218.
[16]Rosskopf AB, Ehrmann C, Buck FM, et al. Quantitative shearwave US elastography of the supraspinatus muscle: reliability of the method and relation to tendon integrity and muscle quality. Radiology, 2016, 278(2): 465-474.
[17]Aubry S, Risson JR, Kastler A, et al. Biomechanical properties of the calcaneal tendon in vivo assessed by transient shear wave elastography. Skeletal Radiol, 2013, 42(8): 1143-1150.
[18]Aristizabal S, Amador C, Qiang B, et al. Shear wave vibrometry evaluation in transverse isotropic tissue mimicking phantoms and skeletal muscle. Phys Med Biol, 2014, 59(24): 7735-7752.
[19]Cortez CD, Hermitte L, Ramain A, et al. Ultrasound shear wave velocity in skeletal muscle: a reproducibility study. Diagn Interv Imaging, 2016, 97(1): 71-79.
[20]Chino K, Takahashi H. Measurement of gastrocnemius muscle elasticity by shear wave elastography: association with passive ankle joint stiffness and sex differences. Eur J Appl Physiol, 2016, 116(4): 823-830.
[21]Raiteri BJ, Hug F, Cresswell AG, et al. Quantification of muscle co-contraction using supersonic shear wave imaging. J Biomech, 2016, 49(3): 493-495.
[22]Nakamura M, Ikezoe T, Umegaki H, et al. Shear elastic modulus is a reproducible index reflecting the passive mechanical properties of medial gastrocnemius muscle belly. Acta Radiol Open, 2016, 5(4): 2058460115604009.
[23]Maisetti O, Hug F, Bouillard K, et al. Characterization of passive elastic properties of the human medial gastrocnemius muscle belly using supersonic shear imaging. J Biomech, 2012, 45(6): 978-984.
[24]Akagi R, Chino K, Dohi M, et al. Relationships between muscle size and hardness of the medial gastrocnemius at different ankle joint angles in young men. Acta Radiol, 2012, 53(3): 307-311.
[25]Chino K, Akagi R, Dohi M, et al. Reliability and validity of quantifying absolute muscle hardness using ultrasound elastography. PLoS One, 2012, 7(9): e45764.
[26]Hug F, Lacourpaille L, Maisetti O, et al. Slack length of gastrocnemius medialis and Achilles tendon occurs at different ankle angles. J Biomech, 2013, 46(14): 2534-2538.
(本文编辑 周立波)
Preliminary Study on Quantitative Evaluation of Hardness of Gastrocnemius and Soleus Using Shear-wave Ultrasound Elastography
Purpose To explore the effect of ultrasonic section, patient position and other factors on Young's modulus and shear wave velocity measurement of the muscle, and to study the consistency between Young's modulus and shear wave velocity on reflection of muscle hardness. Materials and Methods Shear wave elastography was used to detect 10 healthy young men and 10 women. Longitudinal and transverse detection of the Young's modulus and shear wave velocity of gastrocnemius and soleus were performed in natural ankle joint position, maximum plantar flexion and maximum dorsiflexion position. Results①Comparison of the elasticity measurement between gastrocnemius and soleus. There were significant differences in the Young's modulus in the maximum plantar flexion and Young's modulus and shear wave velocity in maximum dorsiflexion position in longitudinal detection (P<0.05) that gastrocnemius measurements were higher than soleus measurements. There were significant differences in Young's modulus and the shear wave velocity (P<0.05) in natural position and maximum dorsiflexion position that soleus measurements were higher than gastrocnemius measurements.② In the positions of the ankle joints, the differences between longitudinal detection values and transverse detection values of gastrocnemius or soleus were statistically significant (P<0.01) and longitudinal detection values were higher than transverse detection values.③ Comparison of the elasticity measurement of gastrocnemius and soleus muscle among different positions of the ankle joints. The measurement in natural position and in the maximum plantar flexion were evidently higher than that in the maximum dorsiflexion position (P<0.01) in longitudinal detection. The maximum dorsiflexion position showed higher elasticity measurement. Only elasticity measurement in natural position and the maximum plantar flexion of the soleus was statistically different from that in the maximum dorsiflexion position (P<0.01) that it was higher in the maximum dorsiflexion position. Conclusion The ultrasound elasticity measurements of gastrocnemius and soleus are related with the ultrasonic longitudinal or transverse section and the relative ankle positions. Moreover, there are some differences in elasticity measurements between these two muscles. should be given to all of these in quantitative evaluation of muscle hardness using shear wave ultrasound elastography.
Muscle, skeletal; Ultrasonography; Elasticity imaging techniques
R445.1;R337
10.3969/j.issn.1005-5185.2017.07.015
解放军总医院超声诊断科 北京 100853
王月香
Department of Ultrasound, Chinese PLA General Hospital, Beijing 100853, China
Address Correspondence to: WANG Yuexiang E-mail: wangyuexiang1999@sina.com
2017-02-09
修回日期:2017-03-25
中国医学影像学杂志
2017年 第25卷 第7期:536-540,542
Chinese Journal of Medical Imaging 2017 Volume 25 (7): 536-540, 542
