Air Traffic Operation Complexity Analysis Based on Metrics System
2016-11-21,,,
,,,
1. College of Civil Aviation, Nanjing University of Aeronautics and Astronautics, Nanjing 211106, P.R. China 2. College of Economics and Management, Nanjing University of Aeronautics and Astronautics, Nanjing 211106, P.R. China
Air Traffic Operation Complexity Analysis Based on Metrics System
XieHua1*,CongWei1,HuMinghua1,LiuSifeng2
1. College of Civil Aviation, Nanjing University of Aeronautics and Astronautics, Nanjing 211106, P.R. China 2. College of Economics and Management, Nanjing University of Aeronautics and Astronautics, Nanjing 211106, P.R. China
(Received 22 August 2015; revised 16 November 2015; accepted 5 January 2016)
In order to quantitatively analyze air traffic operation complexity, multidimensional metrics were selected based on the operational characteristics of traffic flow. The kernel principal component analysis method was utilized to reduce the dimensionality of metrics, therefore to extract crucial information in the metrics. The hierarchical clustering method was used to analyze the complexity of different airspace. Fourteen sectors of Guangzhou Area Control Center were taken as samples. The operation complexity of traffic situation in each sector was calculated based on real flight radar data. Clustering analysis verified the feasibility and rationality of the method, and provided a reference for airspace operation and management.
operation complexity; traffic metrics; kernel primary component analysis; hierarchical clustering
0 Introduction
Advanced technologies and new operational concepts have been applied to air transport system, leading to a great leap forward in safety, capacity, and efficiency in the last decades. However, the complexity of the system has increased as well, which has drawn many researchers and operation managers′ attention to the underlying mechanisms of the system. Nonlinear approaches, including complexity, chaos and fractal analyses, have provided strong tools to delve into the air traffic control system. For instance, the complexity of air traffic has become a hot topic over the past few years and great achievements have been obtained. The number of aircraft is taken as the most relevant indicator to complexity, and has been widely used in Europe, U.S. and other developed countries. This approach is to contrast the number of aircraft and the capacity of airspace to determine the opening and merging of sectors[1-2]. Refs.[3-5] proposed a dynamic density model and established a relationship between traffic complexity and controller′s workload. An intrinsic complexity model was proposed to measure the complexity of multiple coupled aircraft by means of the aircraft pair convergence/non-convergence situation based on the aircraft pair′s relative speed and relative positions[6-8]. Refs. [9-10] developed a traffic flow perturbation analysis model to analyze the degree of change when the aircraft dealt with perturbation under different traffic situations. They also designed a complexity map to show the perturbation effect within the controlled range.
Obviously, many factors contribute to air traffic operation complexity. Researchers have proposed different complexity models. However, each model only considers partial influencing factors. In order to comprehensively reflect the operation complexity of air traffic, multidimensional factors should be considered in one metrics system[11-12]. Therefore, we proposed an analysis method based on metrics system. We selected quantitative metrics to construct the metrics system, and facilitated the kernel principal component analysis method to extract information from traffic flow metrics system. Last, we employed hierarchical clustering method to cluster sectors into different categories. The results showed that the proposed method was capable of representing air traffic operation complexity.
1 Complexity Metrics System
The air traffic operation complexity mainly relates to traffic distribution, dynamic operation of aircraft, and coupling effect of traffic flow[12-13]. Therefore, the metrics system is constructed based on the three aspects.
First of all, aircraft are the basic components of traffic flow, and their spatial and temporal distributions are important for the analysis of operation complexity. Secondly, aircraft exhibit dynamic features within 3D space. Climbing, cruising and descending compose a flight process. Finally, there are coupling relationships between different aircraft. Any change of an aircraft state may trigger a complex chain of reactions. The airspace perturbation analysis and the study of intrinsic complexity of traffic have illustrated this attribute. Thus, an aircraft pair (i.e. a pair of aircraft), instead of a single aircraft, is the fundamental object for the analysis. In summary, the operational characteristic metrics of air traffic should include: (1) Number of aircraft; (2) Average flight distance of aircraft; (3) Average flying time of aircraft; (4) Total flying distance of aircraft; (5) Total flying time of aircraft; (6) Number of aircraft climbing; (7) Number of aircraft descending; (8) Number of aircraft in level flight; (9) Average speed of aircraft; (10) Standard deviation of speed of aircraft; (11) Average heading of aircraft; (12) Standard deviation of heading of aircraft; (13) Minimum horizontal separation of aircraft pair on the same flight level within airspace; (14) Minimum vertical separation of aircraft pair on the same flight level within airspace; (15) Critical exponent of separation, which is based on how close the separation between the two aircraft will be in relation to the separation minima; (16) Number of aircraft pairs with relative distance between 0—5 nautical miles; (17) Number of aircraft pairs with relative distance between 5—10 nautical miles. The detailed definitions and calculation models of the metrics are given in Ref. [12].
2 Kernel Primary Component Analysis
Primary component analysis (PCA) is a linear dimensionality reduction method, which is commonly used in multi-metrics comprehensive evaluation[14]. However, PCA cannot solve nonlinear problems in normal operation situation, because it may result in scattered contribution rate of each metric. In recent years, with the development of support vector machine, a surge of research on kernel method has emerged. Kernel principal component analysis (KPCA), involving kernel method, is the extension of PCA for nonlinear problems, which maps the sample data through the nonlinear function into the high dimensional linear characteristic space, where the principal component is calculated[15]. Compared with PCA, KPCA is not only suitable for handling nonlinearly problems, but also able to retain more information[15]. Since the complexity metrics are largely nonlinear interacted, we chose KPCA to extract information of principal components.
The detailed steps of KPCA are given as follows.
(1)Mairspace samples at the same time as well asNmetrics are selected. The matrix of the data of original samples is defined as x=(xmn)M×N, where xmnrepresents the data of thenth metrics of themth sample.
(3) The appropriate kernel function is defined to calculate the kernel matrix. In this paper, the radial basis function (RBF) is used as
(1)
wherea= 1 000[15].


(6) The eigenvalues are sorted in the descending order, and the corresponding eigenvectors are adjusted. Gram-Schmidt orthogonal method is used to standardize the eigenvectors, andε1,ε2,…,εnare calculated.
(7) Define contribution rateδnas the ratio of the eigenvalueλnto the sum of all eigenvalues. The cumulative contribution rate isδ1+δ2+…+δn. Ifδ1+δ2+…+δt≥P(Pis the threshold of accumulated contribution rate which is set based on experience),tprincipal components are extracted asε1,ε2,…,εt. Since there are too many metrics selected in this paper,Pis set as 95%[14-15].


3 HierarchicalClusteringMethod
Hierarchicalclusteringmethodisoneofthemostwidelyusedclusteringmethods[16-17].Thebasicprincipleis:GivenMsampleswitheachsampleinitiallyasaclass,thedistancesbetweensamplesandbetweenclassesarepredetermined.First,thedistancesbetweensamplesarecalculated.Theclasseswiththeshortestdistancearecombinedintoanewone.Thenthedistancesbetweenthenewclassesandotherclassesarecalculated,andagaintheclasseswiththeshortestdistancearecombinedintoanewclass.AclassisremovedeachtimeuntilMsamplesarecombinedintooneclass.Finally,theaboveclusteringprocessisdrawninapedigreechart.Thenumberofclassesisdeterminedaccordingtoagivenprinciple.Thedistancesbetweenclassescanbedefinedbymultiplemethods.ThesquaresumofdeviationsisalsoknownastheWardmethod.Itsbasicprinciplestemsfromtheanalysisofvariance,whichcangiveoptimalclusteringandatthesametimeensuretheminimumsquaresumofdeviationsbetweenthesameclassesofsamplesaswellasthemaximumsquaresumofdeviationsbetweendifferentclasses.Thehierarchicalclusteringmethodbasedonsquaresumofdeviationsisusedinthispaper.
Inordertoquantitativelydeterminetheoptimalclusteringresults,theclusterqualitydiscriminationfunctionisdeveloped.Theclosenessindicatesthedegreeofsimilaritybetweendifferentobjectsinthesamecluster.Thegreaterthedegreeofsimilarity,thegreatertheclosenessandthebettertheclusteringeffect.Theseparabilitysuggeststhedegreeofseparationbetweentheobjectsindifferentclusters.Thegreaterthedegreeofseparation,thegreatertheseparabilityandthebettertheclusteringeffect.Theclosenessandtheseparabilitytogetherdeterminetheclusterqualityfunction.


(2)

(3)
The separability of any two cluster subsets is expressed as

(4)
(5)
The cluster quality function can be obtained from the closeness and separability of the clusters, which is expressed as

(6)
Thus, the cluster quality can be determined according to the cluster quality function. The larger the function value, the better the clustering effect. As a result, the optimal number of clusters is determined.
4 Case Study
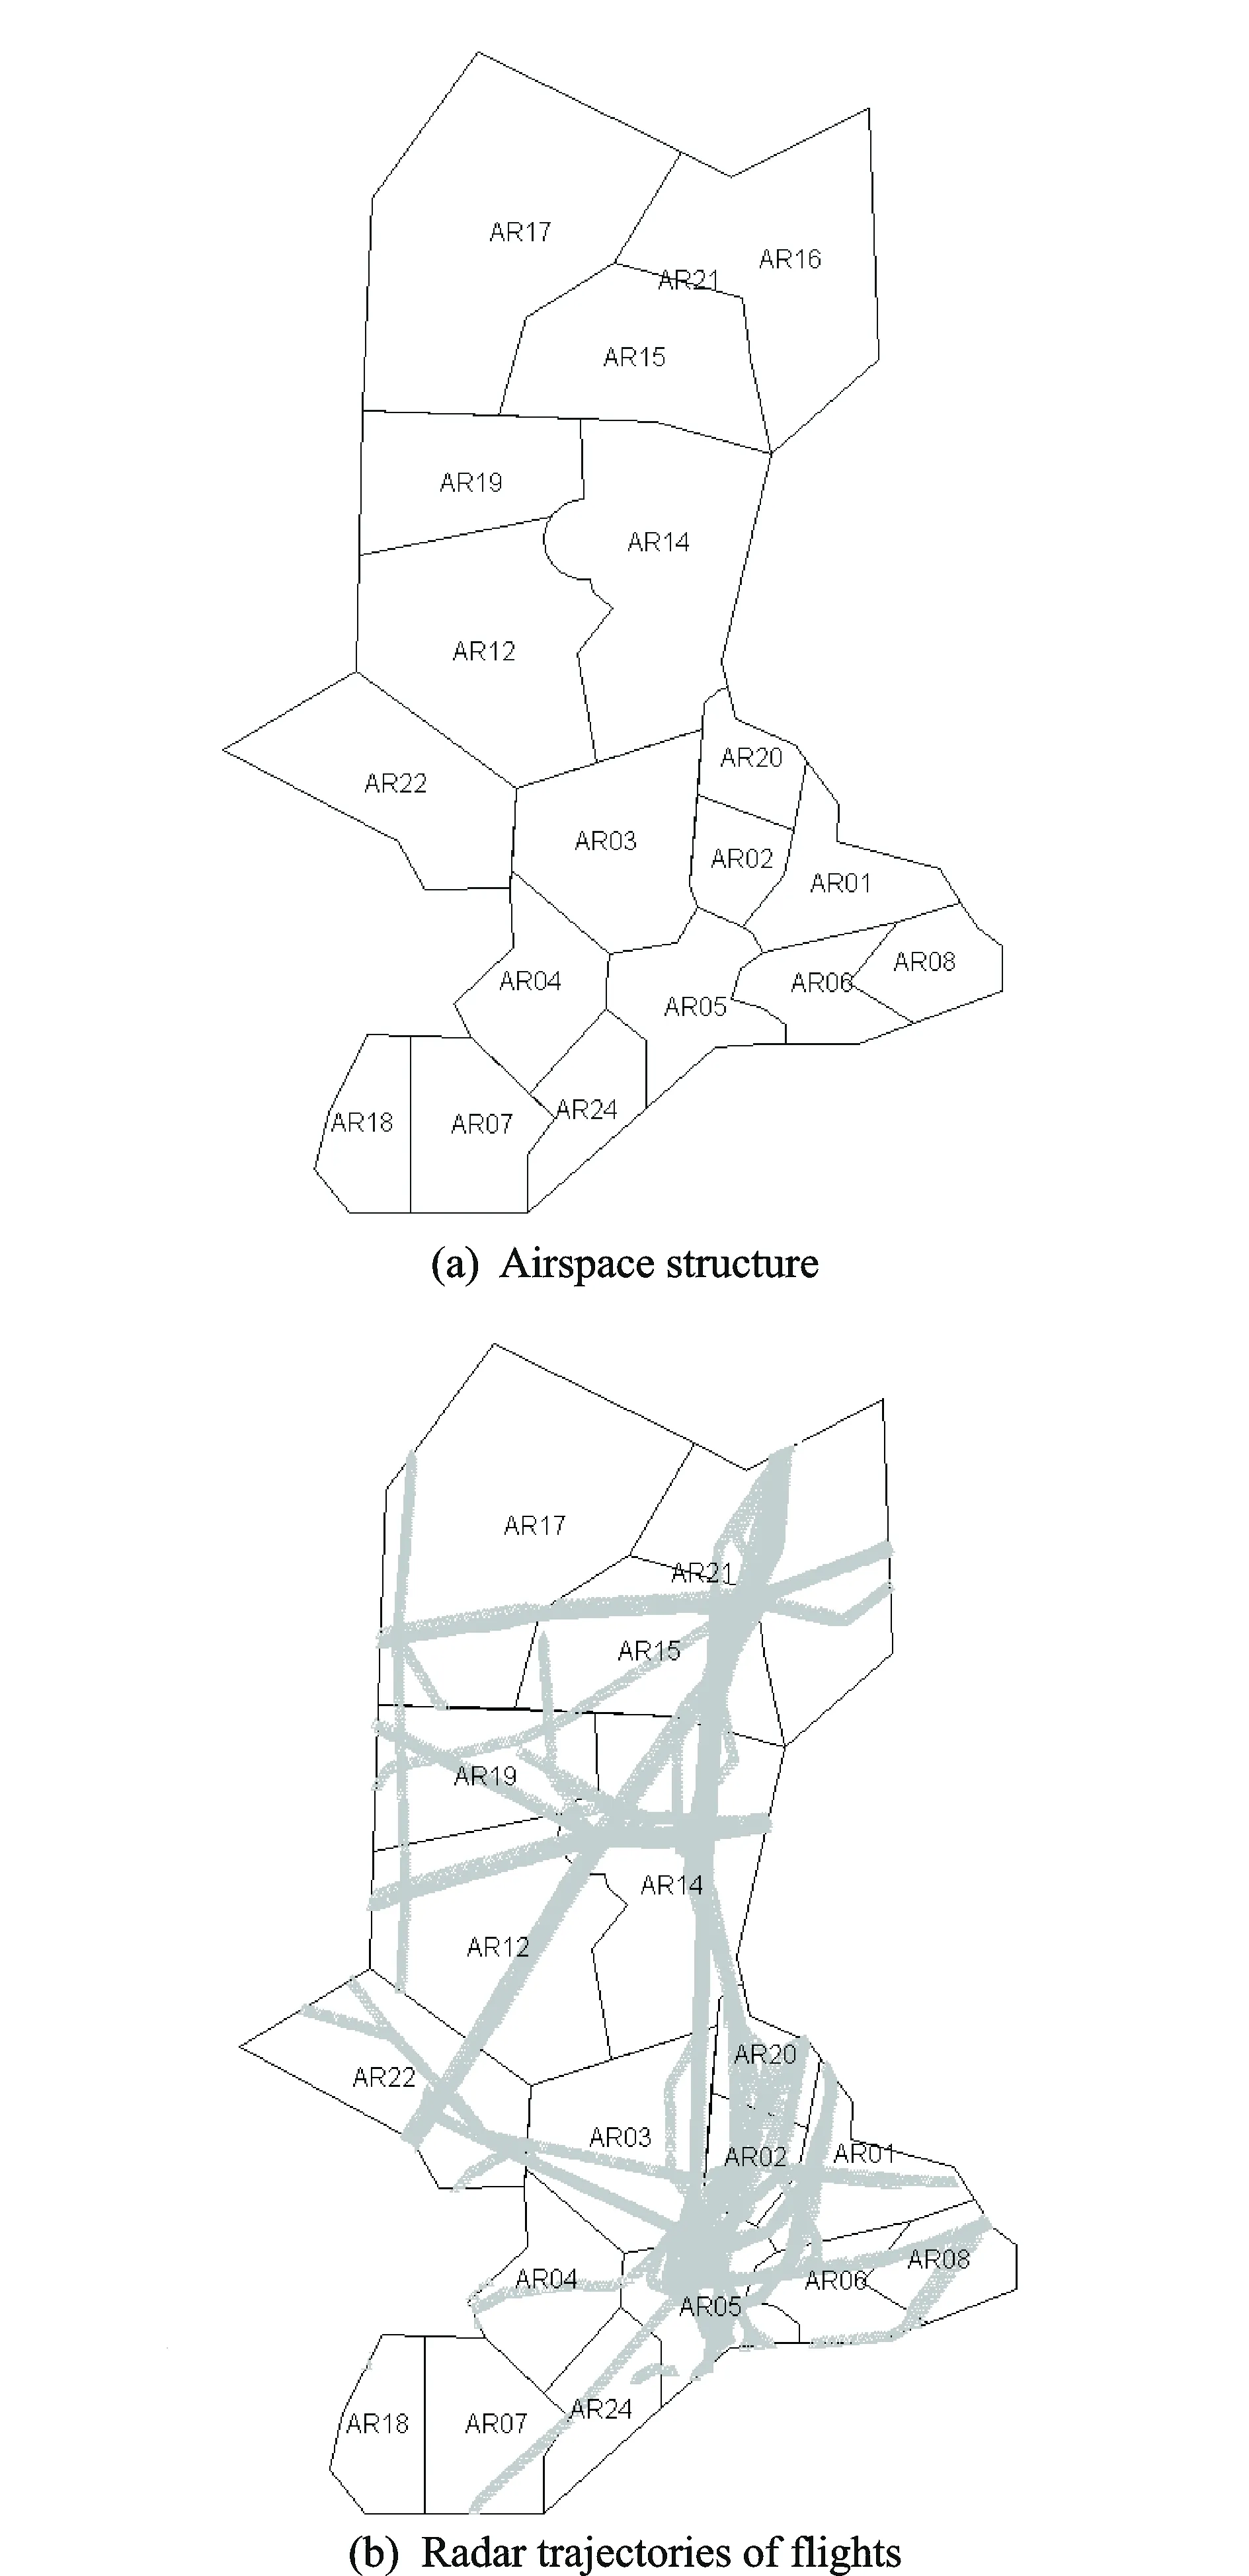
The proposed method was implemented based on the data from Guangzhou Area Control Center. The airspace structure is shown in Fig. 1(a). Fig. 1(b) shows the radar trajectories of flights between 9∶00—10∶00, Sep 13, 2012, providing intuitively understanding of the airspace structure and traffic distribution in Guangzhou region.
Most sectors are high-altitude sectors, while the remains are medium and low-altitude sectors. There are 21 high-altitude sectors above 7 800 m, including AR01-08, AR11-22 and AR24. Wuhan Approach Control Area is under AR15 and AR16, Zhanjiang Approach Control Area is under AR07 and AR18, Guangzhou Approach Control Area and Zhuhai Approach Control Area are under AR05 and AR02, and Changsha Approach Control Area is under AR13. Due to the lack of height information in the flight radar data obtained from the operation backup system, when there is an approach control sector under a high-altitude sector, the flight radar data that belongs to the approach control sector will be misclassified into the high-altitude sector, leading to excessive data of the high-altitude sector. This will influence the analysis result. Therefore, the above influenced high-altitude sectors were excluded from this study. The remaining 14 sectors were taken as airspace samples, which were represented by Sectors 1—14 in order to simplify the expression. The 17 metrics were represented by MT1—17 in the order listed above.

Fig.1 Airspace structure and radar trajectories in Guangzhou Area
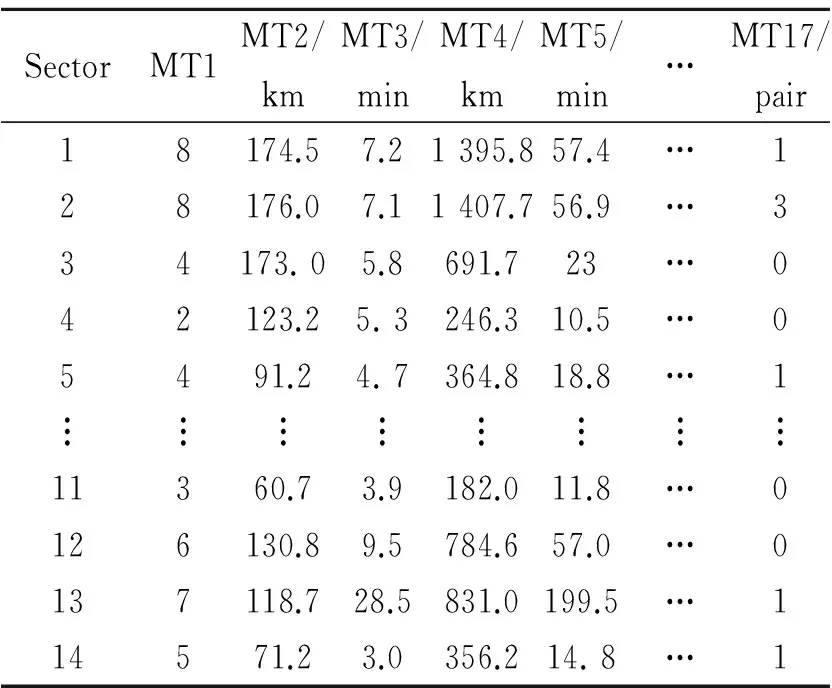
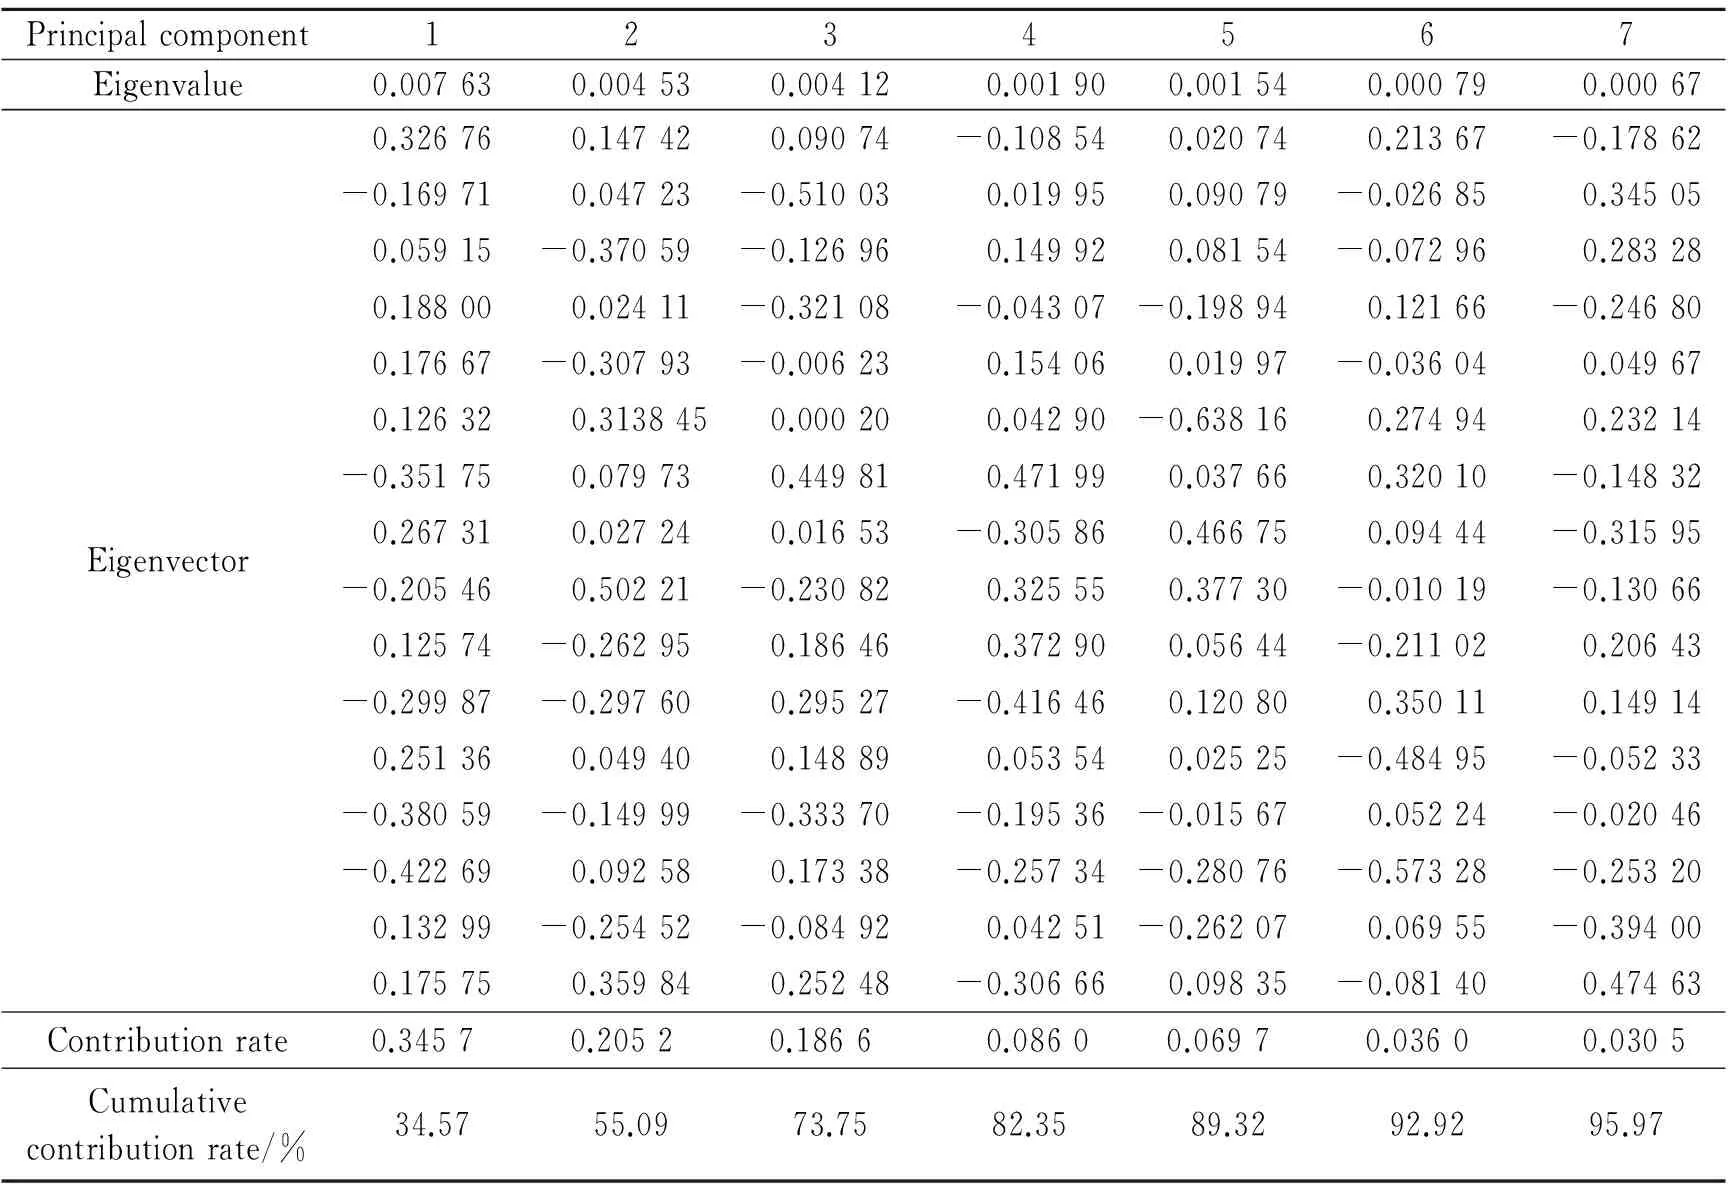
Operation complexity metrics were calculated at 18∶57∶29 of one day. Part results are shown in Table 1. When the cumulative contribution rate of principal components of metrics reached 95%, a total of seven principal components were extracted. The cumulative contribution rate is up to 95.97%, as shown in Table 2.

Table 1 Results of operation complexity metrics
Based on the principal components extracted by KPCA, the composite scores of sector samples were calculated, as shown in Table 3. Then the clustering analysis was carried out. Fig. 2 is the obtained cluster pedigree chart.

Table 2 KPCA results of operation complexity metrics

TabLle 3 Composite scores of sector samples
According to the cluster quality function and the operation complexity, sector samples were clustered into three categories. AR03, AR01, AR22, AR12 and AR14 were clustered into the first category. AR21, AR24, AR17, AR08, AR04, AR19 and AR20 were clustered into the second category, and AR06 and AR11 were clustered into the third category. These three categories have different characteristics: (1) The common characteristics of the first category represented by AR03 showed that there were a larger number of aircraft. Although there were some aircraft in the climbing state, most flights were in level flight. The speed distribution had a large fluctuation range (large standard deviation), while the minimum horizontal separation was between 6—10 nautical miles, and the minimum vertical separation distribution was between 300—600 meters. Due to the wide distribution of the traffic flow, the flights exhibited obvious dynamic feature. There was a strong coupling relationship between flights, and the intrinsic attribute was prominent. Therefore the operational situations of these sectors were most complex. (2) The main characteristics of the second category represented by AR21 were that the number of aircraft was at the intermediate level, with flights basically in level flight. The average speed was between 600—800 km/h, and the fluctuation range was small. The distribution ranges of minimum horizontal and vertical separations were enlarged, with only a few sectors had a pair of aircraft within 5—10 nautical miles. Compared with the first category, the traffic density of the second one was smaller. The aircraft′s dynamic state began to stabilize, and the speed distribution was consistent. The coupling effects between aircraft became weak, so the overall operation complexity dropped off. (3) The operation situations in the third category of AR06 and AR11 were relatively simple. Due to the small number of aircraft, the distributions of most metrics decreased, and the minimum horizontal and vertical separations were large. The dynamic characteristics were not obvious, and the interaction between aircraft was not significant. So the operational characteristic was the simplest one.
In summary, the distribution of traffic flow, dynamic states and the coupling relations are important factors that contribute to operation complexity of air traffic situation. Although the number of aircraft is not equivalent to the complexity (for example, AR03 and AR01 had the same number of aircraft, but the scores of the complexity were not equal), it plays an important role in analyzing the complexity. Based on the method of study operation complexity, managers can assess the operation complexity of airspace units in real time and control flights to reduce the complexity. They can also identify operational problems through the analysis of historical radar data.
5 Conclusions
We chose some related quantitative metrics to describe the multi-dimensional operational characteristics, therefore to study the operation complexity of air traffic. Then we utilized KPCA to reduce dimensionality and refine the high-dimensional metrics system, which helped to extract composite score to analyze the complexity of sector sample. The hierarchical clustering method was used to analyze the complexity level of multiple sectors, indicating the feasibility of the proposed method. Finally, we took Guangzhou Area Control Center as an example to verify effectiveness of the method. The results also provided a reference for the airspace management.
In the future, we will focus on integrating more operational factors into the metrics system, and try to involve more time slots in dynamic clustering analysis to explore fluctuations of operation complexity of multiple sectors.
Acknowledgements
This work was co-supported by the National Natural Science Foundation of China (No. 61304190), the Fundamental Research Funds for the Central Universities of China (No. NJ20150030), and the Youth Science and Technology Innovation Fund (No. NS2014067).
[1] MARIA P, LUIGI P, STEPHANE P, et al. Toward air traffic complexity assessment in new generation air traffic management systems[J]. IEEE Transactions on Intelligent Transportation Systems, 2011, 12(3): 809-818.
[2] ZHANG Jin, HU Minghua, ZHANG Chen. Complexity research in air traffic management[J]. ACTA Aeronautica et Astronautica Sinica, 2009, 30 (11): 2132-2142. (in Chinese)
[3] LAUDEMAN I V, SHELDEN S G, BRANSTROM R, et al. Dynamic density: An air traffic management metric[R]. NASA/ TM -1998-112226, 1998.
[4] ALEXANDER K, MARK D R, KENNETH L. Simplified dynamic density: a metric for dynamic airspace configuration and nextgen analysis[C]∥ IEEE, Proceedings of the 28th Digital Avionics Systems Conference. Piscataway, New Jersey: IEEE, 2009: 2.D.3-1-2.D.3-12.
[5] CHITTAYONG S, PENG W, STEVEN L, DENG F S. Evaluation of stream air traffic operations by adapting dynamic density complexity measure[C]∥ Proceedings of 12th AIAA Aviation Technology, Integration, and Operations Conference. Indianapolis: AIAA, 2012.
[6] DELAHAYE D, PUECHMOREL S. Air traffic complexity: Towards intrinsic metrics[C]∥ 3rd USA/Europe ATM R&D Seminar. Napoli, Italy: [s.n.], 2000.
[7] ZHANG Jin, HU Minghua, ZHANG Chen, et al. Airspace complexity modeling[J]. Journal of Nanjing University of Aeronautics & Astronautics, 2010, 42(4): 454-460. (in Chinese)
[8] XU Xiaohao, HUANG Baojun, SHU Qin. Sector complexity evaluation based on intrinsic attributes[J]. Journal of Civil Aviation University of China, 2013, 31 (2): 22-28. (in Chinese)
[9] ZHAO Y F, ZHANG D, YUE R T, WANG H Y. Method to analyze air traffic situation based on air traffic complexity map[C]∥ 9th USA/Europe ATM R&D Seminar. Germany, Berlin: [s.n.], 2011.
[10]KEUMJIN L, ERIC F, AMY P. Describing airspace complexity: Airspace response to disturbances[J]. AIAA Journal of Guidance, Control and Dynamics, 2009, 32(1): 210-222.
[11]CONG Wei, HU Minghua, ZHANG Chen. Construction and refinement method of metrics system[J]. Journal of Transportation Systems Engineering and Information Technology, 2012, 12(5): 130-134. (in Chinese)
[12]ZHANG Chen. Research on the complexity of the traffic behaviors in air traffic management[D]. Nanjing: Nanjing University of Aeronautics and Astronautics, 2011. (in Chinese)
[13]HILBURN B. Cognitive complexity in air traffic control: a literature review[R]. EEC Note No 04/04, Brussels, Eurocontrol: [s.n.], 2004.
[14]ZHANG Jianping, HU Minghua, LIU Weidong. Integrated evaluation for operation performance of air traffic control in terminal area[J]. Journal of Southwest Jiaotong University, 2012, 47(2): 341-347. (in Chinese)
[15]TWINING C J, TAYLOR C J. The use of kernel principal component analysis to model data distributions[J]. Pattern Recognition, 2003, 36(1): 217-227.
[16]FRED A L N, Leitao J M N. Partitional vs hierarchical clustering using a minimum grammar complexity approach[C]∥ 3rd International Workshop on Statistical Techniques in Pattern Recognition. Alicante, Spain: [s.n.], 2000: 193-202.
[17]ZHOU Fa,ZHANG Wei, SUN Ke, et al. Optimized Fuzzy Clustering Method for Health Monitoring of Shield Tunnels[J]. Transactions of Nanjing University of Aeronautics and Astronautics,2015,32(3):325-333.
Dr. Xie Hua is currently the director of the Office of Air Traffic Flow Management Lab of the National Key Laboratory of Air Traffic Flow Management. He received the M.S. degree in Computer Science and Technology and the Ph.D. degree in Systems Engineering from NUAA in 2005 and 2016, respectively. His current research interests cover air traffic performance, complex systems modeling and analysis, and big data science.
Mr. Cong Wei is currently a Ph.D. candidate in College of Civil Aviation, Nanjing University of Aeronautics and Astronautics (NUAA). He received his B.S. degree from the same university in 2011. His area of research includes air traffic performance evaluation and air traffic complexity theory.
Prof. Hu Minghua is currently a professor and doctoral supervisor at the Civil Aviation College of Nanjing University of Aeronautics and Astronautics (NUAA), China. He is currently an expert of General Administration of Civil Aviation of China (CAAC) and a member of future national ATFM system panel.
Prof. Liu Sifeng is currently a professor and doctoral supervisor at the Economics and Management College of Nanjing University of Aeronautics and Astronautics (NUAA), China. His current research interest covers grey system theory.
(Executive Editor: Zhang Bei)
U8 Document code:A Article ID:1005-1120(2016)04-0461-08
*Corresponding author, E-mail address: marcuse@163.com.
How to cite this article: Xie Hua, Cong Wei, Hu Minghua, et al. Air traffic operation complexity analysis based on metrics system[J]. Trans. Nanjing Univ. Aero. Astro., 2016,33(4):461-468.
http://dx.doi.org/10.16356/j.1005-1120.2016.04.461
杂志排行
Transactions of Nanjing University of Aeronautics and Astronautics的其它文章
- Identification of Information-Seeking Behaviors from Air Traffic Controllers′ Eye Movements
- Multi-objective Collaborative Optimization for Scheduling Aircraft Landing on Closely Spaced Parallel Runways Based on
- Departure Trajectory Design Based on Pareto Ant Colony Algorithm
- Sectorization Model of Terminal Airspace with Arrival and Departure Separation
- A Test Method for the Static/Moving State of Targets Applied to Airport Surface Surveillance MLAT System
- Effects of Deck Motion and Ship Airwake on Ski-Jump Takeoff Performance of Carrier-Based Aircraft
