Departure Trajectory Design Based on Pareto Ant Colony Algorithm
2016-11-21,,
,,
1.College of Civil Aviation, Nanjing University of Aeronautics and Astronautics, Nanjing 211106, P.R. China;2.School of Aeronautics & Astronautics, Sichuan University, Chengdu 610065, P.R. China;3.Department of Operation Control, China Eastern Airlines Jiangsu Co., Ltd, Nanjing 211113, P.R. China
Departure Trajectory Design Based on Pareto Ant Colony Algorithm
SunFanrong1*,HanSongchen2,QianGe3
1.College of Civil Aviation, Nanjing University of Aeronautics and Astronautics, Nanjing 211106, P.R. China;2.School of Aeronautics & Astronautics, Sichuan University, Chengdu 610065, P.R. China;3.Department of Operation Control, China Eastern Airlines Jiangsu Co., Ltd, Nanjing 211113, P.R. China
(Received 18 January 2015; revised 20 February 2016; accepted 5 March 2016)
Due to the ever-increasing air traffic flow, the influence of aircraft noise around the airport has become significant. As most airlines are trying to decrease operation cost, stringent requirements for more simple and efficient departure trajectory are on a rise. Therefore, a departure trajectory design was established for performance-based navigation technology, and a multi-objective optimization model was developed, with constraints of safety and noise influence, as well as optimization targets of efficiency and simplicity. An improved ant colony algorithm was then proposed to solve the optimization problem. Finally, an experiment was conducted using the Lanzhou terminal airspace operation data, and the results showed that the designed departure trajectory was feasible and efficient in decreasing the aircraft noise influence.
aircraft noise; departure trajectory design; multi-objective optimization; Pareto ant colony algorithm
0 Introduction
With the ever-increasing air traffic flow, aircraft noise problems around the airport have been exacerbated, which increases the operation cost of airlines. As a crucial part of flight procedure, a reasonable departure trajectory is helpful in optimizing the terminal airspace operation, which leads to a safe, efficient, and orderly aircraft operation. Currently, the flight procedure design has been mainly based on ICAO DOC8168[1]and FAA TERPS[2], which involve obtaining the obstacle position and height information and setting up the safety protection zone to ensure corresponding clearance between the aircraft and the ground obstacles. However, these methods cannot meet the preceding requirements of safety, efficiency, simplicity, and lower noise influence of conventional performance-based navigation (PBN) procedures. Hasegawa et al. described a method to optimize the approach in terms of fuel efficiency and conducted optimization with constraints imposed upon flight procedure design by using genetic algorithm[3]. Soler et al. studied the 4D trajectory planning problem in a contrail sensitive environment. In their study, the aircraft from the initial fix to the final fix followed a horizontal route of waypoints while step climbing and descending in order to minimize the overall flying cost of fuel consumption, passenger travel time, and persistent contrail formation[4]. The trajectory flight cost was calculated using a performance database instead of classical equations of motion. The trajectory to be calculated was composed of climb, acceleration, cruise, descent, and deceleration. The influence of the crossover altitude during climb and descent, as well as step climbs in cruise, was considered. Murrietamendoza et al. performed Lagrange linear interpolations within discrete values of performance database to calculate the required values[5]. They focused on the analysis of errors between a flight trajectory prediction model and flight data; and compared a novel stochastic prediction flight model with the popular fly-by and fly-over turn models. Vasileios measured the propagated error using either spatial coordinates or angles[6]. Considering the real-time data, Xing et al. developed a flight profile based on the aircraft meteorological data relay and then generated the flight trajectory[7]. However, flight procedures had not been directly investigated. When an evaluation index system of flight procedure was preliminary constructed, a multilevel fuzzy comprehensive evaluation model of flight procedure was established. This model focused on the qualitative analysis of expert scoring, which could be easily influenced by subjective factors, and lacked a reliable mathematical basis[8]. Chen et al. proposed an evaluation index system of PBN flight procedure design schemes and developed a multi-attribute decision making model based on relative superiority degree. In their research, the optimal scheme was determined by finding the greatest relative superiority degree of alternatives[9]. In this method, noise influences and operation cost were selected as optimization objects. The decision variables and optimized function differential equations were constructed through discrete optimization to obtain the optimal track set of decision and state variables. Moreover, this method must accurately predict the initial solution[10]. It used an improved annealing algorithm to design the departure procedure, and the results showed that the multi-objects could not simultaneously achieve optimization[11]. The preceding research suffers some drawbacks: First, they mainly focused on the optimization and adjustment of flight procedure, without considering automatic optimal flight procedure design; Second, because of the single index of flight procedure design, safety, efficiency, simplicity, and noise influences have not been comprehensively considered in the procedure design system, and the quantitative indicators and procedure optimization design model were incomplete.
Therefore, we established a flight procedure optimization model with constraints of safety and noise, as well as optimization targets of efficiency and simplicity. An improved ant colony algorithm was then designed to solve the optimization problem. Finally, by considering the Lanzhou terminal airspace as the background, the departure trajectory was designed, and the analysis verified the feasibility and validity of the optimization model and solution algorithm.
1 Requirements of Departure Trajectory Design Modeling
Factors considered in the departure trajectory design were terrain- and obstacle-related features, terminal airspace situation, effect of aircraft operation on city planning and construction, aircraft category, flight performance, airborne electronic equipment, airport facilities, equipment security conditions, and navigation station layout. Designing departure trajectory should achieve a package of targets, from basic ones like aircraft safely flying over obstacles, pilots controlling the aircraft efficiently, and providing air traffic control service, to advanced ones like improving the efficiency of aircraft operation and the flight capacity of airport and terminal airspace, reducing the influence of noise, and protecting environment.
Among those requirements, safety, efficiency, simplicity, and noise limit are crucial. The trajectory near the obstacle must meet the requirements of corresponding avoidance. The noise level of the area around the airport should meet the acceptable limit, which implies that the implementation effect of a noise sensor cannot exceed the corresponding limits. In addition, other properties of aircraft flight constraints, namely the turning angle, minimum distance, and climb and descent gradients, should also be considered. Here, we select efficiency and simplicity as the final optimization targets.
2 Mathematical Model for Departure Trajectory Design
In this optimization framework, efficiency and simplicity are the optimization targets. Noise influence, performance limits and safety of aircraft are set as constraints.
2.1 Economy target
The base of the aircraft BADA model can be used for performance analysis of the aircraft full-flight phase, including the fuel flow rate of the aircraft climbing, cruising, and descending stages[12]. For turbo-jet engines, the unit thrust fuel consumption can be presented as a function of the aircraft′s airspeed during the climbing stage, and expressed as follows
(1)
whereCf1is the fuel consumption coefficient of the first unit thrust;Cf2the fuel consumption coefficient of the second unit thrust; and TAS the true airspeed of the aircraft (b).
The fuel consumption in unit time can be calculated in combination with the aircraft thrust in the flight profile climbing stage, that is, the climbing stage fuel flow rate
(2)
whereTis the single engine thrust of the aircraft in the climbing stage(kN).
In the level-off stage, the fuel flow rate of the single engine can be expressed as follows
(3)
whereCfcris the fuel flow factor in the level flight condition, which is dimensionless;Tthe aircraft unit engine thrust; andηcrthe fuel coefficient in the flying stage.
Cost index (CI) is the ratio of the flight time cost to fuel cost for a given segment, models, and so on, which comprehensively considers the flight mileage weight relationship between the cost and the time of flight to minimize the total operation cost, generally determined by the airlines, according to their own operating costs and flexible economic policy. CI is defined as the ratio of the time cost to fuel cost during the actual operation. Thus, CI can be expressed as follows (100 lb/h)
(4)
CF=T·Flow·PF
(5)
whereCFis the fuel cost andCTthe time cost,Tthe flight time, Flow the fuel flow rate, andPFthe fuel price.
The economic target of the departure trajectory should more clearly reflect the fuel and time costs of all aircraft operating conditions under traffic flow. Assuming CIs set by the flight management computer of the same aircraft category are the same, the categories are divided intonclasses, and the economic function of the departure trajectory is defined as
(6)
whereNi,Ti, Flowi, and CIiare the operating aircraft number, flight time, fuel flow rate, and CI of categoryi, respectively.
A flight departure trajectory can be divided into the climbing and level-off stages, assuming that the climbing stage number ism1, level-off stage number ism2, DISjis the flight distance of stagej, the corresponding TAS is TASj, and fuel flow rate is constant during climbing and level-off stage; then Flowican be further expressed as
(7)
2.2 Simplicity target
There has been no specific method and standard to define the simplicity of a departure trajectory; therefore, in this study, the dynamic density parameter was introduced to characterize simplicity, which represented the air traffic complexity. Dynamic, aircraft density, and conflict factors were defined as crucial factors that represented the air traffic complexity[13]. The dynamic factors can be concretely divided into aircraft heading change factors, aircraft altitude change factors, and aircraft speed change factors; density factors represent whether the horizontal or vertical interval between aircrafts meet the corresponding requirements; and conflict factors represent the prediction of potential conflicts between aircrafts in airspace. For the departure trajectory, the main factor affecting the simplicity is the dynamic density factor; the heading change, altitude change, and speed change factors are associated with the segment structure and flight number. AssumingN(t) is the number of operating aircrafts per time point andA(t),H(t), andS(t) are the number of aircraft altitude changes, aircraft heading changes, and aircraft speed changes, respectively, the simplicity function of the departure trajectory is defined as
(8)
whereWacis the weight of the altitude change factor, which implies that the altitude changes by more than 750 ft;Whcthe weight of the heading change factor, which implies that the heading changes by more than 15°; andWscthe weight of the speed change factor, which implies that the speed changes by more than 10 kt or Mach 0.02.
2.3 Safety constraints
Departure trajectory safety constraints can be based on the relevant provisions of a protection zone of the ICAO DOC8168 or FAA TERPS; while we considered the concept of the RNP in the ICAO DOC8168 as the safety standard.
A security area can be regarded as a region of space in the spatial distribution; the aircraft flight path constitutes the symmetric axis, and the reserve can be classified as primary and deputy districts according to the vertical distance deviating from the expected flight track. Moreover, a crucial parameter of area is width. Once the widths of the two anchor points on this segment are determined through forward and backward predictions, the width of the area on this segment can be calculated using linear interpolation. According to the navigation program design specification technical standards and the existing relevant operation practice, RNAV1, RNAV2, and RNP1 standards can be used in the departure terminal area; the half width RNP program area is determined as
1/2AW=2XTT+BV
(9)
whereBVis the system buffer value, which is estimated using the maximum offset beyond an alarm limit in the worst case, XTT the radius of a circle, representing a 95% confidence level tolerance, and the hypothetical radius is equal to the type of RNP.

where AWiis the half width of the protection area and MOCithe obstacle clearance related to the line segment.

(11)

(12)
whereris the turning radius,θethe turning angle,Rthe turning rate, and (xt,yt) the turning center point determined using the turning radius.
2.4 Noise limit constraints
According to the airport aircraft noise standard, considering noise sensitivity at night under the condition of traffic flow, a flight flying ten times during the daytime can be considered equal to one flight at night, this increases 10 dB of the noise of the corresponding sound exposure level (SEL) value at night as well as weighted processing. Thus the equivalent sound level A of daytime, that is, day and night (Ldn), can be obtained; day refers to the period from 6∶00 to 22∶00 and night from 22∶00 to 6∶00 the next day[14]
(13)
whereLAEijis the SEL,Ndijthe day sorties, andNnijthe night sorties when aircraftiis executing programjduring a flight.
For the departure trajectory design, the restricted range of the space flight program enveloping the surface must be determined to ensure that the flight navigation path does not intersect with the curved surface, that is, the designed flight track should not enter the restricted area. Therefore, when the plane and noise threshold are determined, the envelope surface can be further obtained as
C(x,y,z)=Ldn(x,y,z,N)-SLLi=0
i=1,2,3
(14)
The calculation of the SEL in single aircraft sorties is influenced by many factors including the thrust and speed of aircraft, shortest distance from the sensitive point to the track, and attenuation of noise. Because of the spatial omnidirectional attenuation characteristics of the aircraft noise, lower height, and stronger ability of noise energy absorption, the nearer the ground, the lower the noise level appears in restricted range for such a high limit standard; therefore, the formation of the limited noise range is a closed space curved surface body. Based on the physical properties of noise propagation, ideally despite considering uncertain factors such as ground noise attenuation, the restricted area of the program should be centered on the sensitive flight; the noise limits and noise propagation attenuation determine the radius of the formation of the space hemispheroid, forming the envelope surface as well as the spatial half spherical surface.

Fk∩Nk=0
(15)
2.5 Flight performance constraints
The minimum segment distance must meet the minimum stable distance between the waypoints; the minimum stable distancedsegis determined using the waypoint types, and the minimum distance constraint equation is
(16)
where WP is the waypoint set of the departure trajectory. The turning angle represents the heading change during the aircraft turning combined with the procedure design and actual operation of the radar control. To ensure operation safety in the terminal area, the highest change in the aircraft heading should generally be greater than 90° (continuous turning situation is not considered here); thus, the turning angle constraint equation is
(17)
The climbing and descending gradients represent the ratio of the increasing or decreasing aircraft height and the horizontal distance along the departure trajectory. In the procedure design, the gradient value in general should not be greater than 10%; thus, the climbing and descending gradient constraint equation is whereFKis the track point set.
(18)
3 Multi-objective Design of Departure Trajectory Based on PACA
Based on the basic ant colony algorithm optimization and Pareto optimization theory, and by considering the practical problems of the departure trajectory design model and using path planning optimization as a reference, Pareto ant colony algorithm(PACA) is proposed to solve the departure trajectory optimal design problem[15].
3.1 Space environment description
The method of abstracting the space environment of the departure trajectory design can be summarized as follows. Primarily, the terminal airspace is determined as the design space; this region mainly comprises the arrival and the departure points, location of the navigation facility, and location of the airport runway. Then, the space coordinate system is established with the runway center point as the origin. Moreover, without considering the effect of magnetic deviation,Xaxis indicates the east direction,Ythe north, andZperpendicular to the ground, indicates an upward direction. Finally, the space grid points are divided by the equidistant partition method. The three-dimensional space is separated into a point set, anda1(i,j,k) is the serial number coordinate anda2(xi,yi,zi) the position coordinate, wherei,j,kare the partition numbers alongX,Y, andZaxes, respectively.
3.2 Visual search space
To reduce the complexity of path planning, ants from the node can only reach next nodes surrounding it and cannot cross the middle node, which implies that the visual search space exists at any point.Lx,maxis the maximum moving distance alongXaxis per time,Ly,maxthe maximum horizontal moving distance alongYaxis per time, andLz,maxthe maximum vertical moving distance alongZaxis per time. Therefore, in the horizontal plane, assuming that the ant′s velocity direction is alongXaxis in current flight path pointOand considering the procedure turning angle restriction, the number of ant search nodes in the next step is not greater than 5, that is, pointsA,B,C,D, and E; similarly, in the vertical plane, assuming that the ant′s velocity direction is along Y axis in current flight path pointO, the number of ant search nodes in the next step is not greater than 3, that is, pointsM,N, andT. Visual search space of ant search is shown in Fig. 1.
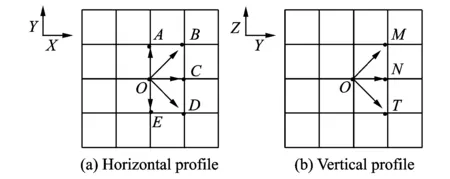
Fig.1 Visual search space of ant search
3.3 Pheromone updating
PACA can be categorized as one of the multi-objective single population ant colony algorithm. The number of pheromones iskbecause the number of optimization targets iskin the preceding model. In this paper,k=1, 2 represents economic target and simplicity target, respectively. Thus, τk(i,j) represents the pheromone vector. The target′s weight is distributed using the stochastic method in the structure of the initial feasible solution phase and it must satisfy the following equation
(19)
wherepkis the weight of targetk.
The pheromone is set at two arbitrary discrete track points, which constitute the flight path segment, and is updated after each ant has passed by. Pheromone can update locally and globaly. The pheromone is locally updated when an ant has completed a flight path search; the local updating equation is
(20)
where ρ0isthevolatilitycoefficientofthepheromonevectoranditmustsatisfy0<ρ0<1.
Whenallantshavecompletedasearch,thepathofthecurrentParetooptimalisscreened;onlythevalueofthepheromonevectorcorrespondingtotheoptimalpathisincreasedandtheequationis
(21)
whereΔτk(i,j) is the increment of the pheromone vector,Ma constant, and min(fk) the minimum value of the objective function when all ants have completed a path search. The global updating equation is
(22)
where ρ1istheupdatecoefficientofthepheromonevectoranditmustsatisfy0<ρ1<1.
3.4 Search strategy
The ants select the next path by using the pseudorandom-proportional rule according to the information of a different path. Once the probability to select the path is determined, the roulette method is used for the next flight path selection. Namely, a constantq0∈[0,1] is set and a random numberq∈[0,1] is generated. Ifq≤q0, the next path is selected according to Eq.(23); otherwise Eq.(24) is used. Eqs.(23), (24) are rewritten as
Pm(i,j)=
(23)
Pm(i,j)=
(24)

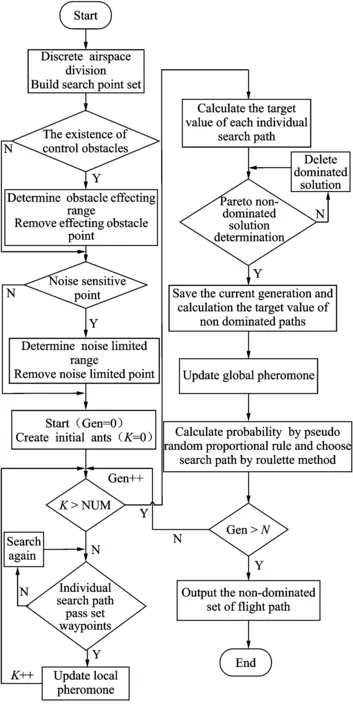
Fig.2 Flow chart of PACA
4 Example Analysis
The terminal airspace of Lanzhou ZhongChuan Airport was selected as the practical scenario for optimal designing departure trajectory. Fig.3 shows the topographic map of Lanzhou airport and city construction, as well as the obstacle information and noise sensitive points in the direction of ZGC-XIXAN. Considering factors such as the navigation signal coverage and standard of departure trajectory, in this example, ZGC001, ZGC002, and ZGC003 were the waypoints that must be crossed.
Space coordinate system was established as: The direction perpendicular to runway 36 and offside of the aircraft take-off was the positive direction ofXaxis; the direction along runway 36 and aircraft take-off was the positive direction ofYaxis, and the upward direction perpendicular to the ground and was the positive direction ofZaxis. On the basis of the airport runway center point elevation, the coordinate of each key point was determined after coordinate transformation and discretely simplified, as shown in Table 1.
Based on the range of the low approach control sector, the spatial range was 100 km×100 km and the vertical range is from 0 to 2 700 m.
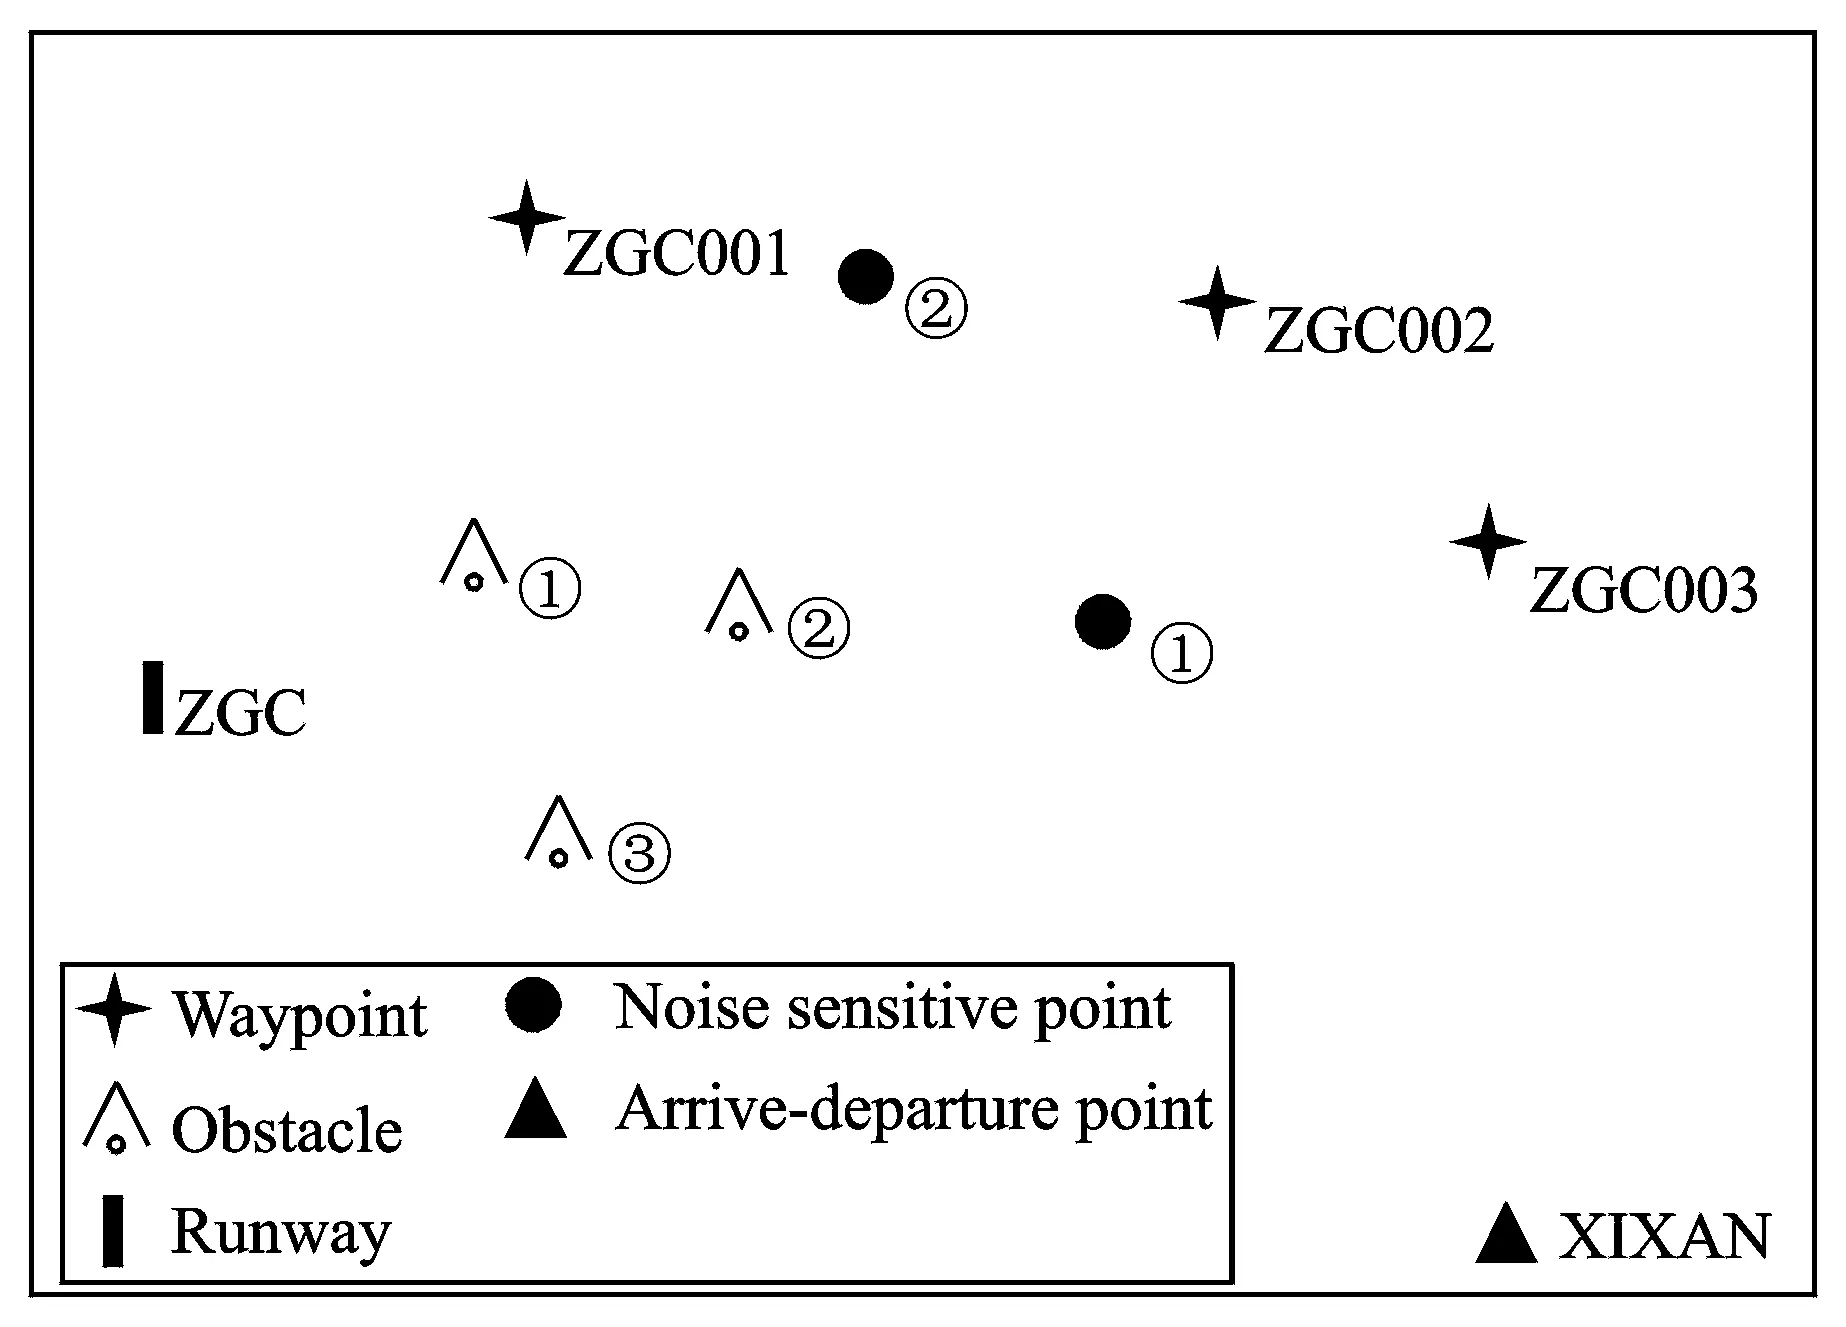
Fig.3 Schematic of the terminal airspace environment (ZGC-XIXAN)
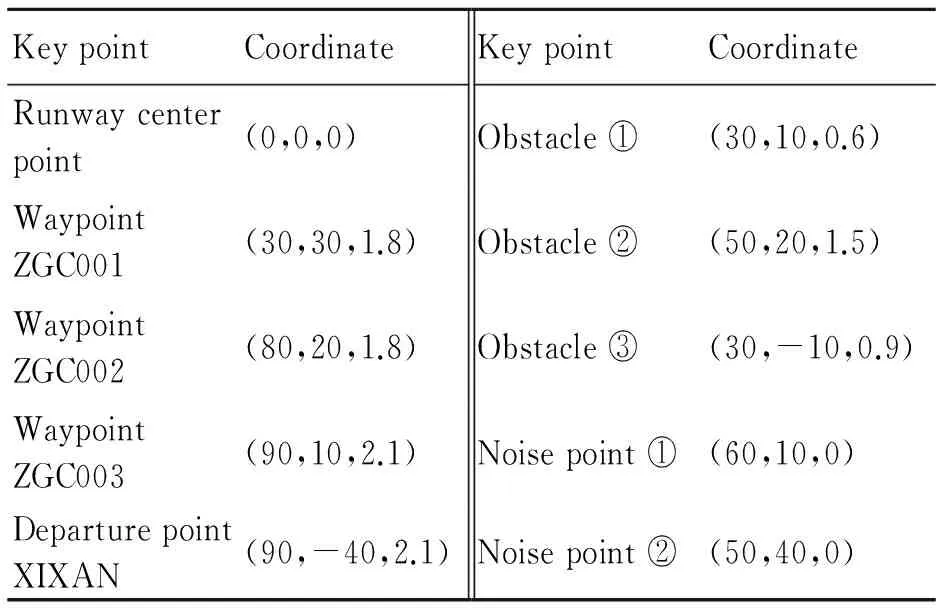
KeypointCoordinateKeypointCoordinateRunwaycenterpoint(0,0,0)Obstacle①(30,10,0.6)WaypointZGC001(30,30,1.8)Obstacle②(50,20,1.5)WaypointZGC002(80,20,1.8)Obstacle③(30,-10,0.9)WaypointZGC003(90,10,2.1)Noisepoint①(60,10,0)DeparturepointXIXAN(90,-40,2.1)Noisepoint②(50,40,0)
Considering the turning radius and climbing and descending rates, in this case, the levels ofXandYdirections were divided by 10 km and the level ofZaxis was divided by 300 m. The coordinate of the starting point of the departure trajectory is (0,0,0) and that of the ending point (9,4,7). According to the obstacle coordinate information in Fig.3 and Table 1, obstacles ① and ② in Table 1 became departure control obstacles because of the departure segment based on the RNP1 standard; thus, the width of the protection area was 5 nm and corresponding minimum obstacle clearance gradient is 0.8%.
According to Fig.3, the noise sensitive points ① and ② in Table 1 are mainly affected by the departure aircraft; based on the method of determining the noise limit area boundary[15], the surface equation of the noise sensitive points in the restricted area boundary is
(25)
Ignoring the effect of speed difference and on the basis of experience data, the B737 fuel flow rate of the climbing, cruising, and descending stages was approximately 6∶2∶1. The economic target of the departure trajectory can be simplified and represented as
(26)
whereSclimb,Scru, andSdesare the segment distances when the aircraft is climbing, cruising, and descending, respectively.
The Lanzhou approach sector′s operation simulation system developed in this study could simulate the aircraft operation and control measures. By using the simulation data and regression analysis method, the coefficients in the simplicity target were determined[16]. The equation of the simplicity target is
SC=1.852A(t)+1.563H(t)+1.654S(t)
(27)
whereA(t),H(t), andS(t) represent the number of aircraft altitude changes, aircraft heading changes, and aircraft speed changes, respectively.
PACA was used to solve the preceding departure trajectory problem in the XIXAN direction; the calculation parameters were set as follows: colony sizeK=20, initial path pheromone is 1, constant ratio of the pseudorandom numberq0=0.5, volatility coefficientρ0=0.1, update coefficientρ1=0.1, constantM=1 000, cumulative information weight parameterα=0.5, heuristic information weight parameterβ=0.5, and calculating generation Gen=100. The calculation and analysis of the departure trajectory in the XIXAN direction by using MATLAB are shown in Figs.4—6. The optimization results of the corresponding trajectory are shown in Table 2.
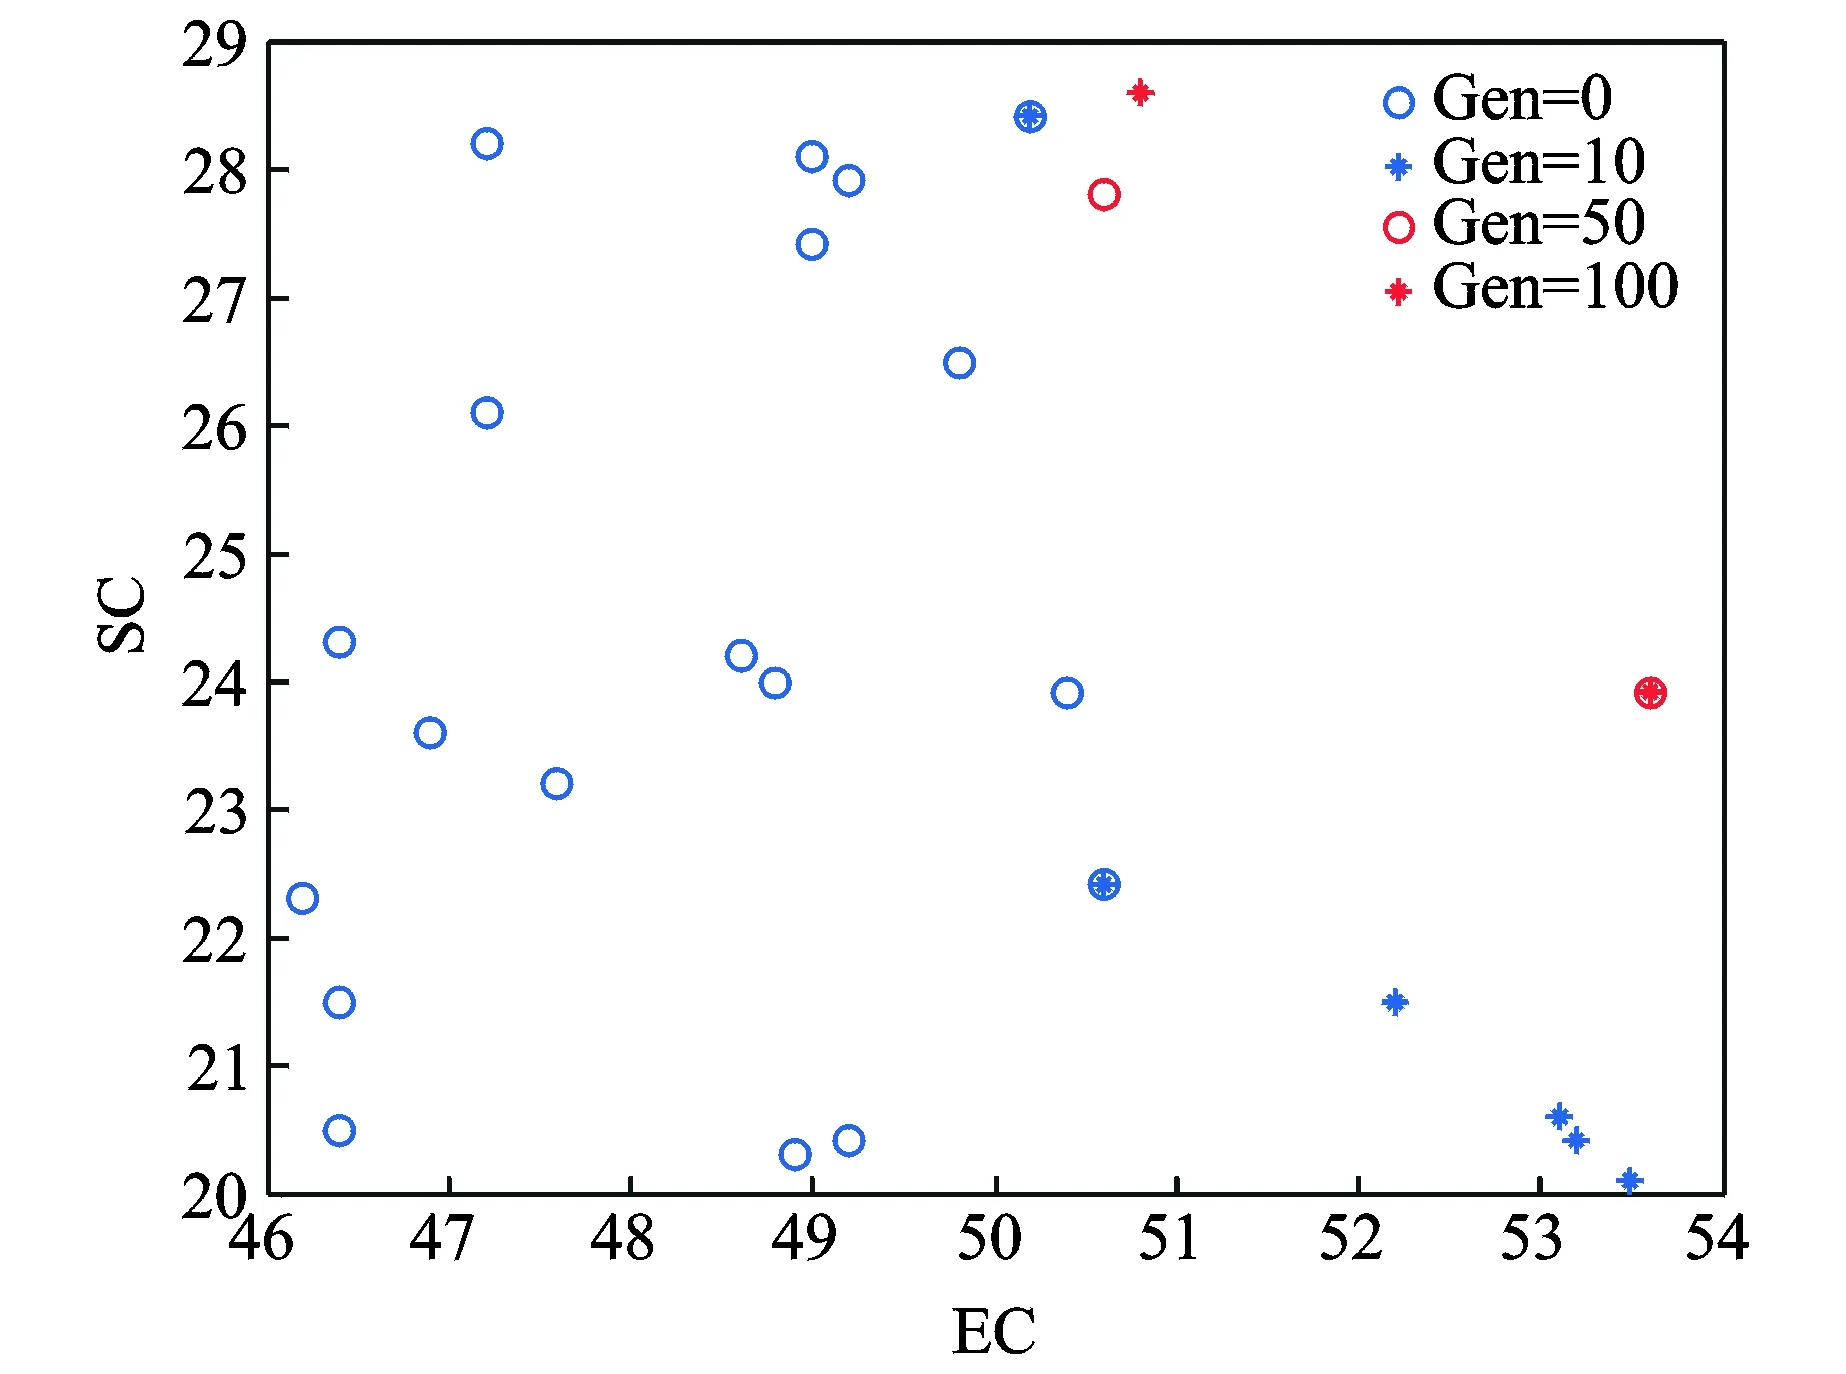
Fig.4 Schematic of the population distribution
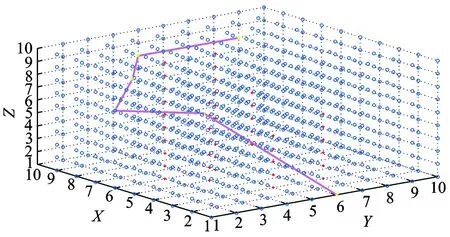
Fig.5 Departure trajectory ①
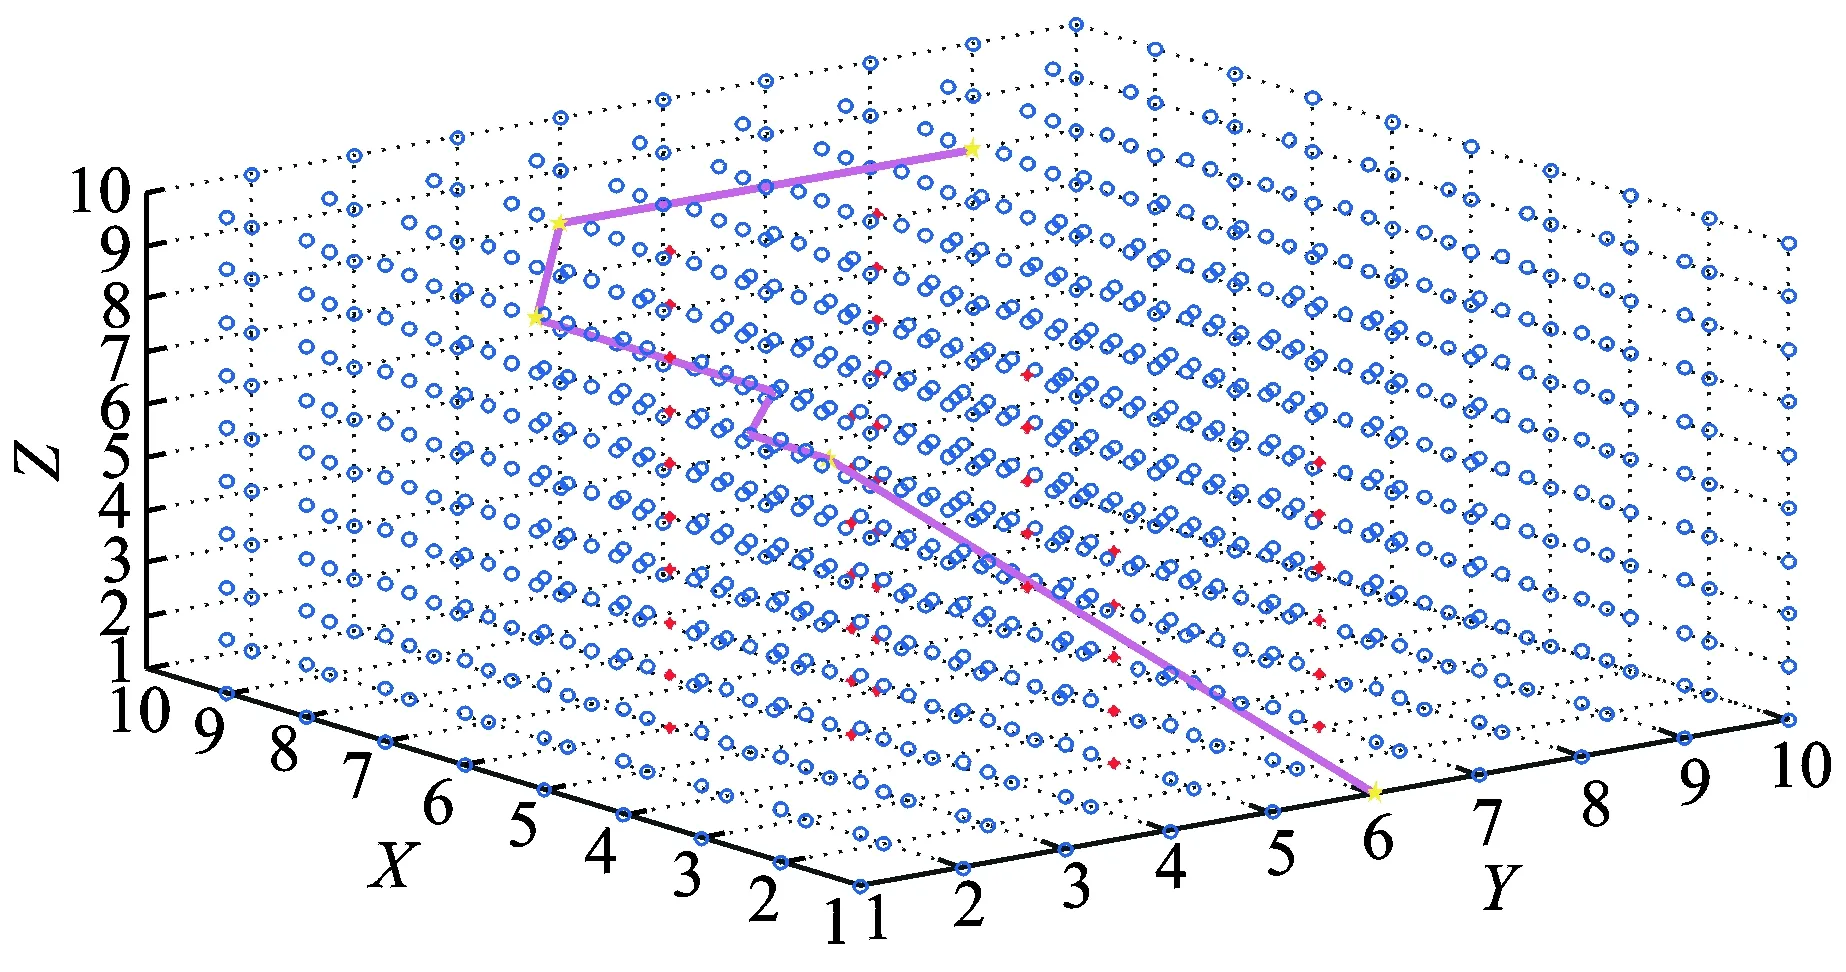
Fig.6 Departure trajectory ②

NumberECSC①53.623.9②50.828.6
The aircraft along the departure trajectory in the XIXAN direction must fly around the noise limited area mainly because of the effect of the noise sensitive points. Therefore, two types of departure trajectories were generated using the method of Pareto optimal solution. Table 2 shows the comparison of the optimization results, and the conclusions can be drawn as follows: The simplicity of the departure trajectory ① is the highest. From the intuitive point of view, the departure trajectory ① has the least number of heading changes, that is, the least number of aircraft turnings. The efficiency of the departure trajectory ② is the highest. From the intuitive point of view, the departure trajectory ② has the shortest fly distance around the noise limited regions, that is, it takes the least time to avoid the noise limited regions. Therefore, in the preceding two types of departure trajectories, both efficiency and simplicity targets have shown advantages and disadvantages. Pilots and air traffic controllers can make collaborative decisions based on practical situations and select the appropriate departure trajectory.
5 Conclusions
We proposed a departure trajectory design method based on PACA, which comprehensively considered safety, efficiency, simplicity, and noise influence. In this method, an optimization model of departure trajectory was established; safety and noise influence were set as constraints and efficiency and simplicity as optimization targets. Then, PACA was designed to solve the optimization problem. The results showed that PACA can solve optimization departure trajectory problems and obtain several better diversity Pareto optimal solutions, without requiring prior knowledge and dimensionless processing of the target. Many groups of departure trajectories are conducive to pilots and controllers to collaboratively make decisions using the different indices scientifically and rationally.
[1] ICAO. ICAO-Doc.8168-OPS/611 Procedures for air navigation services-aircraft operations[S]. Montreal, Canada: [s.n.], 2006.
[2] FAA. United States Standard for terminal instrument procedures (TERPS), Change 19[S]. Washington, USA: [s.n.], 2002.
[3] HASEGAWA T, TSUCHIYA T, MORI R. Optimization of approach trajectory considering the constraints imposed on flight procedure design[C]//2014 Asia-Pacific International Symposium on Aerospace Technology Conference. Shanghai: APISAT, 2015: 259-267.
[4] SOLER M, ZOU B, HANSEN M. Flight trajectory design in the presence of contrails: Application of a multiphase mixed-integer optimal control approach[J]. Transportation Research Part C Emerging Technologies, 2014,48:172-194.
[5] MURRIETAMENDOZA A, BOTEZ R M. Methodology for vertical-navigation flight-trajectory cost calculation using a performance database[J]. Journal of Aerospace Information Systems, 2015,12(8):519-532.
[6] VASILEIOS M. Error analysis of stochastic flight trajectory prediction models[J]. Journal of Applied Statistics, 2012,39(8):1-17.
[7] XING Jian, TANG Xinmin, HAN Songchen, et al. Method for generating flight profile based on ATMDAR data[J]. Journal of Nanjing University of Aeronautics & Astronautics, 2015,47(1):64-70. (in Chinese)
[8] WU Lei. Research on evaluation and optimization of instrument flight procedure[D]. Nanjing: Nanjing University of Aeronautics and Astronautics, 2008. (in Chinese)
[9] CHEN K. The optimum selection of instrument flight procedure design scheme based on the relative superiority degree[J]. Advanced Materials Research, 2011,255/256/257/258/259/260:4070-4074.
[10]KHARDI S, ABDALLAH L, KONOVALOVA O, et al. Optimal approach minimizing aircraft noise and fuel consumption[J]. Acta Acustica United with Acustica, 2010,96(1):68-75.
[11]WANG Chao, WANG Fei. Multi-objective intelligent optimization of noise abatement departure trajectory[J]. Journal of Southwest Jiao Tong University, 2013,48(1):147-153. (in Chinese)
[12]NUIC A. User manual for the base of aircraft data revision 3.8[R]. Brétigny-sur-Orge, France: EUROCONTROL Experiment Centre(EEC), 2010.
[13]CUMMINGS M L, TSONIS C. Deconstructing complexity in air traffic control[J]. Human Factors & Ergonomics Society Annual Meeting Proceedings, 2005,49(1):25-29.
[14]National Standard of the People′s Republic of China. GB9660—2013, Exposure draft: Standard of aircraft noise for environment around airport[S]. Beijing, China: [s.n.], 2013. (in Chinese)
[15]SHAO Z J, HE C, PEI J H. Multi-objective optimization design of vented cylindrical airbag cushioning system for unmanned aerial vehicle[J]. Transactions of Nanjing University of Aeronautics and Astronautics, 2016,33(2):208-215.
[16]WU Chenfang. Research of air traffic management based on dynamic capacity-flow coupling[D]. Nanjing: Nanjing University of Aeronautics and Astronautics, 2014. (in Chinese)
Dr. Sun Fanrong is currently a lecturer in Department of Air Traffic, Nanjing University of Aeronautics and Astronautics. His research interests are airspace planning and artificial intelligence.
Prof. Han Songchen is currently a professor in School of Aeronautics & Astronautics, Sichuan University. His research interests are air traffic management and airspace planning.
Mr. Qian Ge is currently an engineer in Department of Operation Control, China Eastern Airlines Jiangsu Co., Ltd. His research interests are airline operation control and flight procedure design.
(Executive Editor: Zhang Bei)
V355 Document code:A Article ID:1005-1120(2016)04-0451-10
*Corresponding author, E-mail address: sunfr@nuaa.edu.cn.
How to cite this article: Sun Fanrong, Han Songchen, Qian Ge. Departure trajectory design based on pareto ant colony algorithm[J]. Trans. Nanjing Univ. Aero. Astro., 2016,33(4):451-460.
http://dx.doi.org/10.16356/j.1005-1120.2016.04.451
杂志排行
Transactions of Nanjing University of Aeronautics and Astronautics的其它文章
- Identification of Information-Seeking Behaviors from Air Traffic Controllers′ Eye Movements
- Multi-objective Collaborative Optimization for Scheduling Aircraft Landing on Closely Spaced Parallel Runways Based on
- Air Traffic Operation Complexity Analysis Based on Metrics System
- Sectorization Model of Terminal Airspace with Arrival and Departure Separation
- A Test Method for the Static/Moving State of Targets Applied to Airport Surface Surveillance MLAT System
- Effects of Deck Motion and Ship Airwake on Ski-Jump Takeoff Performance of Carrier-Based Aircraft
