Identification of Information-Seeking Behaviors from Air Traffic Controllers′ Eye Movements
2016-11-21,,,,
,,,,
College of Civil Aviation, Nanjing University of Aeronautics and Astronautics, Nanjing 211106, P. R. China
Identification of Information-Seeking Behaviors from Air Traffic Controllers′ Eye Movements
WangYanjun*,LiuYinxin,CongWei,XuXinhua,HuMinghua
College of Civil Aviation, Nanjing University of Aeronautics and Astronautics, Nanjing 211106, P. R. China
(Received 18 March 2016; revised 2 June 2016; accepted 12 July 2016)
Air traffic controllers are the important parts of air traffic management system who are responsible for the safety and efficiency of the system. They make traffic management decisions based on information acquired from various sources. The understanding of their information seeking behaviors is still limited. We aim to identify controllers′ behavior through the examination of the correlations between controllers′ eye movements and air traffic. Sixteen air traffic controllers were invited to participate real-time simulation experiments, during which the data of their eye ball movements and air traffic were recorded. Tweny-three air traffic complexity metrics and six eye movements metrics were calculated to examine their relationships. Two correlational methods, Pearson′s correlation and Spearman′s correlation, were tested between every eye-traffic pair of metrics. The results indicate that controllers′ two kinds of information-seeking behaviors can be identified from their eye movements: Targets tracking, and confliction recognition. The study on controllers′ eye movements may contribute to the understanding of information-seeking mechanisms leading to the development of more intelligent automations in the future.
air traffic management; eye movements; Pearson correlations; air traffic controller
0 Introduction
Air traffic controllers are the person in the air traffic management (ATM) system who are in charge of managing aircraft traffic in the airport ground and in the air. The primary objective of their job is to ensure safe separations between aircraft by delivering instructions and clearances to the pilots. Although more and more advanced automations have been deployed into ATM system, controllers are always in the core of the system. As the final decision-maker and executor, the behaviors of controllers are closely linked with the system′s safety and efficiency. Therefore, the understanding of their behaviors is vital for the safety and improvement of the performance of ATM system.
There is a common consensus among engineers and researchers in ATM field controller′s mental workload is one of the main factors limiting airspace capacity. There are a great deal of research on measuring and predicting controller′s workload[1,2]. Among them, a prevalent approach is from psychological science. The earliest work was carried out by Schmidt using queuing theory to estimate the controller′s workload by examining controller′s routine work[3]. Models that aim to qualitatively analyze controller′s internal activities are developed by psychologists and cognitive scientists[4]. For example, Histon and Hansman have investigated underlying mechanisms used by controllers to mitigate cognitive complexity. They have found four types of structure-based abstraction: Standard flow, critical points, grouping, and responsibility[5]. Given the nature of human behavior, up until now, it is unable to quantitatively measure and predict controller′s workload correctly.
Another line of research focuses on the other side of the ATM system, e.g., air traffic and airspace activities. The main purpose is to understand the factors driving controllers′ mental workload[6-8]. Air traffic complexity and airspace complexity are the factors widely investigated as they are seen as the major factors affecting controller′s cognitive activities. There are many metrics derived from operational data or experimental data such as dynamic density, complexity map, etc., aiming to capture the intrinsic characteristics of air traffic[9-15]. Due to the nonlinear interaction between air traffic and controllers′ activities, it is hard to establish the quantitative relationships between workload and complexity measures.
Much previous efforts has been contributed to the analysis of air traffic controller′s communications, cognitive activities and mental workload[15]. Little has been devoted to their eye movements activities. The study of controllers′ eye movement has significant meaning since most of information controllers acquired is through their visual systems. Based on the information obtained from radar screen and communications with pilots, air traffic controllers estimate traffic situation and make control decision. With the advancement of technologies, decision support tools are placed in controllers′ work stations. Most of controllers′ work will be shifted to monitor all the automations operating functionally. Appropriate information seeking strategies will play a vital role in their daily operation, and they have to make sure that they can take back control if there is any automation failures occurred in the system[16-17].
In fact, there have been a huge amount of research works on eye movements from various disciplines, including psychology, ergonomics, usability research, and computer science etc[18-23]. In the ATM field, there is few work can be found on the analysis of controller′s eye movements. Ahlstrom and Friedman-Berg examined the correlations between controller′s eye movements and cognitive workload[24]. They found that eye movement measures can provide a more sensitive measure of workload as observed in numerous behavioral studies. In a recent study, an eye-tracking study was carried out at MITRE CAASD to evaluate the newly developed automation concept, relative position indicator (RPI)[25]. Two kinds of eye movements patterns among five levels of competence of controllers were reported[26].
With continuous efforts being devoted to the human factors in aviation and air traffic studies, there is a lack of research linking the two parts of ATM system, i.e. the human part and the physical part. In this paper, we examined the correlations between controller′s eye movements activities and air traffic activities. The objectives of this study were to investigate the information-seeking behavior and attention allocation behaviors.
1 Material and Methods
To obtain air traffic controllers′ eye movements data and the associated air traffic data, we invited 16 qualified air traffic controllers to participate human-in-the-loop simulations in the radar simulation lab at Nanjing University of Aeronautics and Astronautics in June, 2015. The real-time simulations lasted two weeks. During the simulations, controllers′ eye movements data were recorded with FaceLAB, while airspace data and air traffic data on flights′ trajectory were recorded by the simulation system automatically.
1.1 Participants
Sixteen air traffic controllers,15 males, one female, at the age of 22—33, volunteered to participate in this study (detailed information is given in Table 1). All of the controllers have qualified control licenses and they are responsible for approach control in Nanjing terminal airspace. The youngest controllers have two-year working experience, while the oldest have worked for 12 years. Controllers are qualified into five classes based on their working experience and personal competency. In this experiment, there is no Level-1 controller. The difference in controllers′ levels is out of concern of current study.
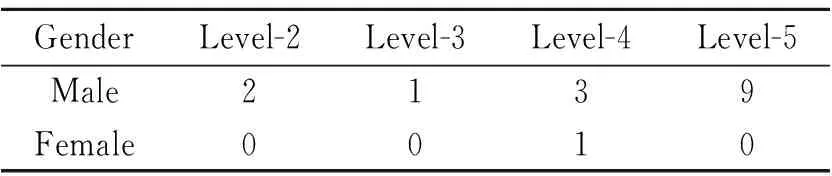
Table 1 The number of controllers in four levels
1.2 Equipment
During the simulation, FaceLAB 5.0 with automatic software was used to record participant′s eye movement. FaceLAB has been widely used in commercial, clinical and research applications, which can provide a high quality tracking without interfering the user environment.
The radar control simulation systems used in this study were air traffic control automation system produced by Nanjing Les Information Technology. The system performed high-fidelity simulation exercises. Both the functions and the interface at controller′s position were exactly the same as their working station in ATMB. The positions of each aircraft in terms of longitude, latitude, and altitude, were recorded in every 4 s by the simulation system, which were be used to calculate various traffic complexity metrics.
1.3 Procedures
The simulated airspace was sector ZHHH01AP of Wuhan approach. As shown in Fig. 1, the sector is responsible for all the arrival flights and departure flights in Wuhan terminal airspace. There are four major traffic flows entering and departing from Wuhan Tianhe International Airport. The main fixes are ZF, WTM, LKO, and XSH. Departure/arrival traffic from/to Wuhan airport are all through these fixes. Departure flow and arrival flow are not separated in the controlled airspace.
We prepared four levels of traffic scenarios based on the real flight schedule. Each controller participated two simulations. Every simulation exercise lasted about 30 min. Therefore we had 32 simulation exercises in total.
Before each simulation started, a brief introduction of the purpose of the study and the traffic scenario was given to the controller. The FaceLAB cameras were set up in front of controller′s keyboard in the middle of main radar screen. A precise model was built for each participant, and calibration was made before simulation started. All participants were allowed to have normal utilization of both arms and legs and permitted to wear eyeglasses for vision correction, as they were doing normal control job.

Fig.1 Airspace structure in Wuhan approach
1.4 Eye movement measure
The original data recorded by FaceLAB have to be processed using specific algorithms for further analysis of eye movement behavior. One of the most important algorithm is to determine fixation and saccadic. An algorithm mainly based on the velocity-threshold fixation identification (I-VT) algorithm was proposed here to extract fixation points from recorded data. I-VT algorithm has been widely used in lots of eye-tracking research. The brief idea is that angular velocity is used to distinguish fixation and saccade points. A crucial parameter, the velocity threshold, must be designated in advance, e.g. 120 °/s. The original time series data was first sorted according to the recorded time. Then, I-VT began by calculating point-to-point angular velocities for each point. The following rules were applied to distinguish fixation and saccade points: If the point′s angular velocity was less than the threshold, it was identified as fixation point; otherwise it was saccadic point. The process then collapsed consecutive fixation points into fixation groups and discarded saccade points.
Finally, I-VT output each fixation group represented by 〈x,y,t,d〉, wherexandyare the center of the points in a group,tis the time of the first point, anddthe duration of the fixation group.
Eye movement metrics can be calculated based on the fixation and saccadic data. Here, six eye movements measures were selected for analyses, including the average number of area of interest (AOI), average fixation duration, saccadic velocity, mean pupil diameter of left eye, mean pupil diameter of right eye and mean blinking rate. The areas of interest is defined as the clusters that many fixations appear close together, which might suggest that there are some kinds of stimuli in the proximity of these fixations that attracts attention[27].
1.5 Traffic metrics
There have been a huge number of research works on the study of air traffic complexity during the last decades. One line of research focuses on the identification of the quantifiable complexity variables or factors. Here, we selected the following 23 traffic-related complexity metrics to describe traffic behavior, based upon the previous work. These metrics can be directly calculated from flight trajectory data.
(1) Number of aircraft.
(2) Aircraft count divided by the capacity of the sector.
(3) Total controlled kilometers: The flight distance for all flights under control in the airspace unit.
(4) Mean controlled kilometers: The average flight distance for all flights under control in the airspace unit.
(5) Total controlled time: The flight time for all flights under control in the airspace unit.
(6) Mean controlled time: The average flight time for all flights under control in the airspace unit.
(7) Number of climbing aircraft.
(8) Number of cruising aircraft.
(9) Number of descending aircraft.
(10) Total climbing time.
(11) Total cruising time.
(12) Total descending time.
(13) Number of aircraft with heading change greater than 15 degrees.
(14) Number of aircraft with speed change greater than 10 knots.
(15) Number of aircraft with altitude change greater than 750 feet.
(16) Average velocity of aircraft.
(17) Number of aircraft with 3D Euclidean distance between 0—5 nm excluding violations.
(18) Number of aircraft with 3D Euclidean distance between 0—8 nm excluding violations.
(19) Number of aircraft with 3D Euclidean distance between 0—13 nm excluding violations.
(20) Minimal horizontal separation.
(21) Minimal vertical separation.
(22) Number of potential conflicts.
(23) Minimal time-to-go to conflict.
1.6 Correlation methods
To determine whether two set of random data is correlated or not, we chose the following two commonly used correlation methods: Pearson correlation and Spearman correlation.
(1) Pearson correlation
Pearson correlation coefficient is commonly used to examine the relationship between two random variables. In order to construct the time series data sets of eye movements and traffic comparable, we used 20 s as the sampling rate to recalculate eye movements metrics and traffic metrics.


ρij=
(1)
where ρ∈[-1,1].
(2) Spearman′s rank correlation
Another method employed here to measure correlation is Spearman′s rank correlation coefficient, which assesses how well the relationship between two variables from other perspective. Spearman′s rand correlation is appropriate for both continuous and discrete variables, including ordinal variables. In fact, Spearman′s correlation coefficient only considers the ranking of the variables in the time series which is defined as the Pearson correlation coefficient between the ranked variables. Thus, Spearman′s coefficient can be used to evaluate the non-linear correlations between the two time series.
The calculation of Spearman′s correlation coefficient can be described as follows. First, rank the time seriesxin ascending order: Xi,i∈1,2,…,n and then let their locations Rankxijrepresent the location of the elementiin the time seriesj. For the time seriesY, Yi,i∈1,2,…,n, the Rankyijstands for location of the elementiin the time seriesj. The Spearman′s correlation coefficient for time series can be computed as
(2)
where di=Rankxij-Rankyijand ρ∈[-1,1].
2 Analytical Results
Thirty-two simulation datasets were constructed with each dataset containing eye movement data and 4D trajectory data. Each dataset was about 20 min. The sampling rate of eye movements data was 16 ms, while the sampling rate of traffic data was 4 s. Therefore, the eye movement data were aggregated to 4 s in order to make two types of time series data sharing the same data points. Based on the methods described above, we calculated all the correlation coefficients, both Pearson coefficient and Spearman′s coefficient, between eye movements measures and traffic measures. Fig.2 shows an example of Pearson′s correlation results of a controller for all the eye movements behavior and traffic complexity. It can be seen from the Fig.2, fixation duration and saccadic velocity are correlated with most of traffic metrics compared to other eye movements metrics. The rest of the datasets show the similar results as well. Saccadic velocity is related to the ability of acquiring information, while fixation is interpreted with attention allocation. Therefore, the rest of analysis will mainly focuses on these two metrics.

Fig.2 Pearson correlations between six eye movements metrics and 23 air traffic metrics colors represent the strenth Please be more spe cific
2.1 Target tracking
Pearson′s correlation can directly tell the linear relationships between two time series data. All the Pearson correlations between controllers′ eye movement metrics and traffic metrics were examined. It was hard to find that regular correlations among all the combinations of controller-traffic behavior. However, one interesting result were identified that for over 93% controllers, the mean saccadic velocity were closely correlated with two traffic metrics: The mean velocity of aircraft (positive correlated), and the number of aircraft in the sector (negative correlated). Fig.3 depicts Pearson′s correlations in detail.
Cognitive studies suggest that saccadic velocity reflects the capability of dealing with complex tasks. Hence, saccadic velocity of controllers′ eyeball reflects their ability of management air traffic. The mean saccadic velocity and the total number of aircraft in the sector exhibit negative correlations as shown in Fig.3. To ensure the safety of flights in the sector, controller has to maintain a vivid picture of traffic in mind. They have to know the status of each aircraft in order to estimate future traffic situation. More aircraft in the sector means more information shall be acquired by the controllers. There will be more targets to be tracked and memorized if there are more aircraft in the sector; Each aircraft has to be scanned by the controller in every short time period. Also, the difficulty to locate right target increases. Average time to recall flight information from work memory will increase as well, which means longer time on the target. In order to track the targets, controllers have to increase saccadic speed. In contrast, there will be less targets to follow if there are few aircraft in the sector. There will be no such hurry to scan flights, therefore the mean saccadic velocity will decrease. Therefore, the correlations between mean saccadic velocity and total number of aircraft in the sector are negative.
If the average speed of the aircraft in the sector becomes faster, controllers will feel more rand stress. It requires them to estimate traffic situation and make right decisions quicker. Normally, they will increase the frequency of scanning each flight in the sector in order to update necessary information, which may lead to faster saccadic velocity. There will be no need to faster saccadic speed if the average speed of flights in the sector is slow. Therefore, the mean saccadic velocity is positively correlated with the average speed of aircraft in the sector.
There is no other eye movements-traffic pair showing regular phenomena except the above two pairs. Significant differences among controllers were found. For example, it is expected that the number of AOIs is positively correlated with the number of aircraft, as more aircraft in the sector means higher traffic density, which may result in more AOIs. However, our results showed that about 33% controllers had negative relationships between the number of AOIs and the number of aircraft,while 67% controllers had positive relationship.
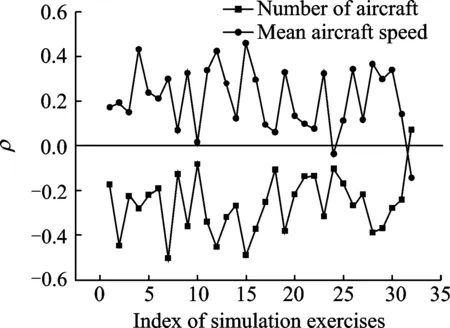
Fig.3 Pearson correlations between saccadic velocity and average aircraft velocity and number of aircraft in the sector
The statistical results show the obvious linear correlations during the target tracking activity. In order to further investigate the correlations between traffic activities and eye movement activities, we carried out Spearman′s rank correlations of all the eye-traffic measures. Comparing the Pearson correlation′s results, it was found that there did exist non-linear correlations between more eye movements metrics and traffic complexity metrics. Regarding target tracking, Spear-man′s rank correlations show similar patterns from the same eye-traffic metrics. In the following, we will discuss a detailed description of correlations from the rest two aspects: Conflict recognition and attention allocation.
2.2 Conflict recognition
Conflict recognition is vital in controllers′ activities since their major responsibility is to ensure the safety of air traffic. The capability to identify and resolve potential conflicts in the sector is essential for the experienced controllers. In our simulations, all the aircraft should maintain a minimum horizontal distance of 10 km (i.e. 5 nm) or a minimum of vertical distance of 300 m (i.e. 1 000 ft). Thus, the number of aircraft pairs within 3D Euclidean distance between 0—5 nm reflects the possibility of potential conflicts. In eye movements studies, longer fixations is indicating the difficulty of extracting information from a display. As shown in Fig.4, average duration on fixation is positively correlated with the number of aircraft pairs within 0—5 nm. More aircraft pairs within 0—55 nm, it requires controllers more time to evaluate potential conflicts. The difficulty to determine useful information increases,causing longer fixation.

Fig.4 Spearman correlations between the number of aircraft pairs with 3D distance between 0—5 nm and the mean fixation duration, the number of AOIs
The reason for the positive correlations between number of AOIs and the number of aircraft pairs within 5 nm shown in Fig.4 is that when the number of the aircraft with separation less than 5 nm increases, it is necessary to gather more information to resolve potential conflict. Therefore, controllers will pay more attention to more AOIs.
Compared with Pearson′s correlation results, these two eye-traffic measures exhibit a complete positive correlation trend. In spite of individual difference, all controllers behave similarly under different experiments. It can be drawn from the results that the number of aircraft pairs within 0—5 nm is a major factor affecting controllers′ conflict recognition activities. Longer fixations and more AOIs are needed if there are more pairs of aircraft within 0—5 nm.
3 Conclusions
This work aims to identify air traffic controllers′ behaviors from their eye movements, since most of information acquired by the controllers are through their visual systems. Human-in-the-loop simulations were carried out in order to obtained controllers′ eye movements data and traffic data. Building on previous research on eye movements and air traffic complexity, the correlations between controllers′ eye movements and air traffic activities were examined using Pearson correlations and Spearman′s rank correlations. It can be drawn from the initial results that two types of cognitive activities during the control process, i.e. targets tracking and conflict recognition, can be inferred from eye movements and traffic. Factors including the number of aircraft in the sector, the average speed of aircraft, and the number of aircraft within 0—5 nm, may have huge impact on controllers′ information-seeking behaviors. Continuous efforts will be devoted to examining other traffic factors that influence controller′s cognitive behaviors. This study offers a quantitative understanding of interactions between human part and physical part of ATM system, which may contribute to our understanding of human factors in other complex systems.
Acknowledgements
The authors are grateful to air traffic controllers from Air Traffic Management Bureau of Jiangsu Province for participating the experiments. We thank Daniel Delahaye from Ecole Nationale de l′ Aviation Civile for the discussion on Spearman′s rank correlations. This research was partially supported by the National Natural Science Foundation of China (No.61304190), the Fundamental Research Funds for the Central Universities (No.NJ20150030), and the Natural Science Foundation of Jiangsu Province of China (No.BK20130818).
[1] International Civil Aviation Organisation (ICAO).Doc 9574-manual on implementation of a 300 m (1 000 ft) vertical separation minimum between FL 290 and FL 410 inclusive[S]. Second ed. Montreal, Canada: International Civil Aviation Organisation (ICAO),2001.
[2] International Civil Aviation Organisation (ICAO).Doc 9803 - Line operations safety audit (LOSA)[S]. First ed. Montreal, Canada:International Civil Aviation Organisation (ICAO),2002.
[3] WIENER E L, NAGEL D C. Human factors in aviation[M]. U.S.A: Gulf Professional Publishing.1988.
[4] WHITEHOUSE A. The early birds: The wonders and heroics of the first decades of flight[M].U.S.A:Modern Literary Editions Publishing Company,1965.
[5] WIEGMANN D A, SHAPPELL S A. A human error approach to aviation accident analysis: The human factors analysis and classification system[M].UK:Ashgate Publishing, Ltd, 2012.
[6] DILLE J R, MORRIS E W. Human factors in general aviation accidents[R]. U.S.A: Federal Aviation Agency, Office of Aviation Medicine,1966.
[7] International Civil Aviation Organisation (ICAO). Doc 4444-Procedures for air navigation services: Air Traffic Management[S]. Fourteenth ed. Montreal, Canada: International Civil Aviation Organisation (ICAO), 2001.
[8] WENSVEEN J G. Air transportation: A management perspective[M].UK:Ashgate Publishing, 2012.
[9] MILDE M. International air Law and ICAO[M]. Netherland: Eleven International Publishing, 2008.
[10]SALVENDY G. Handbook of human factors and ergonomics[M]. U.S.A: John Wiley & Sons, 2012.
[11]EUROCONTROL. 1960—1970: Building the foundations[R]. Belgium, Brussels: The European organisation for the Safety of Air Navigation, 2011.
[12]EUROCONTROL. EUROCONTROL at 50: Reaching for the single europeansky[R]. Belgium, Brussels: European Organisation for the Safety of Air Navigation, 2010.
[13]BOEING.Statistical summary of commercial jet airplane accidents worldwide operations 1959—2012[R].U.S.A: Boeing Commercial Airplains, 2013.
[14]HOLLNAGEL E. The functional resonance analysis method (Epub) modelling complex socio-technical systems[M]. UK:Ashgate Publishing, 2012.
[15]German Federal Bureau of Aircraft Accidents Investigation(BFU). Investigation report: überlingenmid-air collision[R]. Germany: German Federal Bureau of Aircraft Accidents Investigation(BFU), 2004.
[16]JOHNSON C. Have we learned enough from überlingen: The challenges of safety improvement in European air traffic management[C]//Proceedings of the EUROCONTROL Annual Safety R&D SeminarKirwan (ed.).Southmpton, UK: EUROCONTROL, 2008.
[17]EUROCONTROL. EUROCONTROL guidelines: The ASM handbook-airspace management handbook for the application of the concept of the flexible use of airspace[R]. Brussels, Belgium: European Organisation for the Safety of Air Navigation, 2010.
[18]International Civil Aviation Organisation (ICAO). Doc 9854-Global air traffic management operational concept[S]. First ed. Montreal, Canada: International Civil Aviation Organisation (ICAO), 2005.
[19]STUDICM. A framework to assess the ability of automation to deliver capacity targets in European airspace[D]. London, UK: Imperial College London, 2015.
[20]ICAO 2002b. Global Air Navigation Plan for CNS/ATM Systems. Doc 9750. Second ed. Canada: Montreal: International Civil Aviation Organisation (ICAO).
[21]STEWART, C. 1965. Address before the graduating class. University of Southern California, Aerosp. Journal of Verbal Learning and Verbal behavio r, 11, 717-726.
Dr. Wang Yanjun is an associate professor of College of Civil Aviation of Nanjing University of Aeronautics and Astronautics. He received B.S. in Air Traffic Management and Dispatch and MS in Transportation Engineering from NUAA in 2004 and 2007 repsectively. He was a doctoral researcher at EUROCONTROL Experimental Center from 2009 to 2012, and received his Ph.D. in information and network science from Télécom ParisTech (ENST), France. He also holds an air traffic controller's license. His research interests cover human factors, complex system modeling and analysis.
Mr. Liu Yinxin is currently a postgraduate student at College of Civil Aviation, Nanjing University of Aeronautics and Astronautics. His research focus is human factors in aviation.
Mr. Cong Wei is currently a Ph.D. candidate in College of Civil Aviation, Nanjing University of Aeronautics and Astronautics (NUAA). He received his B.S. degree from the same university in 2011. His area of research includes air traffic performance evaluation and air traffic complexity theory.
Ms. Xu Xinhua is currently a postgraduate student at College of Civil Aviation, Nanjing University of Aeronautics and Astronautics. Her research focus is data analysis in aviation.
Prof. Hu Minghua is a professor and doctoral supervisor at the Civil Aviation College of Nanjing University of Aeronautics and Astronautics (NUAA), China. He is currently an expert of General Administration of Civil Aviation of China (CAAC) and a member of future national ATFM system panel.
(Executive Editor: Zhang Bei)
V355.1 Document code:A Article ID:1005-1120(2016)04-0433-09
*Corresponding author, E-mail address: ywang@nuaa.edu.cn.
How to cite this article: Wang Yanjun,Liu Yinxin, Cong Wei,et al. Identification of information-seeking behaviors from air traffic controllers′ eye movements[J]. Trans. Nanjing U. Aero. Astro., 2016,33(4):433-441.
http://dx.doi.org/10.16356/j.1005-1120.2016.04.433
杂志排行

Transactions of Nanjing University of Aeronautics and Astronautics的其它文章
- Evolution of Air Traffic Management Concept of Operations and Its Impact on the System Architecture
- A Hybrid Method Combining ImprovedK-means Algorithm with BADA Model for Generating Nominal Flight Profiles
- Optimization of Air Route Network Nodes to Avoid ″Three Areas″ Based on An Adaptive Ant Colony Algorithm
- Flight Schedule Recovery under Uncertain Airport Capacity
- Estimation of Standard Operation Time of Flight Legs Based on Clustering and Probability Analysis
- Effects of Deck Motion and Ship Airwake on Ski-Jump Takeoff Performance of Carrier-Based Aircraft