Microarray analysis of PBMC after Plasmodium falciparum infection: molecular insights into disease pathogenesis
2016-11-14WanChungHu
Wan-Chung Hu
Department of International Health, Johns Hopkins University School of Public Health; Division of Clinical Chinese Medicine, National Research Institute of Chinese Medicine, Beitou District, Taipei, 112, Taiwan
Microarray analysis of PBMC after Plasmodium falciparum infection: molecular insights into disease pathogenesis
Wan-Chung Hu*
Department of International Health, Johns Hopkins University School of Public Health; Division of Clinical Chinese Medicine, National Research Institute of Chinese Medicine, Beitou District, Taipei, 112, Taiwan
Accepted 15 March 2016
Available online 20 April 2016
Cerebral malaria
Metabolic acidosis
Anemia
Coagulopathy
Hypoglycemia
Fever
Objective: To fi nd out host gene expression profi les after malarial infection. Methods: Further time-course microarray analysis of peripheral blood mononuclear cells focusing on malaria pathogenesis was performed. Results: Up-regulation of coagulation-related genes, heat shock proteins, glycolytic enzymes, glucose transporters, and vacuolar H+-ATPases was found in acute febrile malaria. In early malaria, prior to detectable parasitemia, CD36 and ICAM1 were up-regulated. During acute malaria, there is correlation between IL-1β and heat shock proteins. CD163, a hemoglobin scavenger receptor, was up-regulated in acute malaria to potentially facilitate free hemoglobin up-take by leukocytes. In acute malaria, high MafB gene expression was negatively correlated with hemoglobin and platelet counts. Consistent with hemoglobin down-regulation, peripheral red blood cell counts tended to increase during acute malaria. Up-regulations of red blood cell and leucocyte binding mediators like CD36,ICAM1, thrombospondin, and thrombomodulin may contribute to the pathogenesis of cerebral malaria. Similarly, up-regulation of correlated glycolytic enzymes, glucose transporter and H+-ATPases may contribute to the hypoglycemia and metabolic acidosis frequently observed in serious malaria patients. Overall gender effects on gene expression profiles between male and female were not apparent, except for some hemoglobins were signifi cantly downregulated in male versus female, which suggesting males are prone to malaria-related anemia.
Conclusions: Leucocyte gene expression profi les can explain the pathogenesis of malarial complication such as fever, metabolic acidosis, hypoglycemia, anemia, and coagulopathy.
1. Introduction
Malaria pathogenesis needs to be understood better. Infection with Plasmodium falciparum (P. falciparum) malaria is generally associated with severe symptoms and complications, including high fever/chills and anemia. Additional complications can include cerebral malaria, hypoglycemia, metabolic acidosis, and coagulopathy, including thrombocytopenia[1-3]. At the molecular level, up-regulation of TNF-α and IL-1 are thought to be related to the high fevers frequently associated with malaria[4]. Malaria-related anemia cannot be explained solely by direct destruction of infected red blood cells (RBCs) by the malaria parasite. Bone marrow suppression and reduced amounts of available hemoglobulin may also contribute to the development of malaria-related anemia. Although high serum TNF-α levels correlate with the development of cerebral malaria[5], this complication may also be related to the increased adherence of RBCs or leukocytes to up-regulated integrins like CD36 and ICAM1, and may be related to coagulation proteins,like thrombospondin, being expressed on the surface of endothelial cells[6]. In addition, it has been postulated that the hypoglycemia and metabolic acidosis seen in some malaria patients may be due to a general up-regulation of host glycolysis after infection and that thrombocytopenia may be related to the destruction or decreased production of platelets during the acute stages of the disease[7]. In all cases, these models of malaria pathogenesis need further evaluation and development. Microarray analysis of gene expression profi les associated with the early, acute, and recovery stages of the malaria disease cycle may provide an excellent opportunity to further examine these events at the cellular and molecular level.
Microarray analysis is a very sensitive and newly developed tool to study genome-wide expression profi les in human subjects. In the current research, we examined transcriptional profi les in peripheral blood mononuclear cells (PBMCs) after P. falciparum infection in an eff ort to determine the extent to which these gene expression profi les may support current models of the molecular and biochemical basis of malaria pathogenesis. This research builds on previous studies from our laboratories in which microarray analysis was used to show that Toll-like receptor signaling, NF-κB, TNF-α, IFN-γ, IL-1β, p38 MAPK, MHC classⅠ&Ⅱmolecules, heat shock proteins, and glycolytic enzymes were significantly up-regulated after malaria infection[8]. The current studies confirm our previous findings using a diff erent analytical approach. Focusing on the correlation between patients’ clinical parameters, gene expression levels, and signifi cantly expressed genes may help to explain malaria-related complications. The results tend to support a malaria pathogenesis model in which malaria-related anemia and thrombocytopenia may be associated with up-regulation of the MafB gene, and metabolic acidosis and hypoglycemia with a general up-regulation of the genes coding for a number of glycolytic enzymes, glucose transporters and H+-ATPases. The results also suggest that cerebral malaria may be associated with an up-regulation of integrins, like CD36 and ICAM1,and coagulation factors, like thrombospondin and thrombomodulin,which may help set the stage for this very serious complication by increasing the adherence of RBCs and leucocytes to the vascular bed of the brain.
The rationale of this study is to fi nd out host-parasite interaction via functional genomics. Thus, malaria pathogenesis can be revealed for future malaria prevention and management. We can treat malaria related complications (anemia, high-peak fever, coagulopathy,hypoglycemia, metabolic acidosis) better by understanding falciparum malaria pathophysiology more. That is the signifi cance and importance of this study.
2. Materials and methods
2.1. Previous analysis
Two groups of study subjects were recruited, as described previously[8]. The study protocol was approved by the Institutional Review Board at the Johns Hopkins Bloomberg School of Public Health and the US Army Human Subjects Research Review Board. In the first study group, 22 subjects, 20 to 45 years of age, were recruited from the Walter Reed Army Institute of Research and experimentally infected with P. falciparum (3D7 strain) through the bites of laboratory-reared Anopheles stephensi mosquitoes infected with the malaria parasite[8]. Treatment was provided upon detection of parasitemia in peripheral blood smears from the subjects. Blood samples for microarray analysis were drawn during the un-infected baseline period (U) and following the fi rst detection of parasitemia(Ⅰ). This group was used to study the gene expression events associated with the early stages of malaria infection.
In the second study group, 15 adults 19 to 49 years of age with acute P. falciparum infection were recruited in Cameroon. At the time of study enrollment, they were all suff ering recurrent febrile episodes typical of acute malaria and they all had positive blood smears for P. falciparum. These subjects received at least one week of anti-malarial drug treatment with Artemisinin. Blood draws were performed during their acute infection period (A) and one month later during their remission period (R). During the remission period,physical exams and blood smears were performed to ensure that the subjects were recovering and were parasite free.
For subjects enrolled at the Walter Reed Army Institute of Research,PBMCs were separated from whole blood samples by Ficollgradient[8]. For subjects enrolled in Cameroon, blood was collected in CPT tubes (Becton-Dickinson, NJ, USA) and the PBMC’s were isolated after centrifugation. An RNA stabilizing reagent RNAlater(Ambion, CA, USA) was then added and the preserved samples were shipped to the USA on dry ice. Total RNA was extracted from both sets of samples by Trizol. The quality of sample RNA was assured by spectrometry (OD>1.8) and gel electrophoresis (Agilent,CA, USA).
2.2. Microarray preparations
Affymetrix U133A GeneChips (Affymetrix, Santa Clara, CA)were used in these experiments. The GeneChip contains 22 283 probe sets, including 14 500 well-known and characterized human genes and 18 400 transcripts. Before chip hybridization, a QIAGEN RNeasy cleanup kit was used to purify total RNA. Processing of templates for analysis on the Affymetrix U133A GeneChip was performed in accordance with methods described in the Aff ymetrix Technical Manual, Revision Three. Total RNA from the blood samples were hybridized into the arrays. Detailed cDNA preparation,in vitro transcription, staining, and scanning of Aff ymetrix U133A GeneChips were described previously[9].
2.3. Data analysis
GeneSpring software (Agilent, CA, USA) was used to perform one-way ANOVA tests and un-infected samples were taken as the baseline. GeneSpring’s default normalization was used. Signifi cant genes were selected if the false discovery rate was <0.05 and fold change was >1.5× or <0.66× when compared to uninfected baseline. The 1.5× fold change cut-off point was used in several previous microarray studies that explained these research results well[10-13]. Fisher’s exact test was performed to test the relationship between fever and selected gene expression. Gene-togene relationship and gene-to-clinical parameter relationship were assessed by Pearson’s correlation and Rank correlation.
Genes with greatest individual variation were analyzed by the following methods. Since subject 12 had the lowest variances of gene expression profi le in both acute malarial and remission stage, gene expression levels of each subject was normalized using subject 12 as the baseline denominator in acute malaria and remission period,respectively. Thus, genes with greatest individual variations can be explored in both acute febrile malaria and remission periods. The procedure was performed by using GeneSpring software (Agilent,CA, USA).
2.4. Microarray accession numbers
The Aff ymetrix data sets can be accessed at http://www.ncbi.nlm. nih.gov/geo/ under the accession number GSE5418.
2.5. Ethics
Written informed consent was provided by all study participants and/or their legal guardians. This research has been approved from Johns Hopkins University School of Public Health Institutional Review Board, US Army Human Subjects Research Review Board,and Cameroon Government Department of Health Institutional Review Board. Once samples were collected, de-link procedures were done to let each subject to be not identifying in this study by their names or addresses etc.
3. Results
According to the criteria of data analysis, a total of 2 894 genes were differentially expressed out of the 22 283 probe sets in Affymetrix U133A GeneChip. Patterns of gene expression were measured in subjects with pre-symptomatic early malaria and in individuals with acute febrile malaria. A baseline dataset derived from 22 uninfected US volunteers was used for comparison in samples from early malaria, acute febrile malaria, and remission stage. This baseline dataset is appropriate for the comparisons in the absence of data from malaria-naïve Cameroonian subjects, which, as indicated previously, would have been diffi cult to fi nd in this study population since this region of Cameroon is endemic for malaria and most adults would have had prior exposure to the parasite earlier in life. The correlation of the mean gene expression of baseline samples to the mean gene expression from 22 subjects in US volunteers and 15 subjects in Cameroonians, exceeded 97% indicating comparability of gene expression between samples collected at the Walter Reed Army Institute of Research and at the Johns Hopkins Bloomberg School of Public Health.
3.1. Gene expression in PBMCs during early malaria infection
In a previous study, our group found that several immune responserelated genes were up-regulated during early malaria infection. In this study, immune response gene regulation was further examined during the early stage of malaria infection. In general, a number of genes coding for surface receptors or integrins were up-regulated during early malaria infection (Figure 1A). Of these, ICAM1(CD54) showed the greatest degree of activation, with expression levels approximately 3-fold above baseline levels. In contrast, gene expression levels for other surface molecules, such as CD36, CD40,CD63 and CD157, were only 1.5× to 2× fold above baseline. Many chemokines were also found to be up-regulated during the early stages of malaria infection (Figure 1A). CXCL10 and CCL2 were the most significantly affected genes of this group with expression levels 3.5 to 5-fold above background levels (Figure 1A). As shown in the previous study, cytokine genes, such as TNF-α, IL-15, IFN-γ, and TGF-β, were also up-regulated in PBMCs during early malaria, with expression levels ranging between 1.5 to 2-fold above baseline[8]. As the disease progressed into its acute stage, expression levels of most of the CD, chemokines and cytokine genes returned to baseline levels. However, gene expression levels for IFN-γ and TGF-β continued to increase during the acute febrile stage of malaria.
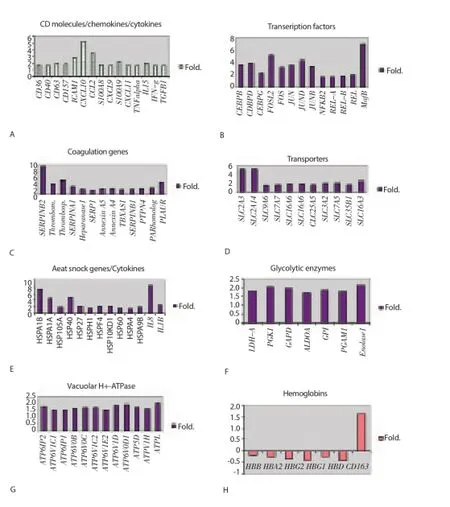
Figure 1. Gene expression levels in early and acute febrile malaria.Fold change in early malaria (Ⅰ) or acute febrile malaria (A) were compared to un-infection baseline (U) period.A: surface molecules,cytokine and chemokines up-regulation in early malaria. B: transcription factor up-regulation in acute malaria. C: coagulation-related genes up-regulation in acute malaria. D: transporter genes up-regulation in acute malaria. E: heat shock protein/cytokine genes up-regulation in acute malaria. F: glycolytic enzymes up-regulation in acute malaria. G: vacuolar H+-ATPases up-regulation in acute malaria. H: hemoglobin down-regulation in acute febrile malaria.
3.2. Gene expression in PBMCs during acute febrile malaria
3.2.1. Transcription factors expression during acute febrile malaria
Gene activity was signifi cantly increased during the acute febrile stage of malaria. Many genes with minimal to no detectable expression levels during the early pre-patent stage of illness were activated during the febrile and/or parasitemic stage of the disease. A large number of immune-related transcription factors were upregulated in the PBMC population during acute P. falciparum malaria (Figure 1B). Up-regulated gene families included MafB,CCAAT protein binding enhancers CEBP and CEBPD, and Fos-like antigen 2 (FOSL2) (Figure 1B). Expression levels in all these genes ranged between 3.5 and 7 fold above baseline (Figure 1B).
3.2.2. Coagulation-related genes during acute febrile malaria
As in the preceding gene analysis, a broad range of genes important in coagulation factor metabolism were also activated during acute malaria (Figure 1C). Expression levels for alpha-1-antitrypsin(SERPINA1), heparanase 1, serine protease1 (SERP1), Annexin A5, Annexin A4, thromboxane synthase 1, plasminogen activator inhibitor type 1 (SERPINB1), platelet activating receptor homolog(H963), plasminogen activator urokinase receptor (PLAUR), and megakaryocyte phosphatase (PTPN4) only approached 2-fold. However, expression levels for plasminogen activator inhibitor type 2(SERPINB2) were 9-fold above baseline; levels for thrombospondin 1, PLAUR and thrombomodulin were 4-fold and 3-fold above baseline, respectively (Figure 1C).
3.2.3. Transporter genes during acute febrile malaria
Consistent with the previous patterns of gene expression, many transporter genes were up-regulated during acute febrile malaria(Figure 1D). Most of the genes examined showed only marginal levels of activation (increases approximately 1.5 - 2-fold above baseline). These genes included SLC7A7 (cationic amino acid transporter), SLC16A6 (monocaboxylic acid transporter), SLC38A2(amino acid transporter), SLC25A5 (adenine nucleotide transporter),SLC3A2 (neutral amino acid transporter), SLC7A5 (cationic amino acid transporter), SLC35B1 (UDP-galactose transporter), and SLC16A3 (monocaboxylic acid transporter). In contrast, two glucose transporters, SLC2A3 and SLC2A14, showed signifi cantly higher levels of gene expression during this stage of the illness, with expression levels for both being 5-fold above baseline.
3.2.4. Heat shock protein and cytokine genes during acute febrile malaria
As may be expected with the onset of a major systemic febrile illness, many heat shock genes were up-regulated during the acute stage of malaria (Figure 1E). These heat shock proteins (HSP)included HSPA1B, HSPA1A, HSP105A, HSP40, HSP27, HSPH1,HSPF4, HSP60, HSPA4, and HSPA9B. It is worth noting that HSPA1B exhibited a greater than 7-fold increase in its expression level over background levels, while HSPA1A and HSP40 exhibited a greater than 4-fold increase in their expression levels. During the febrile stage of illness, two pro-infl ammatory cytokine genes were also found to be up-regulated: interleukin 8 (IL-8) and interleukin 1 beta (IL-1β). IL-8 exhibited a greater than 8-fold rise in activity,while IL-1β exhibited only a 2.5-fold increase in activity (Figure 1E).
3.2.5. Glycolytic enzymes and Vacuolar H+-ATPases during acute febrile malaria
As shown in Figure 1G and Figure 1H, the onset of the acute febrile phase of malaria was associated with a generalized low-level upregulation (1.5-2-fold increase in activity) of a large number of genes related to glycolysis and energy metabolism (H+-ATPases).
3.2.6. Hemoglobin genes during acute febrile malaria
In contrast to the data shown above, in which acute malaria has uniformly been associated with an up-regulation in gene activity, a number of genes involved in hemoglobin metabolism were found to be down-regulated during this stage of the disease (Figure 1H). These genes included hemoglobin alpha 1 (HBA1), hemoglobin alpha 2 (HBA2), hemoglobin beta (HBB), hemoglobin delta (HBD),hemoglobin gamma 1 (HBG1), and hemoglobin gamma 2 (HBG2). Activity levels in these genes were all 0.5- fold lower than baseline. Only CD163, a hemoglobin scavenger receptor, was up-regulated during the acute stage of illness (Figure 1H).
3.3. Genes with greatest individual variations
Individual variation of genes was analyzed in the acute and remission stages of malaria. Genes with highest subject-to-subject variances were identifi ed (Figure 2). Since subject 12 has the lowest variances of gene expression profiles in both acute malaria and remission stage, gene expression levels of all the other subjects were normalized using subject 12 as the baseline. Hemoglobin genes were the genes with highest variation in both acute and convalescent stage of malaria. In acute febrile malaria, genes with highest variances included HBB, HBA1, HBA2, HBG, HBD, thrombosondin 1, IL-1β,IL-8, thrombomodulin, and MHC class II DR alpha1. In the remission group, genes with highest variances included hemoglobin gamma,hemoglobin beta, hemoglobin delta, HBA1, HBA2, heat shock gene 70KD1B, heat shock gene 70KD1A, MHC class ⅡDR beta 4, heat shock gene 70KD6, heat shock gene 105KD1, MHC class Ⅱ DQ alpha1, IFN-γ, IL-1 receptor type Ⅱ, SERPINB2, CD36, MHC class Ⅱ DP alpha1, and MafB. These genes with highest variances between each patient might be related to the prognosis of malarial infection. Thus, these cited above genes were selected to find out gene-to-gene correlations and their relationship with malaria pathogenesis.
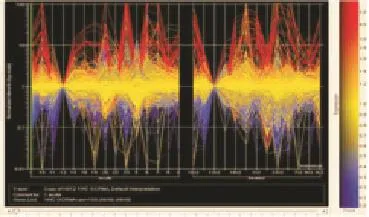
Figure 2. Genes with greatest individual variations were identifi ed.All subjects were normalized to subject 12 during acute febrile malaria and during their remission period. Genes with highest individual variations were red or blue-colored. No signifi cant subject-to-subject variances were noted in genes with yellow color. This analysis was done by GeneSpring software.
3.4. Gene-to-gene relationship and gene-to-clinical parameter relationship
The clinical manifestations and laboratory parameters associated with the acute and convalescent stages of malaria are well known[1]. As expected, a comparison of study subjects during acute illness and during remission or recovery periods indicated that, as a group,subjects during acute illness had higher body temperatures (37.68 ℃versus 36.88 ℃, P=0.003), lower platelet counts (120 750/μL versus152 000/μL, P=0.035) and elevated RBC levels (5 640 000/μL versus 5 020 000/μL, P=0.019) compared to individuals in the remission or recovery periods.
Based on these clinical and laboratory differences between disease stages, we attempted to assess the extent to which fever,platelet, and RBC counts may be related to specifi c gene expression levels summarized in Figure 1. Stratification of subjects by fever level revealed a gradient difference in expression levels for a number of inflammatory cytokine, heat shock and coagulation genes. As shown in Figure 3, expression levels for genes coding for HSP70KD1B, HSP70KD1A, HSP105, HSP40, IL8, IL-1β, SERPINB2, thrombomodulin, and thrombospondin 1 were highest among those subjects mounting the highest febrile responses to P. falciparum infection. Our data would be consistent with a model in which proinfl ammatory cytokines, like IL-8 and IL-1β, are thought to play a role in fever induction[14]. The study defined fever as a temperature of ≥ 37.5 ℃. Febrile subjects with temperatures at or above this threshold point tended to have higher expression levels for the cytokine, coagulation and heat shock protein genes shown in Table 1. Genes expression levels for IL-1β and IL-8 appeared to play an important role in modulating the fever, stress and coagulation responses associated with acute malaria since expression levels for heat shock genes HSPA1A, HSPA1B, HSP105, and HSP40 were found to correlate with IL-1β gene expression levels (Figure 4A). On the correlation between HSP40 and IL-1β gene expression levels is shown; similar results were obtained for HSPA1B (r=0.53,P=0.1), HSPA1A (r=0.74, P=0.01), and HSP105 (r=0.65, P=0.05). A strong positive correlation was also found between SERPINB2 gene expression and IL-1β or IL-8 expression (Figure 4B and Figure 4C). Rank correlation has been done for heat shock proteins and IL-1β and for SERPINB2 and cytokines. However, no significant fi ndings were found.
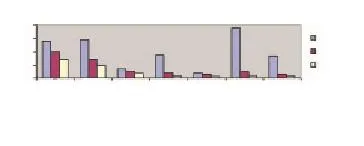
Figure 3. Relationship of fever level and gene expression in acute febrile malaria versus remission period.Upper fi ve means the fi ve patients who had the highest temperature and lower fi ve means lower the fi ve patients who have lowest temperature during the acute malaria stage.
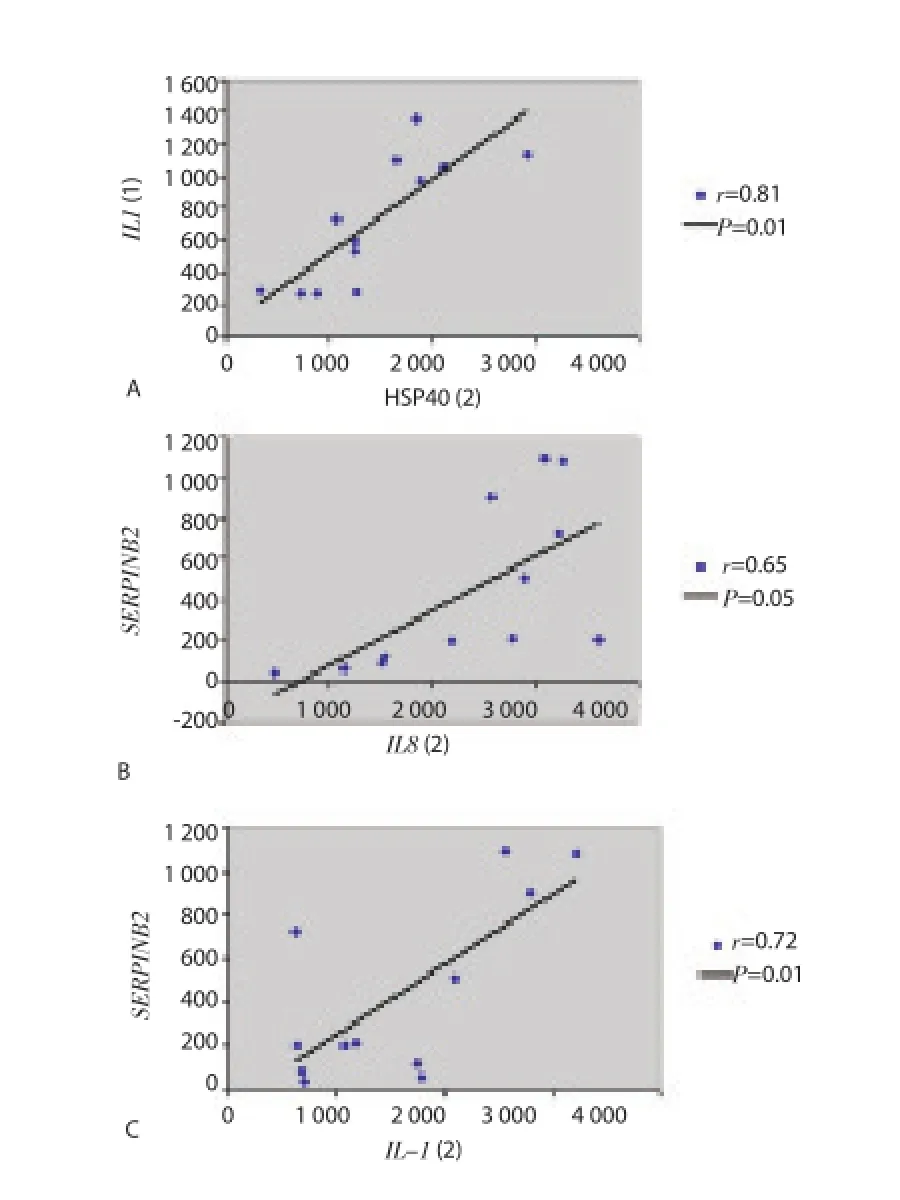
Figure 4. Correlation between IL-1β and heat shock protein and correlation between SERPINB2 and IL-1β or IL-8.A: positive correlation between HSP40 and IL-1β. Pearson’s correlation coeffi cient (r) and its P value (P) were calculated for the graph. B: positive correlation between SERPINB2 and IL-8. C: positive correlation between SERPINB2 and IL-1β. Pearson’s correlation coeffi cient (r) and its P value(P) were calculated for each graph.
During acute malaria, high MafB gene expression, a monocyte diff erentiation inducer, was found to be negatively correlated with down-regulation of hemoglobin formation and platelet counts(Figure 5A and Figure 5B). Rank correlations were done, but there were no significant findings between MafB and hemoglobins or platelet counts. Consistent with a down-regulation of hemoglobin expression, peripheral blood RBC counts tended to increase during the acute stage of the disease (5 640 000/μL versus 5 020 000/μL,P=0.019) (Table 2). Hypoglycemia and metabolic acidosis are severe complications of malaria infection; in our model, a general up-regulation of genes coding for glycolytic enzymes, glucose transporter and H+-ATPases may contribute to the hypoglycemia and metabolic acidosis observed in more seriously ill malaria patients.As shown in Figure 6 and Table 3, we found a positive correlation between elevated levels of glycolytic enzymes (PGK1, PGAM1,LDH-A, aldolase, and GAPDH) and vacuolar H+-ATPases.
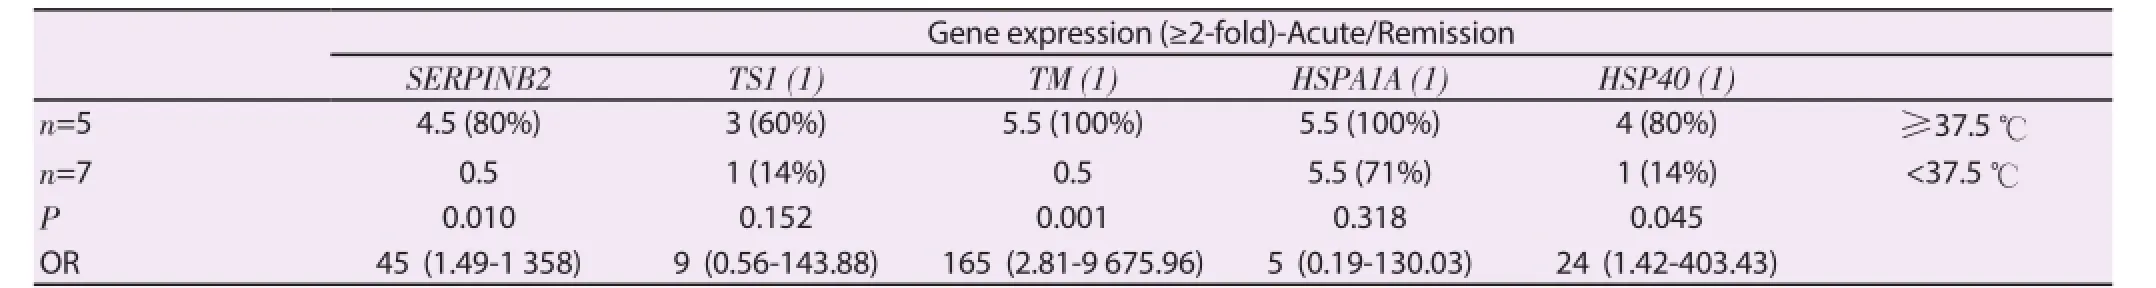
Table 1Relationship between fever and selected gene expression levels
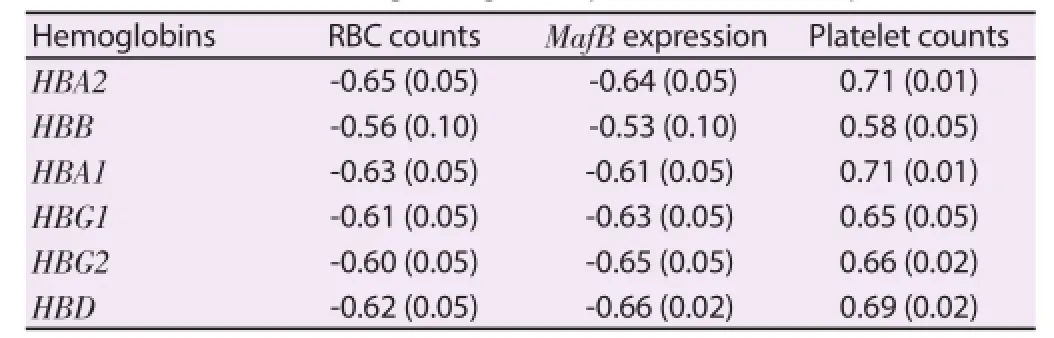
Table 2Correlation between hemoglobin gene expression levels and platelets, RBC.

Figure 5. Correlation between MafB and platelet counts or hemoglobin. A: negative correlation between platelet counts and MafB. B: negative correlation between HbA1 and MafB. Pearson’s correlation coeffi cient (r) and its P value (P) were calculated for each graph.
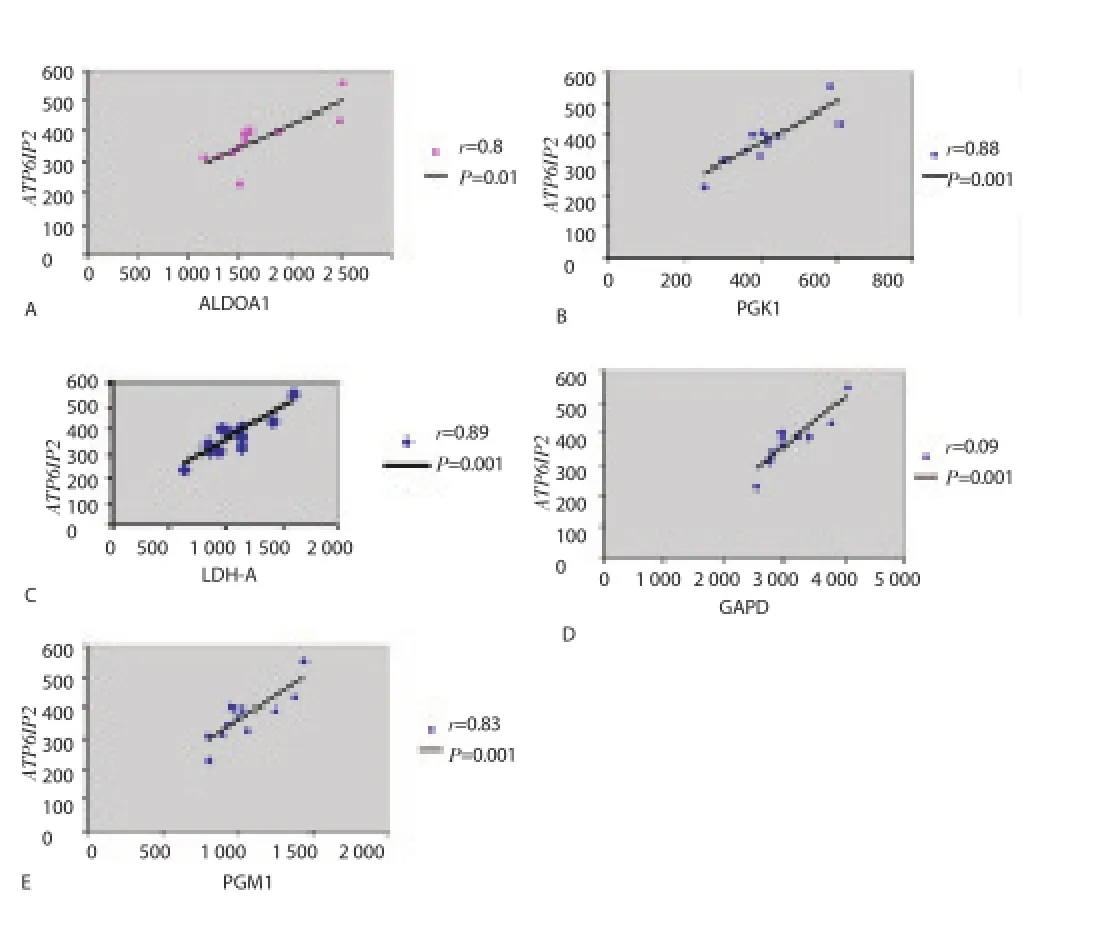
Figure 6. Correlation between glycolytic enzymes and vacuolar H+-ATPases. A: positive correlation between aldolase A and ATP6IP2 (Vacuolar H+-ATPase). B: positive correlation between PGK1 enzyme and ATP6IP2. C: positive correlation between LDH-A enzyme and ATP6IP2. D: positive correlation between GAPD enzyme and ATP6IP2. E: positive correlation between PGM1 enzyme and ATP6IP2. Pearson’s correlation coeffi cient (r)and its P value (P) were calculated for each graph.
3.5. Gene expression profiles in male versus female after malaria
Gene expression profiles in males compared to female were analyzed in un-infection period, early malaria, acute febrile malaria,and remission period. In male subjects, specifi c gene up-regulation included Y-linked ribosomal protein S4 (RPS4), Y-linked DEAD/ H box polypeptide (DBY), Y-linked eukaryotic translation initiation factor 1A (EIF1A), Y-linked SMCY homolog (Smcy) in acute febrile malaria, down-regulated genes in male subjects comparedto female subjects included HbB, HbA1, and activin A (Figure 7). It suggested that hemoglobin synthesis is down-regulated in male subjects compared to female subjects. Activin A is a subunit of female follicle-stimulating hormone releasing protein. Activin A itself is also an erythroid differentiation factor which can trigger hemoglobin synthesis. Activin A down-regulation in male patients may explain the down-regulation of hemoglobin alpha & beta in male adults. Pearson’s correlation also identified that there are positive correlations between activin A expression and expression of a number of hemoglobin genes including HbA, HbB, and HbG (Figure 8).
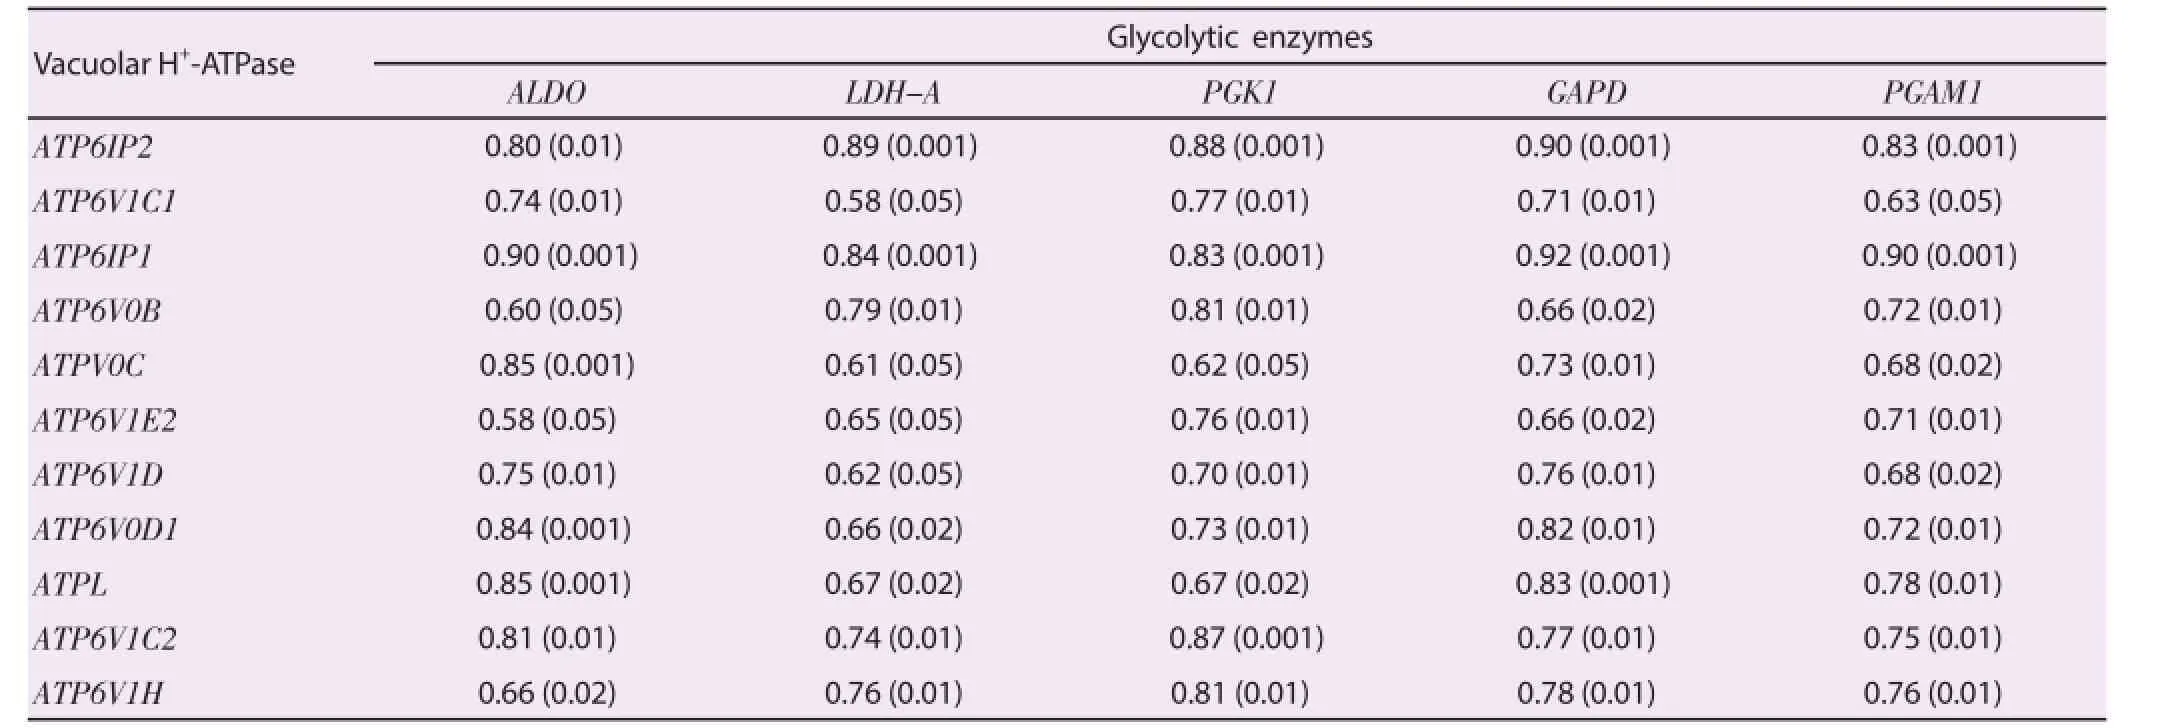
Table 3Correlation between glycolytic enzyme gene expression levels and vacuolar H+-ATPase gene expression levels.

Figure 7. Signifi cant expressed genes in male compared to female in acute febrile malaria.

Figure 8. Correlations between hemoglobins and activin A.A: positive correlation between HbA1 and activin A. B: positive correlation between HbB and activin A. C: positive correlation between hemoglobin G2and activin A. Pearson’s correlation coeffi cient (r) and its P value (P) were calculated for each graph.
4. Discussion
In a previous study, our laboratory used microarray gene profi ling to study gene expression levels in the same patient sample with malaria[8]. In this initial study, we found that the following genes were all signifi cantly up-regulated in acute febrile malaria compared to un-infected baseline expression levels: Toll-like receptor signaling genes, TNF-α, IFN-γ, IL-1β, MHC Ⅰ and Ⅱ genes, Fc receptors, proteasomes, heat shock genes, glycolytic enzyme genes, Fas-associated apoptosis genes, and P38 MAPK. In this more recent analysis, gene expression levels at diff erent time-points were analyzed compared to un-infected baseline levels in an eff ort to shift our focus to genes that were felt to be more related to malaria pathogenesis.
Because Cameroonians subjects in this study are living in an area of endemic for malaria; and thus are potentially continuously exposed to this parasite early in life, it is difficult to obtain samples from them during a truly un-infection period. Thus, PBMC’s drawn from US adult subjects were used prior to challenge with P. falciparum as baseline samples for gene expression comparisons during early,acute and convalescent malaria. Consequently, the 4 study time points in the study are sequential and complementary. Care should be taken not to over-interpret the results of these studies since the general health condition of the Cameroon individuals as well as their genetic polymorphism are likely to be diff erent from those of USA subjects.
Findings in this subsequent analysis were consistent with our previous results. We also found up-regulation of TNF-α, IL-1β, IFN-γ, heat shock proteins, and glycolytic enzymes. However,TNF-α, IL1-β, and IFN-γ up-regulation alone were not suffi cient to explain the malaria pathogenesis because these are similar in early malaria and acute febrile malaria. Other multiple factors that influence disease severity may include the magnitude (fold change versus baseline) of gene expression and the level of protein expression of inflammatory mediators. A previous study used a murine malaria model to study transcriptional profiling postinfection in spleenocytes[15]. The study found up-regulation of interferon-related genes and glycolytic genes and down-regulation of erythrocyte-related genes. The study results were consistent with and further confi rmed animal model observations. In this research, I used both Pearson’s correlation and Rank correlation to fi nd out gene-togene relationship. The results of Pearson’s correlation demonstrated that many significantly expressed genes after malaria infection may be related to malaria pathogenesis. Although there were no signifi cant fi ndings by using Rank correlation, Rank correlation is stricter than Pearson’s correlation. During data transformation from values to ranks, some important information might be lost during the transformation. Thus, Pearson’s correlation is more suitable for the correlation analysis in this study.
Genes with highest subject-to-subject variances were identifi ed. Genes with highest variations included hemoglobin genes,thrombospondin 1, IL-1β, IL-8, thrombomodulin, MHC molecules,heat shock proteins, IFN-γ, SERPINB2, CD36, and MafB. These genes and their relationship to malaria pathogenesis will be discussed later. Laboratory studies in our subjects showed that WBC counts and platelet counts were decreased in acute febrile malaria when compared to remission periods. It is also accepted that acute malaria can induce leukopenia, thrombocytopenia, and high fever[1,16-18]. The results showed that temperature can be a marker for disease severity. A temperature-dependent threshold eff ect was found on expression levels for several pro-infl ammatory cytokines, heat shock protein and coagulation genes. The elevated expression levels for both IL-8 and IL-1β during the acute stage of malaria may helpinduce the febrile response associated with this stage of the disease. The subjects with highest levels of IL-8 and IL-1β gene expression also had the highest febrile responses. High IL-8 and IL-1β gene expression levels were also found to correlate with higher expression of stress protein genes and genes coding for coagulation factors,particularly SERPINB2. These observations suggest that elevated gene expression levels for these cytokine, heat shock and coagulation factor genes, like SERPINAB2, may be sensitive molecular markers for disease severity. Further studies will be necessary to determine which, if any, of these genes expression profiles may be unique to malaria rather than a more general host response to systemic infection.
The fi ndings also suggest a molecular model for malaria-related anemia[19]. Based on our observation, hemoglobin genes were found to be down-regulated during acute febrile malaria, except for CD163, a hemoglobin scavenger receptor that could potentially facilitate free hemoglobin up-take by leukocytes in the peripheral blood. This fi nding is consistent with a previous study in mice which used microarray analysis to characterize transcriptional profiling in spleenocytes after malaria infection. Since hemoglobin is the major nutrient source for intraerythrotic protozoa, it is unlikely that malaria parasites down-regulate hemoglobin synthesis. It may be more reasonable to assume that the host down-regulates hemoglobin transcription to deprive the parasites of nutrients needed to support its growth and survival in hematopoietic cells, including RBC precursors. The suppression of hemoglobin gene activity that we observed in our study is consistent with this model.
Similarly, as the host down-regulates hemoglobin genes during the acute stage of malaria, one might also anticipate that the host would attempt to compensate for the decline in hemoglobin levels by initiating erythropoiesis (RBC proliferation) to produce more circulating RBCs. In my study, RBC counts were elevated among subjects in the acute stage of malaria. At the gene level, we saw an inverse correlation between RBC counts and hemoglobin gene expression levels. Thalassemia is a disease in which patients have a reduced capacity to produce normal hemoglobin, and thalessemia is found to have a protective effect against malaria infection. A previous study revealed that P. falciparum growth was impaired in thalassemic RBCs[20]. Consequently, an infected host may respond by inducing a transit thalessemia-like state to help fight against parasite infection through the production of small Maf proteins(MafB)[21,22]. In this study, MafB genes were significantly upregulated during acute malaria at a time when hemoglobin gene activity was uniformly suppressed. Up-regulated MafB may have contributed to the hemoglobin suppression observed. Enhanced MafB gene activity may also contribute to the thrombocytopenia (reduced platelet levels) seen in our subjects during acute malaria, since MafB can suppress hemoglobin expression and platelet synthesis at the same time[21,22]. During the remission or recovery period,erythrocyte and hemoglobin genes expression levels went back to normal. It is interesting to speculate that the host may use MafB to down-regulate hemoglobin expression as a means of protection after the onset of illness to limit the availabililty of this major source of parasite nutrients.
In animal studies, erythroid-associated gene expression levels were compared between lethal and non-lethal malarial strains in a mouse model[23]. These investigators found that erythroid-associated genes were down-regulated in the early stage of malaria infection, and the gene expression levels went up during recovery in non-lethal malaria. However, the erythroid-associated genes did not up-regulate in lethal malaria. Their work was consistent with my findings. In another microarray research, Griffi ths and colleagues[24] reported that erythroid-related genes were up-regulated in children after malaria infection. They found those erythrocyte-related genes were positively correlated with reticulocyte count and inversely correlated with hemoglobin concentration. Those up-regulated erythroid-related genes may refl ect RBC turnover in malaria infection. Their results were consistent with mine due to observed hemoglobin downregulation (bone marrow suppression) and RBC proliferation upregulation. We also found that gender may contribute to the risk of malaria-related anemia. Hemoglobin genes were down-regulated in male subjects compared to female subjects in acute febrile malaria. Down-regulated expression of hemoglobin genes in males were also correlated with down-regulated activin A gene expression, an erythroid diff erentiation factor, which is also a follicle-stimulating hormone releasing protein. Thus, activin A may play a role in hemoglobin synthesis in female subjects after malaria infection[25,26]Thus, female subjects are less likely to develop malaria-related anemia compared to male subjects because activin A may be upregulated in female after acute febrile malaria. The fi ndings fi t well with the observations made regarding erythropoisis in these previous studies and our fi ndings potentially give further insights into the molecular basis for the anemia so frequently seen during the acute stage of malaria infection.
Cytoadherence-induced cerebral malaria is a very severe, lifethreatening complication of malaria infection. In this combined dataset analysis, we observed that many coagulation-related genes were significantly expressed during acute febrile malaria. Additionally, during early malaria infection, we found CD36 and ICAM1 were significantly up-regulated in PBMCs. During acute febrile malaria, we found up-regulation of thrombomodulin,thrombospondin, PAF homolog, plasiminogen activator urokinase receptor, and SERPIN genes in PBMC. Previous studies demonstrated that CD36, ICAM1, thrombomodulin, and thrombospondin can bind and facilitate cytoadherence of malariainfected RBC to vascular endothelial cells[6,27]. CD36 and ICAM1 are membrane receptors that appeared on RBCs, WBCs, and endothelial cells. Elevated serum levels of soluble thrombomodulin and thrombospondin have been observed after P. falciparum malaria infection[28,29]. Since serum thrombomodulin and thrombospondin can bind to CD36, CD47, or ICAM1 receptors to form complexes,WBCs or malaria-infected RBCs can bind to endothelial cells to cause cytoadherence. If cytoadherence occurs in organs, except the spleen, malaria parasites can avoid destruction by macrophages. My fi ndings indicate that the genes coding for the these binding molecules can be significantly up-regulated during early and acute malaria infection and, thus, they may serve to enhance the cytoadherence properties of infected RBCs. As mentioned previously, increased cytoadherence of RBCs and WBCs contributes to the pathogenesis of cerebral malaria when this event occurs inthe vascular bed of the brain. If we can gain a better understanding of the coagulopathy of malaria, we may also be able to develop interventions that might help to reduce or eliminate the risk of cerebral malaria[30,31].
Hypoglycemia is also commonly observed in subjects suff ering from malaria[32]. Our fi ndings indicate that genes associated with glycolysis and glucose transport are elevated during the acute stage of the disease; these events may contribute to the development of a hypoglycemic state in infected individuals. P. falciparum infected RBCs show abnormally high permeability toward amino acids, sugars, purines, cations, and anions. My study found that many membrane transporter genes were up-regulated after host immune cells encountered malaria parasites. Notably, we found glucose transporters, SLC2A3 and SLC2A14, were substantially up-regulated; this could also help contribute to malaria- induced hypoglycemia.
Metabolic acidosis is a common complication of severe malaria infection[33]. Our results may explain the pathogenesis of metabolic acidosis after malaria infection. I found that many H+-ATPase genes were significantly up-regulated during acute febrile malaria. H+-ATPase, especially vacuolar H+-ATPase, can help extrude proton in mammalian cell plasma membranes [34]. Malaria infection upregulates glycolytic enzymes, and an up-regulated glycolytic pathway enhances intracellular lactic acid production. A previous study showed that glycolytic enzyme-aldolase can activate and up-regulate vacuolar H+-ATPase[35]. My fi ndings indicated strong correlation between vacuolar H+-ATPases and glycolytic enzymes. My findings also found a direct link between glycolysis and H+-ATPase. Up-regulated H+-ATPase may be due to a cellular mechanism to expel intracellular proton. Up-regulated H+-ATPase can cause severe proton accumulation in extracellular space to induce metabolic acidosis.
Caution in over-interpretation of the results should be avoided since the general health condition as well as the genetic background and history of prior malaria exposure are likely to be diff erent between Cameroonians and US volunteers. There are also several intrinsic limitations in microarray studies. It is hard to predict with certainty what levels of transcript change result in significant changes in the function of a gene product because this may be diff erent for individual proteins and depend on complex cellular interaction process. Changes in gene expression levels at the transcript level cannot directly predict the corresponding changes in the levels of proteins. Enhancing or reducing in total RNA detected on microarrays does not refl ect the downstream processes of protein synthesis, post-transcription modifi cation, and protein stability. RNA sampling at the given time point is a static measurement and may not completely capture patterns of gene expression that might be cyclical. Transcriptional profi les in this research were drawn from a mixed population of cells and cannot be attributed to a specifi c cell lineage. Relative levels of different cells (CD8 T cells, CD8 T cells, B cell, NK cells, monocytes) in the PBMCs could also have a significant impact on microarray results. Samples of this compartment refl ect the conditions in the periphery and not those in bone marrow, thymus, lymph nodes, or other infl ammation sites. In spite of these limitations, high density oligonucleotide microarrays off er a molecular insight into the immunity and pathogenesis of malarial infection.
Via studying the gene expression profiles of peripheral blood mononuclear cells, we can unveil the pathogenesis of malarial complications. Fever is related to heat shock protein up-regulation. Anemia is related to MafB up-regulation and hemoglobin downregulation. Cytoadherence and coagulopathy causing cerebral malaria is related to CD36, ICAM1, and thromospondin upregulation. Hypoglycemia is related to the up-regulation of glucose transporters (SLCs). Metabolic acidosis is related to the upregulation of glycolytic pathways and H+-ATPases.
In summary, microarray analysis can serve as a valuable tool to gain insights into the molecular basis for malaria pathogenesis. PBMCs from infected individuals appear to be a suitable cellular model for carrying out this type of molecular research. Based on the fi ndings presented in this report, gene expression data may prove to be extremely valuable in gaining a better understanding of the cellular,molecular and genomic events associated with the development of malaria-related fever, anemia, thrombocytopenia, hypoglycemia,cytoadherence, and metabolic acidosis.
Conflict of interest statement
The author declares that there is no confl ict of interest.
Acknowledgements
The author is thankful for Dr. Roger Moyou for his help of accessing patients in Cameroon. He also expresses great gratitude to Nau M, Arnold A, and Jedlicka A for expert technical assistance,Professor PC Huang, Professor August Louis Bourgeois and Professor Alan Scott for their assistance in writing this manuscript. Additional support was provided by the US Embassy Cameroon, the JHU Cameroon Program, and the government of Cameroon.
[1] Greenwood BM, Bojang K, Whitty CJ, Targett GA. Malaria. Lancet 2005; 365: 1487-1498.
[2] Wassmer SC, Taylor TE, Rathod PK, Mishra S, Mohanty S, Arevalo-Herrera M. Investigating the pathogenesis of severe malaria: a multidisciplinary and cross-geographical approach. Am J Trop Med Hyg 2015; 93(Suppl 3): 42-56.
[3] Manning L, Laman M, Davis WA, Davis TM. Clinical features and outcome in children with severe Plasmodium falciparum malaria: a metaanalysis. PloS one 2014; 9(2): e86737.
[4] Kwiatkowski D. Tumour necrosis factor, fever and fatality in falciparum malaria. Immunol Lett 1990; 25(1-3): 213-216.
[5] Wassmer SC, de Souza JB, Frere C, Candal FJ, Juhan-Vague I, Grau GE. TGF-beta1 released from activated platelets can induce TNF-stimulated human brain endothelium apoptosis: a new mechanism for microvascular lesion during cerebral malaria. J Immunol 2006; 176(2): 1180-1184.
[6] Cooke BM, Berendt AR, Craig AG, MacGregor J, Newbold CI, Nash GB. Rolling and stationary cytoadhesion of red blood cells parasitized by Plasmodium falciparum: separate roles for ICAM-1, CD36 and thrombospondin. Br J Haematol 1994; 87(1): 162-170.
[7] Clark IA, Cowden WB. The pathophysiology of falciparum malaria. Pharmacol Ther 2003; 99(2): 221-260.
[8] Ockenhouse CF, Hu WC, Kester KE, Cummings JF, Stewart A, Heppner DG. Common and divergent immune response signaling pathways discovered in peripheral blood mononuclear cell gene expression patterns in presymptomatic and clinically apparent malaria. Infect Immun 2006;74(10): 5561-5573.
[9] Irizarry RA, Warren D, Spencer F, Kim IF, Biswal S, Frank BC, et al. Multiple-laboratory comparison of microarray platforms. Nat Methods 2005; 2(5): 345-350.
[10] Ning W, Li CJ, Kaminski N, Feghali-Bostwick CA, Alber SM, Di YP,et al. Comprehensive gene expression profi les reveal pathways related to the pathogenesis of chronic obstructive pulmonary disease. Proc Natl Acad Sci U S A 2004; 101(41): 14895-14900.
[11] Zhu G, Reynolds L, Crnogorac-Jurcevic T, Gillett CE, Dublin EA,Marshall JF, et al. Combination of microdissection and microarray analysis to identify gene expression changes between differentially located tumour cells in breast cancer. Oncogene 2003; 22: 3742-3748.
[12] Smoot LM, Smoot JC, Graham MR, Somerville GA, Sturdevant DE,Migliaccio CAL, et al. Global diff erential gene expression in response to growth temperature alteration in group A Streptococcus. Proc Natl Acad Sci U S A 2001; 98(18): 10416-10421.
[13] Coussens PM, Colvin CJ, Wiersma K, Abouzied A, Sipkovsky S. Gene expression profi ling of peripheral blood mononuclear cells from cattle infected with Mycobacterium paratuberculosis. Infect Immun 2002; 70(10): 5494-5502.
[14] Zampronio AR, Souza GE, Silva CA, Cunha FQ, Ferreira SH. Interleukin-8 induces fever by a prostaglandin-independent mechanism. Am J Physiol 1994; 266(5 Pt 2): R1670-1674.
[15] Sexton AC, Good RT, Hansen DS, D' Ombrain MC, Buckingham L, Simpson K, et al. Transcriptional profiling reveals suppressed erythropoiesis, up-regulated glycolysis, and interferon-associated responses in murine malaria. J Infect Dis 2004; 189(7): 1245-1256.
[16] Pastore S, Vuch J, Bianco AM, Taddio A, Tommasini A. Fever tree revisited: From malaria to autoinflammatory diseases. World J Clin Pediatr 2015; 4(4): 106-112.
[17] Hanson J, Phu NH, Hasan MU, Charunwatthana P, Plewes K, Maude RJ,et al. The clinical implications of thrombocytopenia in adults with severe falciparum malaria: a retrospective analysis. BMC Med 2015; 13: 97.
[18] Lacerda MV, Mourao MP, Coelho HC, Santos JB. Thrombocytopenia in malaria: who cares? Memorias do Instituto Oswaldo Cruz 2011; 106(Suppl 1): 52-63.
[19] Lamikanra AA, Merryweather-Clarke AT, Tipping AJ, Roberts DJ. Distinct mechanisms of inadequate erythropoiesis induced by tumor necrosis factor alpha or malarial pigment. PloS One 2015; 10(3): e0119836.
[20] Wambua S, Mwangi TW, Kortok M, Uyoga SM, Macharia AW,Mwacharo JK, et al. The eff ect of alpha+-thalassaemia on the incidence of malaria and other diseases in children living on the coast of Kenya. PLoS Med 2006; 3(5): e158.
[21] Sieweke MH, Tekotte H, Frampton J, Graf T. MafB is an interaction partner and repressor of Ets-1 that inhibits erythroid diff erentiation. Cell 1996; 85(1): 49-60.
[22] Motohashi H, Katsuoka F, Shavit JA, Engel JD, Yamamoto M. Positive or negative MARE-dependent transcriptional regulation is determined by the abundance of small Maf proteins. Cell 2000; 103(6): 865-875.
[23] Schaecher K, Kumar S, Yadava A, Vahey M, Ockenhouse CF. Genomewide expression profiling in malaria infection reveals transcriptional changes associated with lethal and nonlethal outcomes. Infect Immun 2005; 73(9): 6091-6100.
[24] Griffi ths MJ, Shafi MJ, Popper SJ, Hemingway CA, Kortok MM, Wathen A, et al. Genomewide analysis of the host response to malaria in Kenyan children. J Infect Dis 2005; 191(10): 1599-1611.
[25] Shao L, Frigon NL, Jr., Young AL, Yu AL, Mathews LS, Vaughan J, et al. Eff ect of activin A on globin gene expression in purifi ed human erythroid progenitors. Blood 1992; 79(3): 773-781.
[26] Murata M, Eto Y, Shibai H, Sakai M, Muramatsu M. Erythroid diff erentiation factor is encoded by the same mRNA as that of the inhibin beta A chain. Proc Natl Acad Sci U S A 1988; 85(8): 2434-2438.
[27] Rabhi-Sabile S, Steiner-Mosonyi M, Pollefeyt S, Collen D, Pouvelle B,Gysin J, et al. Plasmodium falciparum-infected erythrocytes: a mutational analysis of cytoadherence via murine thrombomodulin. Thromb Haemost 1999; 81(5): 815-821.
[28] Hemmer CJ, Bierhaus A, von Riedesel J, Gabat S, Liliensiek B, Pitronik P, et al. Elevated thrombomodulin plasma levels as a result of endothelial involvement in Plasmodium falciparum malaria. Thromb Haemost 1994;72(3): 457-464.
[29] Urban BC, Ferguson DJ, Pain A, Willcox N, Plebanski M, Austyn JM, et al. Plasmodium falciparum-infected erythrocytes modulate the maturation of dendritic cells. Nature 1999; 400(6739): 73-77.
[30] Ramos TN, Bullard DC, Darley MM, McDonald K, Crawford DF,Barnum SR. Experimental cerebral malaria develops independently of endothelial expression of intercellular adhesion molecule-1 (icam-1). J Bio Chem 2013; 288(16): 10962-10966.
[31] Sahu PK, Satpathi S, Behera PK, Mishra SK, Mohanty S, Wassmer SC. Pathogenesis of cerebral malaria: new diagnostic tools, biomarkers, and therapeutic approaches. Front Cell Infect Microbiol 2015; 5: 75.
[32] Madrid L, Lanaspa M, Maculuve SA, Bassat Q. Malaria-associated hypoglycaemia in children. Expert Rev Anti Infect Ther 2015; 13(2): 267-277.
[33] Bhaskaran K, Ebonyi AO, Walther B, Walther M. Predictors of hyperlactataemia among children presenting with malaria in a low transmission area in The Gambia. Malari J 2013; 12(2): 423.
[34] Swallow CJ, Grinstein S, Rotstein OD. A vacuolar type H(+)-ATPase regulates cytoplasmic pH in murine macrophages. J Biol Chem 1990;265: 7645-7654.
[35] Kubata BK, Eguchi N, Urade Y, Yamashita K, Mitamura T, Tai K, et al. J Plasmodium falciparum produces prostaglandins that are pyrogenic,somnogenic, and immunosuppressive substances in humans. Exp Med 1998; 188(6): 1197-1202.
ent heading
10.1016/j.apjtm.2016.03.013
15 January 2016
Wan-Chung Hu, Department of International Health, Johns Hopkins University School of Public Health; Division of Clinical Chinese Medicine,National Research Institute of Chinese Medicine, 155-1, Section 2, Linong Street,Beitou District, Taipei 112, Taiwan.
Tel: 886-2-28201999 (ext3551)
E-mail: Wanchung.Hu09@gmail.com
in revised form 20 February 2016
ARTICLE INFO
Article history:
杂志排行

Asian Pacific Journal of Tropical Medicine的其它文章
- Determination of ligand cluster and binding site within VP40 of Ebola virus: clue for drug development
- Clinacanthus nutans: a review of the medicinal uses, pharmacology and phytochemistry
- Current perspectives on dengue episode in Malaysia
- Etiological agents causing leptospirosis in Sri Lanka: A review
- Phylogeny of Murray Valley encephalitis virus in Australia and Papua New Guinea
- Dengue outbreak in Swat and Mansehra, Pakistan 2013; an epidemiological and diagnostic perspective