Characterization of chickpea germplasm conserved in the Indian National Genebank and development of a core set using qualitative and quantitative trait data
2016-10-24SunilArhkRishiTygiHrerMhseNeetSinghOmDhiyAulNizrMohrSinghVrushliTilekrViksKumrMnornjnDuttNrenrSinghKilshBnsl
Sunil Arhk,Rishi K.Tygi,P.N.Hrer,L.B.Mhse,Neet Singh,Om P.Dhiy, M.Aul Nizr,Mohr Singh,Vrushli Tilekr,Viks Kumr,Mnornjn Dutt, Nrenr P.Singh,Kilsh C.Bnsl,*
aICAR-National Bureau of Plant Genetic Resources,New Delhi 110 012,India
bPulses Improvement Project,Mahatma Phule Krishi Vidyapeeth,Rahuri 413 722,Maharashtra,India
cICAR-National Bureau of Plant Genetic Resources,Regional Station,Akola 444 104,Maharashtra,India
dICAR-Indian Institute of Pulse Research,Kanpur 208 024,Uttar Pradesh,India
Characterization of chickpea germplasm conserved in the Indian National Genebank and development of a core set using qualitative and quantitative trait data
Sunil Archaka,1,Rishi K.Tyagia,1,P.N.Harerb,L.B.Mahaseb,Neeta Singha,Om P.Dahiyaa, M.Abdul Nizarc,Mohar Singha,Vrushali Tilekarb,Vikas Kumara,Manoranjan Duttaa, Narendra P.Singhd,Kailash C.Bansala,*
aICAR-National Bureau of Plant Genetic Resources,New Delhi 110 012,India
bPulses Improvement Project,Mahatma Phule Krishi Vidyapeeth,Rahuri 413 722,Maharashtra,India
cICAR-National Bureau of Plant Genetic Resources,Regional Station,Akola 444 104,Maharashtra,India
dICAR-Indian Institute of Pulse Research,Kanpur 208 024,Uttar Pradesh,India
A R T I C L E I N F O
Article history:
Available online 21 July 2016
Cicer arietinum
Chickpea germplasm
Indian National Genebank
Agro-morphological variation
Chickpea core
Chickpeaisthe third most important pulsecrop asa source ofdietary protein.Ever-increasing demand in Asian countries calls for breeding superior desi-type varieties,in turn necessitating the availability of characterized germplasm to breeders.The Indian National Genebank,located at the National Bureau of Plant Genetic Resources,New Delhi,conserves 14,651 accessions of chickpea.The entire set was characterized in a single large-scale experiment. High variation was observed for eight quantitative and 12 qualitative agro-morphological traits.Allelic richness procedure was employed to assemble a core set comprising 1103 accessions,70.0%ofwhichwereofIndianorigin.Comparablevaluesoftotalvariationexplained by the first three principal components in the entire collection(51.1%)and the core(52.4%)together with conservation of nine pairwise r values among quantitative traits in the core collection and a coincidence rate around 99.7%indicated that the chickpea core was indeed an excellent representation of the entire chickpea collection in the National Genebank.The chickpea core exhibited greater diversity than the entire collection in agro-morphological traits,as assessed by higher variance and Shannon-Weaver diversity indices,indicating that the chickpea core maximized the phenotypic diversity available in the Indian chickpea germplasm.The chickpea core,comprising mainly indigenous desi genotypes,is expected to be an excellent resource for chickpea breeders.Information on the chickpea core can be accessed at http://www.nbpgr.ernet.in/pgrportal.
©2016 Crop Science Society of China and Institute of Crop Science,CAAS.Production and hosting by Elsevier B.V.This is an open access article under the CC BY-NC-ND license
(http://creativecommons.org/licenses/by-nc-nd/4.0/).
1.Introduction
Chickpea(Cicer arietinum L.)is cultivated in 59 countries worldwide[1].With 23%protein in the dry seeds,this pulse crop provides for nutritional security in India,Pakistan,and Bangladesh among many other Asian countries[2]and income security in some African countries.There are two types of chickpea:the large-seeded kabuli type and the smallseeded desi type.The desi type,consumed in Asia,accounts for close to 80%of global chickpea production as well as an equal proportion of the total trade in chickpea[2].India is the largest chickpea-producing country,with a 66%share of global production[1],but accounts for over a quarter of global imports and 40%of Asia's imports.
Asian demand for chickpea is expected to be 14 Mt by 2020,whereas African demand is projected to be~1 Mt.However,global yields of chickpea are low (<1 t ha-1)and have been relatively stagnant.India has a dominant influence on yield trends,owingtoitslargeshareofglobalproduction.Severalbiotic andabioticfactorslimitrealizationofpotentialyield[3].Ifthereis any change in these challenges,it is expected to be amplified by changing climate.To achieve sustainable agronomic gains,breeders need to incorporate adaptation as a focus in varietal development programs.However,recurring use of a limited number of superior genotypes with common ancestors has led toanarrowgeneticbaseofimprovedvarieties[4].Theremedyis to deploy in breeding programs the diverse and climateresilient chickpea germplasm maintained in genebanks as ex situ collections[5].The focus would be to identify superior desi-type germplasm for chickpea breeders of Asia(major consumers)aswellasAustralia(thelargestexporterofdesi-type chickpea).
The spread of desi-type chickpea to the Indian subcontinent from the primary center of diversity occurred 2000 years ago[6].Since then,the Indian gene pool has developed by adaptation-selection for native agroecological niches[7],resulting in India as having the greatest diversity in cultivated types[6].The Indian National Genebank at NBPGR,New Delhi,conserves 14,651 chickpea accessions representing a large proportion of the cultivated diversity found in India and some genotypes introduced from other countries.Despite the availability of such a large chickpea germplasm collection,the extent of use of this variation by breeders has been limited[8].Lack of a core set[9,10]of the NBPGR chickpea collection may be one of the reasons for this underuse.
The utility of the ICRISAT chickpea core[11]has been amply demonstrated in breeding as well as germplasm management[5].The ICRISAT core has been developed from a global collection,and consequently only 37.5%of the core is composed of Indian germplasm and the core contains 22%of kabuli-type accessions.To provide chickpea breeders with a manageable subset of desi-type chickpea germplasm,it was imperative to develop a core of chickpea collections held at NBPGR,comprising about 11,000 desi-type chickpea accessions.
The present study describes the phenotypic characterization of the entire chickpea collection conserved in the Indian National Genebank leading to development of a core set and details of its composition and the estimates of genetic variation.
2.Materials and methods
2.1.Characterization of chickpea germplasm
A total of 14,651 chickpea accessions have been conserved in the National Genebank at NBPGR.A characterization experiment was laid out in the medium-black soil fields of the state agricultural university Mahatma Phule Krishi Vidyapeeth,Rahuri,India.The experimental farm was located at 19.4° latitude,74.6°longitude and at an altitude of 532 m above sea level.The chickpea growing area in India has been divided into the North Hill Zone,North West Plain Zone,North East Plain Zone,Central Zone,and South Zone.The All India Coordinated Research Project on Chickpea,a collaborator in characterization,has been performing pan-India evaluation programs since 1993.Based on past experience,a trait such as maturity(the most challenging one for a genebank manager)is known to be expressed optimally in the Central Zone(in contrast with earliness in the South Zone and delayed maturity in the Northern zones).The time window for trait expression and harvest is adequate in the Central Zone(where the experiment was conducted).Accordingly,all of the accessions and controls could be harvested and their data recorded in this zone.
The location(Rahuri)offered a single tract of land with other facilities for recommended agronomic practice and trained chickpea breeders for data recording.The crop was raised in the rabi season(spring harvest,winter crop)of 2011-2012 in an augmented block design with three checks(cultivarsVijay,Digvijay,andVishal).Recommended agronomic practices for chickpea were followed.
Data for 20 descriptor traits(eight quantitative and 12 qualitative)were recorded as per the NBPGR minimum descriptor list[12].Quantitative traits included days to 50% flowering,number of primary branches,plant height(cm),number of pods per plant,number of seeds per pod,days to 80%maturity,grain yield per plant(g),and 100-seed weight(g).Qualitative traits included early plant vigor,plant growth habit,plant pigmentation,number of leaflets per leaf,leaflet size,plant pubescence,flower color,biomass,pod shape,seed color,seed shape,and seed surface.
2.2.Identification of core
Compiled data for morphological traits were employed in core set identification.The“M”(marker allelic richness)procedure[13]was followed to assemble the individuals for the core set.The procedure entails choosing accessions such that the total allelic diversity for an array of reference traits is maximized in the resulting core set,and ensuring that a minimum of one accession is included from every diversity group.Owing to lack of information,the accessions were not subjected to stratification toform “diversitygroups”thatarepresumedtoreflect ecogeographical differences among the original collection sites. It has been suggested[14]that the M procedure does not require initial stratification,as the procedure has demonstrated efficiency in retaining the greatest allelic diversity.M procedurebased sampling was implemented using a modified heuristic algorithm using PowerCore software[15].The software wasemployed to represent all the descriptor states of the phenotypic observations by means of an advanced maximization strategy and then to achieve a subset size of about 10%of the total collection[10]by means of repeated heuristic sampling.
2.3.Statistical analysis
The means of the entire collection and core collection for quantitative traits were compared by the Student-Newman-Keuls method and the homogeneity of variances of the entire collection and the core collection was tested with the original Levene's test.Criteria for evaluating the quality of the core collection based on summary statistics included fractionated expression of ratios between mean and variance[16].Coincidence rates of range(CR)[17]were also computed.For qualitative traits,chi-square tests were used to evaluate the similarity of the distribution frequencies in the entire and core collections.For each qualitative descriptor,the Shannon-Weaver diversity index[18]was used as an absolute as well as a comparative measure of phenotypic diversity.To test whether the core set sampled trait associations under genetic control,pairwise phenotypic correlations(r)between descriptors were calculated.Contributions of different traits to multivariate polymorphism and conservation of such contributions in the core set were tested by principal component analysis(PCA).All statistical analyses were performed using SAS Enterprise Guide 5.1 and JMP 10.0[19].The population structures of the entire and core collections were analyzed on the basis of geographical locations using Arlequin[20]and of qualitative trait data using Structure[21].
3.Results and discussion
Germplasmcharacterizationisanimportantactivityof genebank management.But morphological characterization is also essential for identification of accessions with desirable traits individually and in combinations intended to be either released directly as cultivars or employed as donors in breeding. In the present experiment,the entire set of 14,651 chickpea accessions conserved in the Indian National Genebank were characterized at once to ensure uniformity in the data.Based on previous knowledge in conducting all-India coordinated trials of chickpea,the location of the experiment(latitude and soil type)was selected for optimal expression of characters of genotypes collected from various agroecological locations.
3.1.Morphological variation in chickpea germplasm
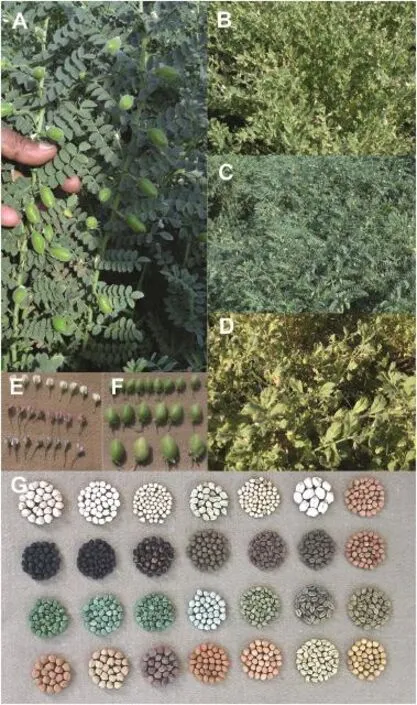
Chickpea germplasm exhibited a wide range of variation in agromorphological traits(Fig.1).The means,ranges,and coefficients of variation(CV)of eight quantitative traits and Shannon-Weaver diversity indices of 12 qualitative traits are presented in Table 1.In the analysis of quantitative traits,the coefficient of variation varied from 6.12%for days to maturity to 50.68%for number of pods per plant.Based on the number of days to 50%flowering,the earliest-flowering(29 days)germplasm accession was IC487505 and the latest(145 days)was IC487426,both collected from sites in Madhya Pradesh. The maximum number of primary branches(46)was observed in IC272466,collected from Maharashtra,and the tallest plant character(84.6 cm)was observed in two accessions collected from Rajasthan(IC396583 and IC265291).The most heavybearing genotype(226 pods per plant)was observed in an accession from Tamil Nadu(IC487102),whereas the highest number of seeds per pod was observed in an accession from Delhi(IC244649)and two introduced genotypes(EC555559 and EC555563).In terms of days to 80%maturity,the earliestmaturing types(78 days)were introduced from the ICARDA genebank(EC442093 and EC223090)and the most delayed type(150 days)was collected from Rajasthan (IC468851).The highest grain yield per plant(>40 g)was observed for ICC4496andICC6626fromtheICRISATgenebank,EC442047 from the ICARDA genebank,and two indigenous collections(IC117637 and IC269891).The most bold-seeded germplasm accessions were all kabuli-type and comprised introduced genotypes(EC198705,EC441827,and EC223438)and indigenous collections(IC83411,IC95174,IC486058,and IC486219).
Among qualitative traits,the major plant growth habit was of semi-spreading type(59%).In contrast,seed color(salmon brown to light brown to brown at 33.6%,31.7%,and 17.7%,and black at 12%)and number of leaflets per leaf(11-13 leaflets 49.2%,>13 leaflets 19.5%,and 9-10 leaflets 11.7%)exhibited a range of descriptor states among the germplasm.A preponderance of desi-type in the germplasm was evident from the observation that 85.6%of accessions showed rough seed surface and that 91.6%of accessions bore seeds with angular shape resembling a ram's head.
3.2.Composition of the chickpea core
The chickpea core was sampled using the PowerCore method,which has been shown to select diverse individuals with high range retention and coefficients of variation[22].A subsampling procedure based on 20 morphological traits resulted in the selection of 1103 accessions as the chickpea core set.The core amounted to 7.5%of the total number of 14,651 accessions conserved in the Indian National Genebank,ICAR-NBPGR,New Delhi.As expected,a bias toward Indian germplasm (778 accessions)in the core set was observed(Table 2).The distribution by source showed that 70.5% accessions of the core set were sampled from India,16.8% from other Asian countries(Afghanistan,Iran,Iraq,Israel,Jordan,Lebanon,Myanmar,Pakistan,Syria[mainly from ICARDA],and Turkey),4.3%from America(Mexico and USA),1.1%from Europe and Australia(Spain,Bulgaria,Italy,Cyprus,Germany,Greece,erstwhile USSR),and 0.4%from Africa(Algeria,Egypt,Ethiopia,Ghana,Morocco,Tunisia,South Africa,and Sudan).Among Indian germplasm accessions in the core,the regions were proportionately represented,with 18%from the northern and 12.1%from the central region.Of the entire chickpea collection,complete passport information for 5849 accessions from India and 1104 accessions from locations outside India was not available and these accessions were grouped as others.The others group was represented in the core set by 449 accessions.
Comparisonoffrequencydistributionsintheentire genebank collection and the core set(Table 2)revealed that germplasm from outside India,exceptfor Europe and Australia,was significantly represented during the sampling procedure(P<0.001).Specifically,germplasm accessions sourced from ICARDA (shown as collections from Syria)and the USA genebanks contributed 86(7.8%)and 46(4.0%)accessions,respectively.A lack of complete passport data meant that distribution of these collections by country could not be ascertained.

Fig.1-Morphological variability observed in chickpea germplasm for(A)plant type;(B to D)foliage and canopy;(E)flower color and size;(F)pod size,and(G)seed color,size,and shape.
The chickpea core developed by ICRISAT [11]is an excellent example of germplasm utilization.However,only 37.5%of the ICRISAT core was composed of Indian germplasm.Desi is the main chickpea type cultivated and traded worldwide[2].The NBPGR core was aimed at providing chickpea breeders with a manageable subset of desi chickpea types.Consequently,the NBPGR core was composed of 70.5% Indian germplasm and 87.4%desi-type accessions.Passport data revealed that the composition of the core,in terms of biological status of the accessions,was mainly(60.0%)of landraces,traditional varieties,and farmers'varieties.
Oneofthemajorhurdlesindependenceon ecogeographical locations for identification of a core is lack of availability and reliability of passport data and consequent restriction of the domain only to material with complete information[23].Alternatively,data for standard qualitative and quantitative traits can be generated in systematically planned experiments.These data can then become the basis for grouping the entire collection into trait-expression clusters and subsequently sampling every possible allelic combination by selecting individuals of these groups for the core set. Designatingagermplasmsubsetbasedexclusivelyon agromorphological data will allow genebanks to develop a core set as representative as possible of the available genetic diversityandnotlimitedbyavailableinformation.A morphology-based core offers two advantages:
(i)It enables maximization of variation.For instance,the ICRISATchickpeacorewasbasedonprovenancerepresentation[11].Between the ICRISAT and NBPGR cores,data for six quantitative traits were available for comparison(Table S1).Variance statistics for the entire collection of ICRISAT were greater than those of NBPGR collections as a result of the international nature of the collection in general and the greater fraction of kabulitypes in particular.However,variance values of the NBPGR core were greater than those observed in the ICRISAT core for four traits,suggesting maximization of variation in the NBPGR core.
(ii)It allows deploying the greater part of the genebank collections,with or without complete passport data,into a utilization value-addition chain.Thus,in the present study,449 accessions with no passport information were added to the chickpea core,and this will allow the Indian National Genebank to enhance the utilization quotient of the ex situ germplasm.It may be argued that significance of a core set lies in its utilization rather than in its development method.

Table 1-Agromorphological variation in chickpea germplasm.

Table 2-Frequency distribution of origin information in chickpea germplasm accessions used in the study.
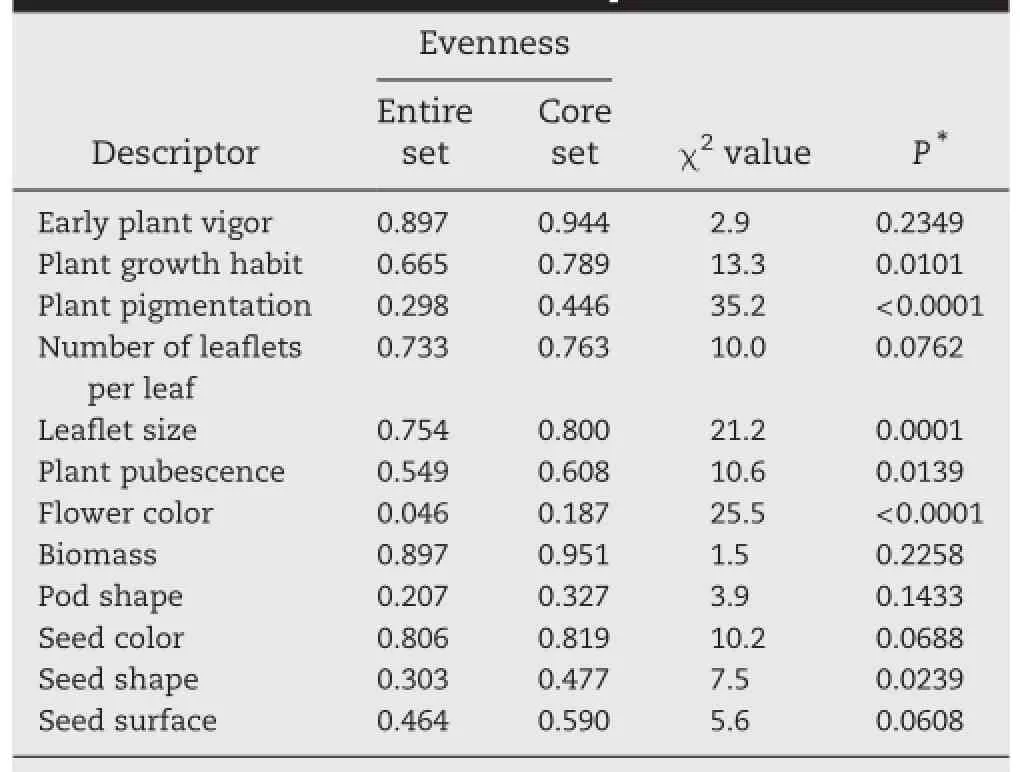
3.3.Representativeness of the chickpea core The proposition that the selected accessions in the core collection optimally represent the range of variation in the entire chickpea collection was supported by a comparison of the variation within each of the two groups.Comparison of variances of the eight quantitative characters showed significant differences between the core collection and the entire chickpea collection(Table 3).Because the primary stratification of the entire collection was based on the expression of morphological traits,any subsample that includes extremes is expected to display significantly different mean and variance[24].The frequency distribution of the 12 qualitative descriptors(Table 4)indicated homogeneity of distribution in six traits,whereas significant(P=0.05)differences were observed in growth habit(0.010),plant pigmentation(<0.001),leaflet size(<0.001),plant pubescence(0.014),flower color(<0.001)and seed shape(0.024).
Increase in the H′-based evenness values across the traits(Table 4)in the core is indicative of effective representativeness of the diversity available in the entire chickpea collection.It has been recommended[25]that a conventional core sample should have a coincidence rate of range(CR)greater than 80%.In our analysis,the CR was found to be 99.7%,indicating that the chickpea core was indeed an excellent representation of the phenotypic diversity of the entire chickpea collection available in the National Genebank.

Table 3-Comparison of variance for eight quantitative traits recorded in the entire collection and the core set of chickpea germplasm.

Table 4-Chi-square test for comparison of frequency distribution for 12 qualitative traits between the entire collection and the core set of chickpea.
3.4.Conservation of trait association and principal components analysis
The need to conserve trait associations among subsamples has been emphasized for theoretical purposes of maintaining coadapted genetic complexes[26]as well as for practical purposes such as efficient utilization of germplasm[11].Trait associations were estimated based on phenotypic correlations,r(Table 5).The estimates showed that among all pairwise r values possible with eight quantitative traits,13 were significant in the entire and nine in the core collection. Sampling effects are a plausible explanation for reduction in associations[27].It has been reported that trait correlation is applicable only at r>0.7[28].The smaller correlation coefficients observed in the chickpea collections,however,need attention,in view of the large population size.In a core collection,preservation of correlation is more significant than its magnitude.Definite correlations among traits such as days to flowering,days to maturity,grain yield,plant height,and primary branches were observed in the entire set of germplasm and were conserved after sampling for the core set(Table 5).

Table 5-Correlation coefficients among eight quantitative descriptors in entire(below diagonal)and core(above diagonal)collections.
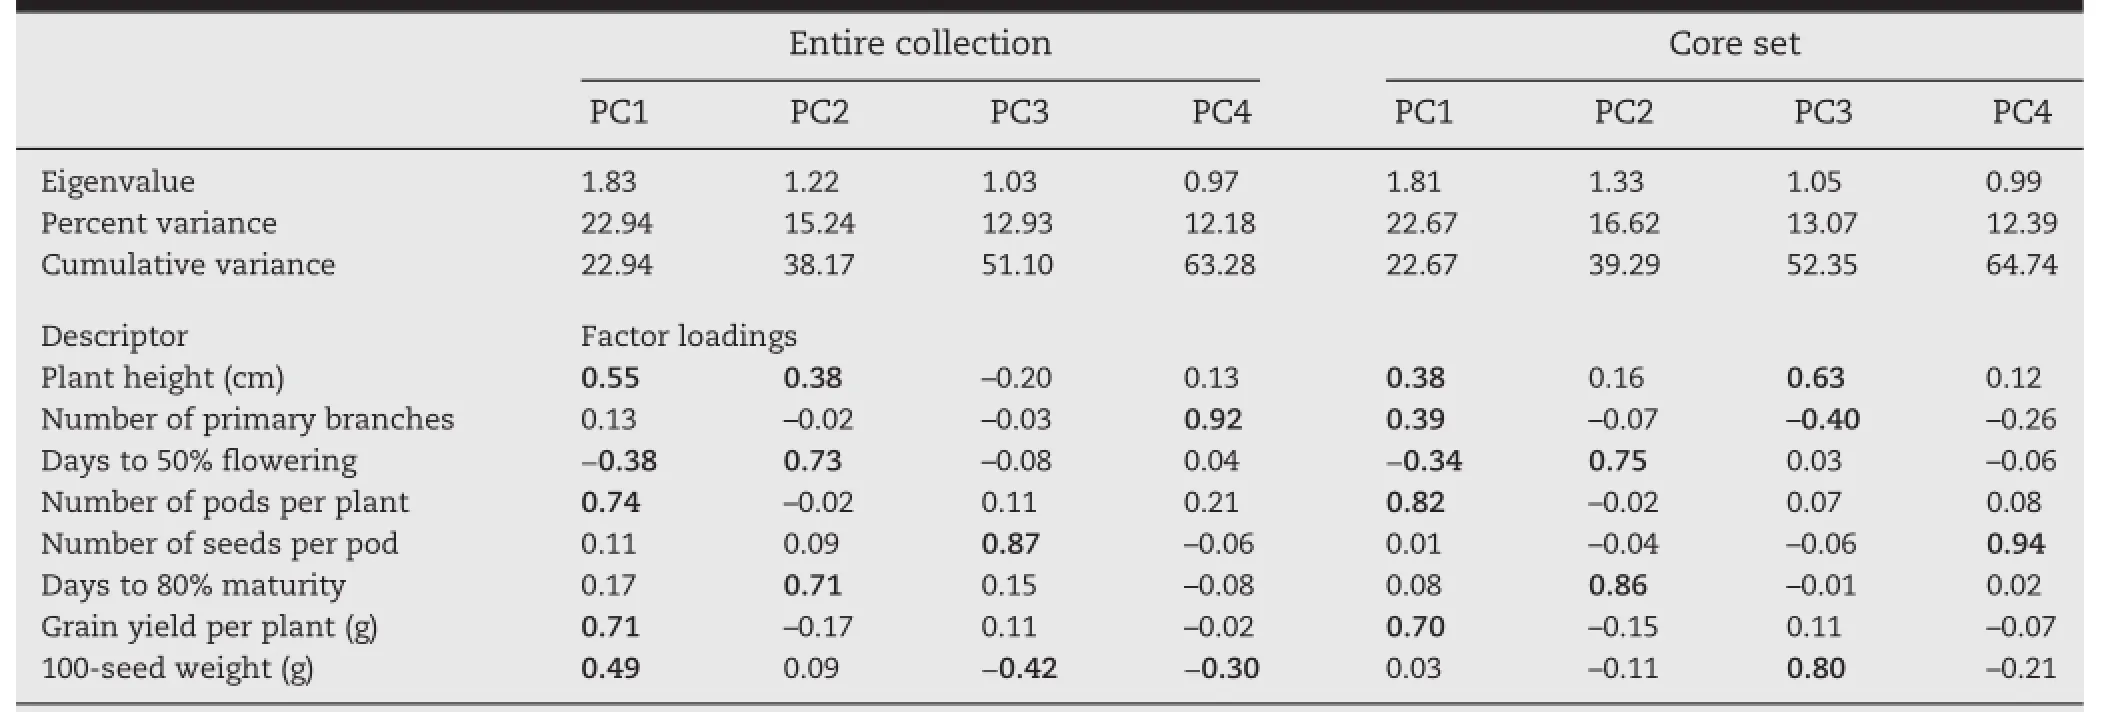
Relationships among the different traits were evaluated by principal component analysis(PCA).The first four principal components provided a reasonable summary of the data and explained 64.7%of the total variation.This value was comparable with that of the entire chickpea collection(63.3%)reflecting the extent to which the core set represented the variation.In the chickpea core,PC1 explained variation in number of pods per plant and grain yield per plant,PC2 in days to 80.0%maturity,PC3 in plant height and 100-seed weight,and PC4 in number of seeds per pod(Table 6).
3.5.Population structure analysis
Population structure of both the entire(14,651 accessions)and the core(1103 accessions)collections was analyzed.Arlequin[20]was employed to analyze population structure based on geographical location.Numbers of populations(N)and the members(germplasm accessions)of each population were determined by location of germplasm collection or acquisition. Arlequin results were compiled into(i)AMOVA to assign source ofvariationtoamongpopulationsandwithinpopulations;(ii)fixation index(basedonAMOVA)asameasure of population differentiation;and(iii)expected heterozygosity of subpopulations as a measure of genetic variation in each trait(assuming Hardy-Weinberg equilibrium).
Structure[21]was employed to analyze population structure based on genotype data.Number of clusters(K)and the members[germplasm accessions]of each cluster were determined by the software on the basis of multiple iterations. Structure results were compiled into(i)average distances between individuals in the same cluster Kias a measure of genetic variation in each trait;(ii)mean value of FSTof the populations as a measure of population differentiation;(iii)relationship of the population structure with geographical source and genotypes(desi and kabuli);(iv)inference of phenotypic characteristics as revealed by population structure;and(v)inference of conservation of population structure in the core.
Results of population structure analysis(Table S2)indicated the absence of any relation between population structure and geographical source.Chickpea germplasm accessions represent“managed”populations,those collected from cultivated fields and thus selected and maintained by farmers.Insuch cases it has been found[29]that clustering of accessions does not reveal any association between morphological traits and germplasm collection sites;instead,landrace groups tend to be associated by morphological similarities and agronomic uses.In the present analysis,although no single phenotypic character was revealed by the population structure,three descriptor states(smooth seed surface,seed shape of irregular rounded owl's head,and salmon brown to beige seed coat color)together described a phenotype-based cluster dominated by kabuli-types.It was observed that both,the presence of population structure(as revealed by FSTof clusters)or the lack of it(observed in the AMOVA distribution of variation and revealed by expected heterozygosity values)in the entire chickpea collection was conserved in the core.However,FSTof clusters showed that the degree of differentiation was reduced(0.572)in the core set compared to whole germplasm of chickpea(0.775)significantly(t=3.27,P=0.004).

Table 6-Comparison of eigenvectors and eigenvalues for the first four principal componentsin the chickpea germplasm collection.
4.Conclusions
The chickpea core set described in this report represents the variation available in the desi-type chickpea germplasm conserved in the Indian Genebank.The NBPGR chickpea core was developed in collaboration with chickpea breeders of India's national chickpea program.Direct involvement of chickpea breeders in the entire processes of characterization and core development is expected to ensure direct and effective deployment of the core in chickpea breeding. Information about the NBPGR chickpea core can be accessed at http://www.nbpgr.ernet.in/pgrportal.
Acknowledgments
The research work was funded by the Indian Council of Agricultural Research.The authors acknowledge the valuable guidance and support received from Prof.S.K.Datta and Dr. J.S.Sandhu,past and present Deputy Directors General(Crop Science)ofICAR,NewDelhi,andDr.T.A.More,Vice Chancellor,MPKV,Rahuri.Technical help rendered by the staff of NBPGR and MPKV is gratefully acknowledged.
Supplementary data
Supplementary data for this article can be found online at http://dx.doi.org/10.1016/j.cj.2016.06.013.
R E F E R E N C E S
[1]FAO,Agriculture Data,United Nations Food and Agriculture Organization,http://faostat3.fao.org/faostat-gateway/go/to/ browse/Q/QC/E2014(Accessed April 22,2014).
[2]P.Parthasarathy Rao,P.S.Birthal,S.Bhagavatula,M.C.S. Bantilan,Chickpea and Pigeonpea Economies in Asia:Facts,Trends and Outlook,ICRISAT,Patancheru,2010 76.
[3]H.D.Upadhyaya,N.Dronavalli,S.L.Dwivedi,J.Kashiwagi,L. Krishnamurthy,S.Pande,H.C.Sharma,V.Vadez,S.Singh,R.K.Varshney,C.L.L.Gowda,Mini core collection as a resource to identify new sources of variation,Crop Sci.53(2013)2506-2517.
[4]J.Kumar,S.S.Yadav,R.Kumar,V.Hegde,A.K.Singh,N.Singh,Evaluation of chickpea(Cicer arietinum L.)germplasm for stunt virus and phenological traits,Abstracts of 4th International Food Legumes Research Conference,New Delhi 2005,p.372.
[5]C.L.L.Gowda,H.D.Upadhyaya,S.Sharma,R.K.Varshney,S.L. Dwivedi,Exploiting genomic resources for efficient conservation and utilization of chickpea,groundnut and pigeon pea collections for crop improvement,Plant Genome 6(2013)1-28.
[6]L.J.G.van der Maesen,Cicer L.,A Monograph of the Genus,with Special Reference to the Chickpea(Cicer arietinum L.),Its Ecology and Distribution(Doctoral thesis)Wageningen University,1972.
[7]S.Pande,K.H.M.Siddique,G.K.Kishore,B.Bayaa,P.M.Gaur,C.L.L.Gowda,T.W.Bretag,J.H.Crouch,Ascochyta blight of chickpea(Cicer arietinum L.):a review of biology,pathogenicity and disease management,Aust.J.Agric.Res.56(2005)317-322.
[8]C.A.Bonham,E.Dulloo,P.N.Mathur,P.Brahmi,V.Tyagi,R.K. Tyagi,H.D.Upadhyaya,Plant genetic resources and germplasm use in India,Asian Biotechnol.Dev.Rev.12(2010)17-34.
[9]O.H.Frankel,A.H.D.Brown,Plant genetic resources today:a critical appraisal,in:J.H.W.Holden,J.T.Williams(Eds.),Crop Genetic Resources:Conservation and Evaluation,Allen and Unwin,Winchester 1984,pp.249-257.
[10]A.H.D.Brown,The case for core collections,in:A.H.D.Brown,O.H.Frankel,D.R.Marshall,J.T.Williams(Eds.),The Use of Plant Genetic Resources,Cambridge University Press,Cambridge 1989,pp.136-156.
[11]H.D.Upadhyaya,P.J.Bramel,S.Singh,Development of a chickpea core subset using geographic distribution and quantitative traits,Crop Sci.41(2001)206-210.
[12]R.K.Mahajan,R.L.Sapra,U.Srivastava,M.Singh,G.D. Sharma,Minimal Descriptors for Characterization and Evaluation of Agri-horticultural Crops(Part I),National Bureau of Plant Genetic Resources,New Delhi,2000 71-76.
[13]D.J.Schoen,A.H.D.Brown,Maximizing genetic diversity in core collections of wild relatives of crop species,in: T.Hodgkin,A.H.D.Brown,T.J.L.van Hintum,A.E.V.Morales(Eds.),Core Collections of Plant Genetic Resources,John Wiley &Sons,Chichester 1995,pp.55-76.
[14]P.A.Reeves,L.W.Panella,C.M.Richards,Retention of agronomically important variation in germplasm core collections:implications for allele mining,Theor.Appl. Genet.124(2012)1155-1171.
[15]K.Kim,H.Chung,G.Cho,K.Ma,D.Chandrabalan,J.Gwag,T. Kim,E.Cho,Y.Park,PowerCore:a program applying the advanced M strategy with a heuristic search for establishing core sets,Bioinformatics 23(2007)2155-2162.
[16]T.L.Odong,J.Jansen,F.A.van Eeuwijk,T.J.L.van Hintum,Quality of core collections for effective utilization of genetic resources-review,discussion and interpretation,Theor. Appl.Genet.126(2013)289-305.
[17]N.Diwan,M.S.McIntosh,G.R.Bauchan,Methods of developing core collection of annual Medicago species,Theor. Appl.Genet.90(1995)755-761.
[18]C.E.Shannon,W.Weaver,The Mathematical Theory of Communication,University of Illinois Press,Urbana,1949.
[19]SAS Institute,SAS Enterprise Guide 5.1,SAS Institute,Cary,2012.
[20]L.Excoffier,A.Estoup,J.M.Cornuet,Bayesian analysis of an admixture model with mutations and arbitrarily linked markers,Genetics 169(2005)1727-1738.
[21]J.K.Pritchard,M.Stephens,P.Donnelly,Inference of population structure using multilocus genotype data,Genetics 155(2000)945-959.
[22]R.R.Krishnan,R.Sumathy,S.R.Ramesh,B.B.Bindroo,G.V. Naik,SimEli:similarity elimination method for sampling distant entries in development of core collections,Crop Sci. 54(2014)1070-1078.
[23]R.C.Johnson,T.Hodgkin,Core Collections for Today and Tomorrow,International Plant Genetic Resources Institute(IPGRI),Rome,1999.
[24]N.Q.Ng,S.Padulosi,Constraints in the accessibility and use of germplasm collections,in:G.Thottappilly,L.M.Monti,D.R. Mohan Raj,A.W.Moore(Eds.),Biotechnology:Enhancing Research on Tropical Crops in Africa,Technical Centre for Agricultural and Rural Cooperation,Wageningen 1992,pp.45-50.
[25]J.Hu,J.Zhu,H.M.Xu,Methods of constructing core collections by stepwise clustering with three sampling strategies based on the genotypic values of crops,Theor. Appl.Genet.101(2000)264-268.
[26]R.Ortiz,E.N.Ruiz-Tapia,A.Mujica-Sanchez,Sampling strategy for a core collection of Peruvian quinoa germplasm,Theor.Appl.Genet.96(1998)475-483.
[27]K.K.Gangopadhyay,R.K.Mahajan,G.Kumar,S.K.Yadav,B.L. Meena,C.Pandey,I.S.Bisht,Development of a core set in brinjal,Crop Sci.50(2010)755-762.
[28]D.Z.Skinner,G.R.Bauchan,G.Auricht,S.Hughes,A method for the efficient management and utilization of large germplasm collections,Crop Sci.39(1999)1237-1242.
[29]M.A.Rabbani,A.Iwabuchi,Y.Murakami,T.Suzuki,K. Takayanagi,Phenotypic variation and the relationships among mustard(Brassica juncea L.)germplasm from Pakistan,Euphytica 101(1998)357-366.
25 December 2015
in revised form 3 June 2016 Accepted 11 July 2016
.
E-mail address:kailashbansal@hotmail.com(K.C.Bansal).
Peer review under responsibility of Crop Science Society of China and Institute of Crop Science,CAAS.1The first and second authors contributed equally and should be considered joint
s.
http://dx.doi.org/10.1016/j.cj.2016.06.013
2214-5141/©2016 Crop Science Society of China and Institute of Crop Science,CAAS.Production and hosting by Elsevier B.V.This is an open access article under the CC BY-NC-ND license(http://creativecommons.org/licenses/by-nc-nd/4.0/).
杂志排行
The Crop Journal的其它文章
- Development of a panel of unigene-derived polymorphic EST-SSR markers in lentil using public database information
- Achievements and prospects of grass pea(Lathyrus sativus L.)improvement for sustainable food production
- Nutritional composition and antioxidant activity of twenty mung bean cultivars in China
- Genetics of seed flavonoid content and antioxidant activity in cowpea(Vigna unguiculata L.Walp.)
- Molecular cloning and characterization of a gene encoding the proline transporter protein in common bean(Phaseolus vulgaris L.)
- Large-scale evaluation of pea(Pisum sativum L.)germplasm for cold tolerance in the field during winter in Qingdao
