Estimation of extreme wind speed in SCS and NWP by a non-stationary model
2016-09-14LizhenWangJiachunLiKeyLaboratoryforMechanicsinFluidSolidCouplingSystemsInstituteofMechanicsChineseAcademyofSciencesBeijing100190China
Lizhen Wang,Jiachun Li∗Key Laboratory for Mechanics in Fluid Solid Coupling Systems,Institute of Mechanics,Chinese Academy of Sciences,Beijing 100190,China
Article
Estimation of extreme wind speed in SCS and NWP by a non-stationary model
Lizhen Wang,Jiachun Li∗
Key Laboratory for Mechanics in Fluid Solid Coupling Systems,Institute of Mechanics,Chinese Academy of Sciences,Beijing 100190,China
h i g h l i g h t s
•An enhancement trend of the extreme wind speed is found in the South China Sea(SCS)and the Northwest Pacific(NWP).
•Particular attention is paid to the non-stationary process of the extreme wind speed of tropical cyclone.
a r t i c l ei n f o
Article history:
Received in revised form
6 April 2016
Accepted 8 April 2016
Available online 22 April 2016
Tropical cyclone
Non-stationary process
Extreme wind speed
Return period
The Northwest Pacific
The South China Sea
In offshore engineering design,it is considerably significant to have an adequately accurate estimation of marine environmental parameters,in particular,the extreme wind speed of tropical cyclone(TC)with different return periods to guarantee the safety in projected operating life period.Based on the 71-year (1945-2015)TC data in the Northwest Pacific(NWP)by the Joint Typhoon Warning Center(JTWC)of US,a notable growth of the TC intensity is observed in the context of climate change.The fact implies that the traditional stationary model might be incapable of predicting parameters in the extreme events. Therefore,a non-stationary model is proposed in this study to estimate extreme wind speed in the South China Sea(SCS)and NWP.We find that the extreme wind speeds of different return periods exhibit an evident enhancement trend,for instance,the extreme wind speeds with different return periods by nonstationarymodelare4.1%-4.4%higherthanstationaryonesinSCS.Also,thespatialdistributionofextreme wind speed in NWP has been examined with the same methodology by dividing the west sea areas of the NWP 0°-45°N,105°E-130°E into 45 subareas of 5°X5°,where oil and gas resources are abundant. Similarly,remarkable spacial in-homogeneity in the extreme wind speed is seen in this area:the extreme wind speed with 50-year return period in the subarea(15°N-20°N,115°E-120°E)of Zhongsha and Dongsha Islands is 73.8 m/s,while that in the subarea of Yellow Sea(30°N-35°N,120°E-125°E)is only 47.1 m/s.As a result,the present study demonstrates that non-stationary and in-homogeneous effects should be taken into consideration in the estimation of extreme wind speed.
©2016 The Authors.Published by Elsevier Ltd on behalf of The Chinese Society of Theoretical and Applied Mechanics.This is an open access article under the CC BY-NC-ND license(http:// creativecommons.org/licenses/by-nc-nd/4.0/).
1.Introduction
The South China Sea(SCS)and the Northwest Pacific(NWP)are the sea areas most frequently hit by intense tropical cyclones(TC) in the world.And the reliability of offshore platforms design is heavily relied on the understanding of TC activities,which often bring about strong winds and destructive waves.An adequate accurateestimationoftheTCparametersintheareaisessentialfor offshore platform design and operation,especially in the context of climate change.Let us look at some of destructive TC events in recent years:Hurricanes Rita and Katrina were haunting about the Mexican Gulf in 2005 and caused one of the most destructive natural disasters in American history[1,2];Typhoon Rammasun in 2014,with the maximum wind speed up to 72 m/s brought grievous loss to Philippine and China.The intensity of these superstrong TC beyond the engineers'expectation might imply the necessity of ocean engineering standard revision due to the enhancing trend of TC activity[3,4].Thus,it is a pressing need to have a deep understanding in the characteristics and trend of TC activities in today's ocean engineering design.
The TC extreme wind speed of different return periods and the TC occurrence frequency are two crucial parameters for offshore structure design.A lot of works have been done to estimate these parameters.Liu and Ma[5]developed Poisson-Gumbel compound extreme value distribution to calculate wind speed and design wave height which seemed to be reasonable in short term.Shi andZhou[6]used moment estimation method to derive parameters of wind speed distribution functions for practical purposes.Qi et al.[7]employed the 3-parameter Weibull distribution model to predict the extreme wind,wave and current with different return periodsinthedeepwaterareasofSCS.However,allofthesestudies werebasedontheassumptionthatthetemporalvariationoftheTC activities is insignificant,which might be challenged for long term forecasting in the context of climate change.
Ongoing debate on the trend of TC activities in different oceans is still hot in the scientific community.Emanuel[3,8]found an observational enhancement of TC activities in terms of power dissipation index(PDI).Based on the design code,Liu et al.[9]introduced the extreme value theory to analyze the long-term data of TCrelatedwindspeedandsimultaneouswaterlevelsofMississippi river,findingthatthereturnperiodofthehurricaneKatrinashould be 50 years instead of 200 years.Wang and Li[4]studied the typhoon and strong typhoon in the SCS areas and found a significant rising trend of the strong typhoon counts and intensity.Mika[10] reviewed the trend debate of TCs and suggested that the observed long-term increasing trend could be attributed to the advance in the observation capabilities.Fitchett and Grab[11]found an increasing trend of TC landfalls on the south of Madagascar in the past 6 decades,while no statistically significant trends in the frequency of overall TC landfalls over Madagascar and Mozambique could be established.Choi et al.[12]found a trend of rapidly decreasing frequency of TC affecting Japan since 1978.Dowdy[13] studied the satellite-checked TC data(1982-2013)in Australia and found a significant decreasing trend in TC numbers with high confidence level when the El Niño-Southern Oscillation induced variability is removed.
It should be noted that although the debate on the observed trend of TC activities and the mechanism behind it in the scientific community might last for some time,engineers should be aware that certain temporal and spatial variation(increase or decrease in different areas)of TC activities,whatever its reason is,does occur in the recent decades.Hence,the fact and corresponding consequences should be seriously considered,that is to say, we should ask whether the current stationary process-based methodology is still suitable for the determination of design parameters.In fact,TyphoonRammasunin2014,whichisbelieved one of the top two landfall typhoons in China since 1973,achieved the maximum wind speed of 72 m/s[14]far beyond the 50-year return storm standard of 60 m/s.The other is Typhoon Marge of SCS in 1973 with minimum central pressure of 937.8 hPa and maximum wind speed more than 70 m/s.These two extreme events occurring in such a short term provide adequate reason for people to query the current stationary statistics model.Thus,it is extremely necessary to properly consider the temporal and spatial variation in engineering design in the context of climate change.
In this study,we are primarily concerned with temporal and spatial variation of TC activities in SCS and NWP.Based on the analysis of 71-year(1945-2015)TC database in these sea areas by the Joint Typhoon Warning Center(JTWC),the TC activity is found to be a non-stationary stochastic process.By establishing a nonstationary model,the extreme wind speed with different return periods and its spatial distribution in SCS and NWP are obtained. The paper is organized as follows:We at first briefly introduce theextremevaluetheoryandcorrespondingparameterestimation method and then set up the non-stationary extreme value model for the maximum wind speed of typhoon.The stationary and nonstationary extreme wind speeds with different return periods in SCS are then calculated and compared.The following passage is devoted to the study of spatial distribution of extreme wind speed inNWP.Finallywecometotheconclusionandimplicationsbythis study.
2.Theory and method
Extreme value theory is unique as a statistical discipline with distinguished feature to quantify the stochastic behavior of a process at unusually large or small level.In particular,extreme value analyses usually need to estimate the probability of events thataremoreextremethanothersthathavealreadybeenobserved [15].As part of its design criteria for offshore structures,the platform is required to withstand the strong wind and huge wave during its projected life span of a few decades.Hence,extreme value theory is focused on in this study to calculate TC extreme wind speed in SCS and NWP.
Abriefintroductionofextremevaluetheoryispresentedbelow. Letξrepresent a random variable with its distribution function being G(x).Designateξias the ith independent observation value ofξ(i=1,2,...,n),and define the random variableζas the maximum value of the observationξ1,ξ2,...,ξn,namely,

Let n be a random variable independent ofξ,with its range of value in positive integers,which denotes the number of the observation in one year.And let P{i=k}=Pk(k=1,2,...). Then,the distribution function ofζis

When the extreme value distribution function is derived,the remaining work for practical application is how to solve the equation above for a given design frequency R.Generally speaking, we call T=1/R the return period of extreme values.IfζRsatisfies F(ζR)=1-R,thenζRiscalledthevalueoccurringonceinT years. For instance,ζ0.01is the extreme value occurring once in 100 years when R=0.01.
The 71-year(1945-2015)TC data by JTWC are used in this paper.AndtherevisedmethodbyEmanuel[3]isemployedtounify recorded TC wind speed data.There are 820 TC events totally in the SCS(4°N-25°N,109°W-122°W in this study)according to the 71-year time series of TC database and almost half of the TCs with lifetime maximum wind speed(LMWS)are less than 30 m/s.As we focus on typhoon,only TCs with LMWS exceeding 30 m/s are considered below.In the following text,when we refer to TCs,it meansTCswithLMWSlargerthan30m/s.Applyingtheconclusion of extreme value theory in the calculation of design extreme wind speed,the TC annual frequency is noted as a random variable n and the wind speed is denoted asξ,their corresponding distribution functionsarePkandG(x)respectively.Sotheannualmaximalwind speed denoted asζfollows the distribution as Eq.(2).
Since the numbers of TCs annual occurrence in the SCS are positive integers,the TC annual frequency forms a discrete distribution.Based on the statistical analysis of the TC database in the SCS,we found that the TC annual frequency follows Poisson distribution(Fig.1):

whereλis the average number of TC annual frequency with its mean value about 6 annually.Then,the extreme wind speedˆVcan be represented in the form:

For a given design frequency R,the extreme wind speed with different return periods can be obtained from Eq.(4).
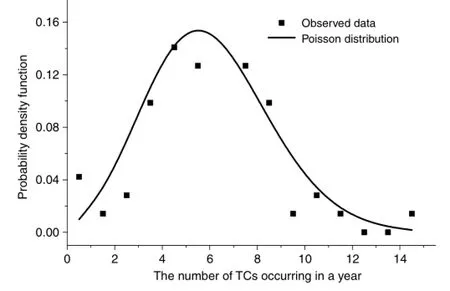
Fig.1.Curve fitting of the TC frequency with Poisson distribution,λ=6,R2= 0.8540.

Table 1 The best parameter estimation for three distribution functions.
With regard to TC wind speed distribution,it can be considered as a kind of continuous distribution as there are a great number of TCs that occurred in 71 years in the SCS.Based on the empiricalknowledgeaboutwindspeeddistribution,wehavethree commonly used candidate distribution functions listed below:

The maximum likelihood estimation with the assistance of moment method is used to determine the parametersα,β,andγin Eqs.(5)-(7)in order to select the most suitable candidate distribution function.The obtained parameters are listed in Table 1.
Thecumulativeprobabilitydistributioncurveofthreefunctions is plotted in Fig.2 from the 71 years TC database in the SCS. It is shown that the Weibull distribution is more suitable than Exponential and Gumbel distributions for estimating maximum wind speed of TCs in the SCS.
In fact,the moment estimation method for Weibull distribution has the following expression:
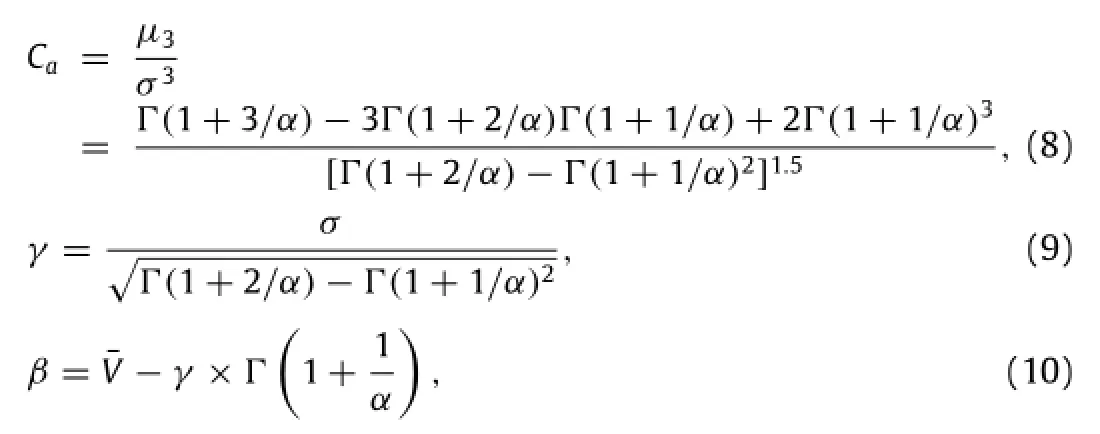
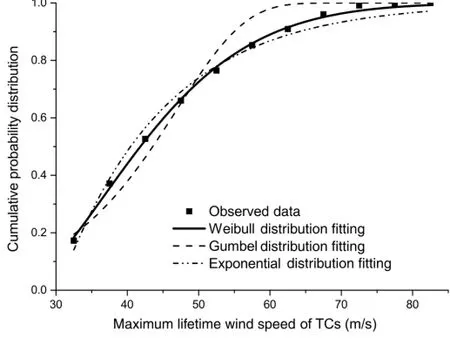
Fig.2.Curve fitting of the TC maximum wind speed distribution in the SCS.
where Cais the coefficient of skewness;µ3is the third central moment;0(α)istheGammafunctionofshapeparameterα;¯V and σarethemeanandstandarddeviationofwindspeed,respectively. In Eqs.(9)and(10)we can see that the scale parameterγ and location parameterβof Weibull distribution function are physically in connection with the mean and standard deviation of maximumTCwindspeed.Thus,ifthemeanandstandarddeviation vary with time,the parameters in the Weibull distribution should change correspondingly.
3.Non-stationary extreme value model
A non-stationary stochastic process means that its random behaviors or statistical parameters vary with time.Under the background of climate change,the TC activity could be supposed as a non-stationary stochastic process with temporal varying intensity and annual frequency,thus resulting in the variation of the mean and standard deviation of maximum TC wind speed and other statistical distribution parameters.Considering necessity of calculation in statistical behavior and non-stationary process,we divide the 71-year TC data into 9 overlapping sections of 30 years: 1945-1975,1950-1980,1955-1985,...,1985-2015 and compute the mean/standard deviation of maximum TC wind speed and the average annual counts of typhoon in each section.As shown in Figs.3 and 4,the mean and standard deviation of maximum TC wind speed along with the average annual number of TC's occurrence in each section are all exhibiting a growing trend.The non-stationary characteristics of TCs in the SCS are apparent due to long-term effects of climate change,probably directly related to the rising sea surface temperature(SST).
Since there is an apparent non-stationary trend in the 71-year TC data in the SCS,people have enough reason to assume that the traditional stationary extreme model is inappropriate by ignoring temporal variation.And so the estimation of the non-stationary parameters of the compound Poisson and Weibull distribution is necessary.As the variation of the annual counts of TCs in the SCS is not significant statistically,we only consider non-stationary variation of parameters in the wind speed distribution in the present model.From Eqs.(9)and(10)we can see that the changing mean and standard deviation of maximum wind speed will result in non-stationary variation in location parameterβand scale parameterγin Weibull distribution while the shape parameterα could also be assumed as a constant.Thus,we have Eqs.(11)and
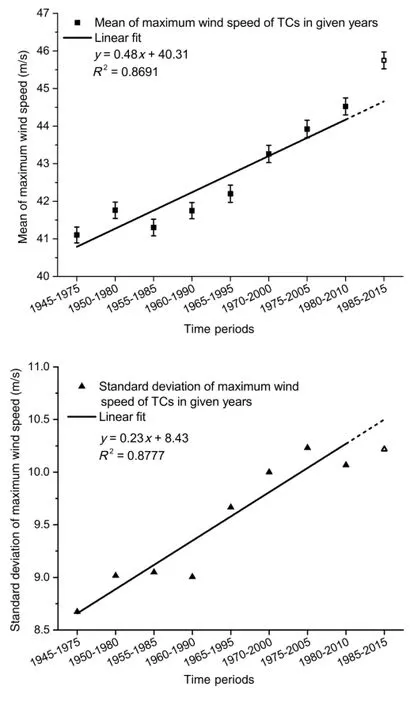
Fig.3.The variation of mean and standard deviation of maximum wind speed of TCs in the SCS.(The black dots represent the observed data while the solid lines are linear fitting of them.The dashed lines are the extension of the solid lines which are compared with the latest observed data plotted as white dots.)
(12).Thedetailedparametersobtainedinthisstudycouldbefound in Table 2.

whereσ(t)andV¯(t)are obtained from linear fitting based on Fig.3.When the parametersλ,β(t),andγ(t)are all adequately estimated,the extreme wind speed with different return periods in the non-stationary stochastic process can be written as follows:

ThenVˆ(t)we obtained by Eq.(13)turns out the non-stationary extreme wind speed with 100-year return period when R=0.01.
To preliminarily validate this model,we calculate the extreme wind speeds during 1985-2015 with the model and then compare them with directly estimated wind speed results in the same period based on the observation by using maximum likelihood method.The variation of parametersβandγof Weibull distribution during 1945-2045 is listed in Table 2.The value of parameterαin the present model is 2.415 while the best fit value ofαduring 1985-2015 is 2.416.This slight difference has no influence on the wind speed results.We can see that the calculated and observational results for extreme wind speeds are very close, indicating that basically the present model is credible.
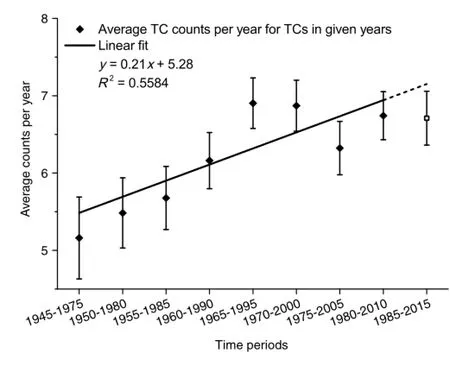
Fig.4.ThevariationoftheannualcountsofTCsintheSCS.(Theblackdotsrepresent the observed data while the solid line is linear fitting of them.The dashed line is the extension of the solid line which is compared with the latest observed data plotted as white dot.)
4.Estimation of non-stationary extreme wind speed in the SCS
Having the time-dependent parameters of Weibull distribution for non-stationary process in the SCS,we need at first to examine whether the model fits for the maximum wind speed distribution well by presenting probability and quantile plots in Fig.5.It can be seen that the points of probability and quantile plots in nonstationary model lie very close to the diagonal line,which means that actually non-stationary model is acceptable.
Moreover,weneedtofurthercheckwhetherthenon-stationary model is indeed a more suitable candidate than stationary one for 71-year data in the SCS.So we define a parameterρto describe the relative error between the probability of Weibull distribution model and the empirical distribution function of wind speed.

where Pmodeland Pempiricalare the probability of Weibull distribution model and the empirical probability of the wind speed respectively.The variation of parameterρof stationary and nonstationary models is both plotted in Fig.6.Except for the value ofρin the 6th time section,the other 8 values are all smaller in non-stationary model than those in stationary model.Thus on the whole,the non-stationary Weibull distribution model is a better choice compared with stationary model in the SCS.
The non-stationary extreme wind speed with different return periods is obtained with Eq.(13).As shown in Fig.7,the extreme wind speeds of non-stationary model are around 4.1%-4.4%larger as compared with stationary one.Figure 8 shows how the actual extreme typhoon events are embedded in stationary or nonstationary model.According to the record,four typhoon events (including Typhoon Rammasun in 2014)with maximum wind speed exceeding 72 m/s occurred in 71 years.All of them should be regarded as an event with 40-year return period in thestationarymodel.Theconclusionseemstobesomehowagainstthe observational fact.Actually,the Typhoon Rammasun in 2014 can be graded among 20-year return period events in non-stationary model.
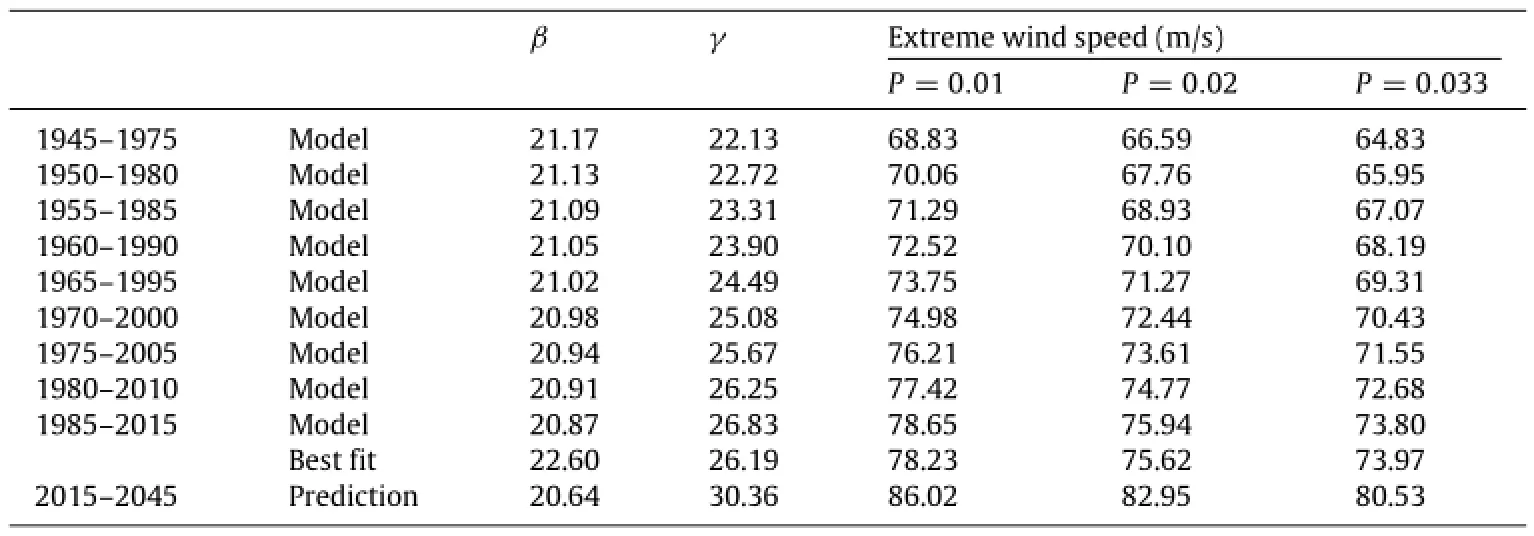
Table 2 The variation of parametersβandγof Weibull distribution and non-stationary extreme wind speed in the SCS.
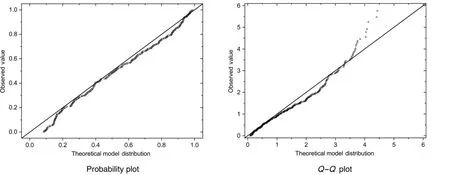
Fig.5.Non-stationary Weibull distribution model diagnostic in the SCS.
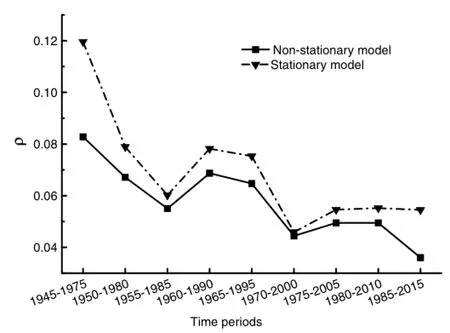
Fig.6.Comparison between stationary and non-stationary models in the SCS.
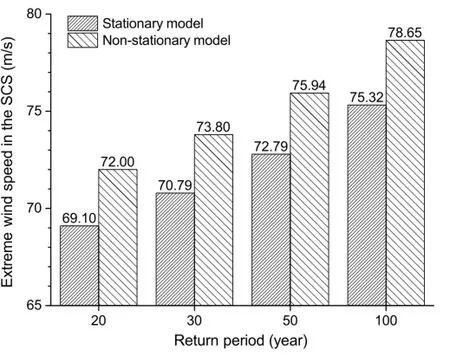
Fig.7.The extreme wind speed in both stationary and non-stationary processes in the SCS.
As a matter of fact,the conclusion of TC extreme wind speed growth rate we made above is also in accord with the theoretical and modeling results in recent years.A number of studies by manyscholars[3,16-20]demonstratedthattherewerestrongcorrelations between TC activity and the rising SST.Using a singlecolumn radiative-convective model,Emanuel[21,22]argued that thepotentialintensityoftropicalcyclonesmayincrease3.5m/sapproximately for each 1°C rise in tropical SST.Integrating CMIP21 climate model with a nested regional model in Coupled Model Inter-comparison Project,Knutson and Tuleya[23-26]found an increaseof6%meanvalueinTCsmaximumsurfacewindspeedunder the assumption of 80-year linear trends of+1%per year CO2emission increase.In the 62 years of 1951~2012,the global SST rises about 0.098°C±0.017°C per decade according to intergov-ernmental panel on climate change(IPCC)the fourth assessment report.By simple extrapolation,the SST rising during 1945-2015 should be around 0.7°C.Therefore,approximately 2.9 m/s increase of wind speed in 71 years,as shown in Fig.7,is a reasonable result as compared with the theoretical and modeling studies.So the effects of non-stationary variation in atmospheric general circulation can no longer be neglected and should be considered in the revision of ocean engineering standard or criterion.
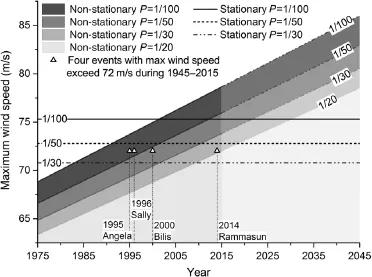
Fig.8.The extreme typhoon events vs.stationary and non-stationary predictions in the SCS.
5.Spacial distribution of extreme wind speed in the west of the NWP
In China seas or the west of NWP,the analysis of TCs'spatial distribution is also carried out so that we are able to identify the sea area frequently hit by strong TC.By processing the TC center location,radiumandwindspeeddatabaserecordedeverysixhours and dividing the target area of 0°-45°N,105°E-130°E into 5°X5° subareas,we record the TC number and the maximum wind speed in each subarea during 71 years and present them in the diagrams of Figs.9-12.
When applied to some subareas with a small amount of TCs occurrence in 71 years,wind speeds of TC are discrete and also Poisson distribution can no longer be used to describe TC annual frequency.In order to obtain the extreme wind speed of the subareas with a small amount of TC's occurrence,we consider the original definition of extreme values.The discrete probability distribution of wind speed can be calculated as P(V≤ˆV).Assume that the number of TC occurring in one year isλand the average number of the same TC recorded in a certain area is k,then the return period TPof wind speed can be estimated as follows:

When TP=50,the inverse solutionˆV of Eq.(15)is the extreme wind speed with the return period of 50 years.Combined with the extreme value model and Eq.(15)for the subareas with a small number of TC's occurrence,the extreme wind speed distribution with return period of 20,30,50,100 years in each subarea can also be obtained.
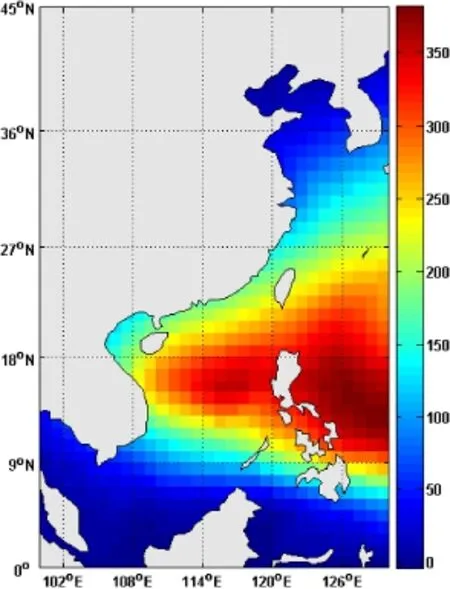
Fig.9.71-yearnumbersofTCsinoccurrenceinthe5°X5°(reinterpretedto1°X1°) subareas of the NWP are presented.The right color bar displays the color image of the numbers of TCs occurrence in 71 years.(For interpretation of the references to color in this figure legend,the reader is referred to the web version of this article.)
We can see in Fig.9 that the most frequent occurrence of TCs happens in the sea area east to Taiwan Islands.The result indicates that the number of TCs occurring in the sea area of 10°N-20°N, 120°E-130°E makes up almost half of the total TC numbers in the whole NWP.More specifically,15°N-20°N,125°E-130°E is the subarea where TC happens most frequently,i.e.we have total 374 TCs in 71 years or nearly 6 TCs per year on average.Figure 10 shows that the maximum wind speed of 71 years in the subareas is also considerably inhomogeneous.The maximum wind speed of 71 years in the subarea of 10°N-15°N,125°E-130°E reaches up to 82.0 m/s while it turns out less than 30.0 m/s in some subareas around 40°N.
From Figs.11 and 12,we could see that the extreme wind speeds in the different subareas are unevenly distributed.Take the extreme wind speed of 50-year return period for example, in the region 5°N-10°N,115°E-120°E,east of Nansha Islands,the extreme wind speed is only 28.5 m/s.The extreme wind speeds in the area of Yellow Sea(30°N-35°N,120°E-125°E)and the East China Sea(ECS)(25°N-30°N,120°E-125°E)with the 50-year return period are 47.1 m/s and 65.0 m/s respectively.In contrast, the extreme wind speed of 50-year return period is as high as 73.8m/swhenconsideringtheseaarea(15°N-20°N,115°E-120°E) of Zhongsha and Dongsha Islands west to the Philippines,which is the region strong typhoons haunt frequently.
Under the background of climate change,the extreme wind speed in each subarea also varies with time.Take the subareas of 15°N-20°N,115°E-120°E for example,by dividing the 71-year (1945-2015)database into 9 sections as we did previously,we can get the mean and standard deviation of TC wind speed and the average number of TC's occurrence in each year and section. Then,the non-stationary extreme wind speed in the subarea of 15°N-20°N,115°E-120°E can be obtained by Eq.(13),also exhibiting a rising trend.For instance,the extreme wind speed of 50 year return period reaches to 73.8 m/s with 3.7%increment as compared with stationary one.
6.Conclusion
In this study,we find that the extreme wind speed of TC should be treated as a non-stationary stochastic process based on the analysis of 71-year TC database by JTWC.Actually,theobservationalfactisthedirectconsequenceofrisingSSToftropical oceans in the context of climate change.As a result,a nonstationarymodelisdevelopedtoforecasttheextremewindspeeds of different return periods to meet the pressing need of ocean engineering design such as offshore platform and wind power tower in deep sea.
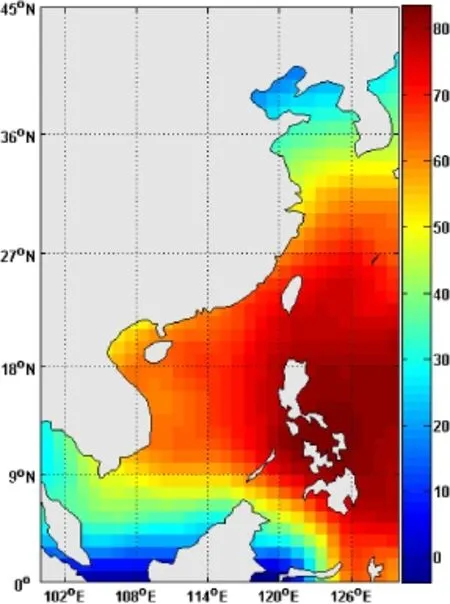
Fig.10.71-year maximum wind speeds of TCs in the 5°X5°subareas (reinterpreted to 1°X1°)of the NWP are presented.The right color bar displays the color image of maximum wind speed of TCs in the 71 years.(For interpretation of the references to color in this figure legend,the reader is referred to the web version of this article.)
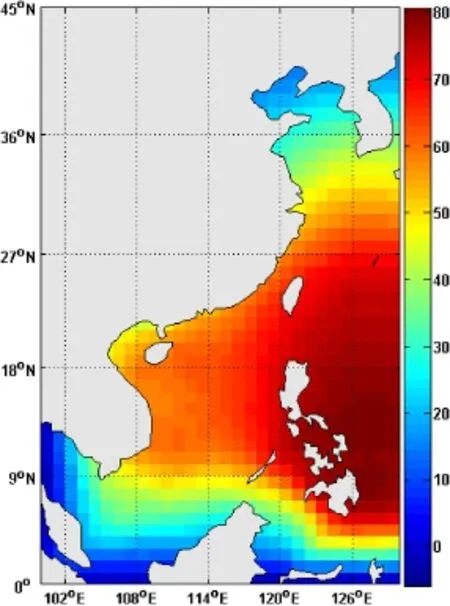
Fig.11.The extreme wind speed distribution with return period of 20 years in the 5°X5°subareas(reinterpreted to 1°X1°).(For interpretation of the references to color in this figure legend,the reader is referred to the web version of this article.)
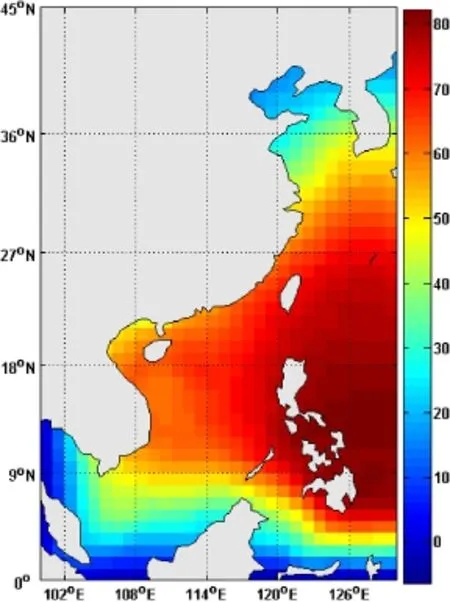
Fig.12.The extreme wind speed distribution with return period of 50 years in the 5°X5°subareas(reinterpreted to 1°X1°).(For interpretation of the references to color in this figure legend,the reader is referred to the web version of this article.)
TC wind speed and occurrence frequency are two major parameters of marine environment,which turn out stochastic variables obeying Weibull and Poison distribution,respectively. In the non-stationary model,we will have time dependent statistical quantities such as mean values,standard deviations along with parameters in the distribution functions,which are subtly identified by sectional analysis of 71-years'database.
The present study demonstrates that an increasing trend of the TC activity in wind speed and occurrence frequency is clearly observed.For instance,the non-stationary extreme wind speeds of SCS are 4.1%-4.4%higher than stationary ones for different return periods.In the meantime,spacial distributions of wind speed and occurrence frequency exhibit in-homogeneity:the extreme wind speed of 50 years return period in the sea area of 15°N-20°N, 115°E-120°E of Zhongsha and Dongsha Islands,west to the Philippine Islands is 73.8 m/s,while that in the Yellow Sea area of 30°N-35°N,120°E-125°E is only 47.1 m/s.Of course,the extreme wind speeds in the sea areas to the south of 10°N and the north of 40°N are naturally even smaller.In addition,the sea area east to Taiwan Island is the place where TCs most frequently impact.
We may conclude that non-stationary and inhomogeneous effects in TC intensity and occurrence frequency should be particularly taken into consideration at present in the offshore structure design and revision of ocean engineering standard in the context of climate change.
Acknowledgments
This study was financially supported by the Ministry of Science and Technology(863 program)(2006AA09A103-4),the National Natural Science Foundation of China(11232012),and the Chinese Academy of Sciences(CAS)knowledge innovation program(KJCXYW-L02),to which we are considerably grateful.
References
[1]Z.Demirbilek,HurricaneKatrinaandoceanengineeringlessonslearned,Ocean Eng.37(2010)1-3.
[2]D.H.Levinson,P.J.Vickery,D.T.Resio,A review of the climatological characteristicsoflandfallingGulfhurricanesforwind,wave,andsurgehazard estimation,Ocean Eng.37(2010)13-25.
[3]K.Emanuel,Increasing destructiveness of tropical cyclones over past 30 years, Nature 436(2005)686-688.
[4]L.Z.Wang,J.C.Li,Non-stationary variation of tropical cyclones activities in the Northwest Pacific,China Ocean Eng.24(2010)725-733.
[5]D.F.Liu,F.S.Ma,Prediction of extreme wave heights and wind velocity, J.Waterway Port Coast.Ocean Div.106(1980)469-479.
[6]J.D.Shi,S.S.Zhou,Moment estimation for multivariate extreme value distribution in nested logistic model,Ann.Inst.Statist.Math.51(1999) 253-264.
[7]Y.Q.Qi,Z.X.Zhang,P.Shi,Extreme wind,wave and current in deep water of South China Sea,Int.J.Offshore Polar Eng.20(2010)18-23.
[8]K.Emanuel,Environmental factors affecting tropical cyclone power dissipation,J.Clim.20(2007)5497-5509. http://dx.doi.org/10.1175/2007JCLI1571.1.
[9]D.F.Liu,L.Pang,G.Fu,et al.Joint probability analysis of hurricane Katrina, in:Proceeding of the Sixteenth International Offshore and Polar Engineering Conference.San Francisco,California,USA,2006.
[10]J.Mika,Changes in weather and climate extremes:phenomenology and empirical approaches,Clim.Change 121(2013)15-26. http://dx.doi.org/10.1007/s10584-013-0914-1.
[11]J.M.Fitchett,S.W.Grab,A66-yeartropicalcyclonerecordforsouth-eastAfrica: temporal trends in a global context,Int.J.Climatol.34(2014)3604-3615. http://dx.doi.org/10.1002/joc.3932.
[12]K.S.Choi,Y.M.Cha,S.D.Kang,et al.,Interdecadal variation of TC frequency in Japan,Theor.Appl.Climatol.121(2015)179-186.
[13]A.J.Dowdy,Long-termchangesinAustraliantropicalcyclonenumbers,Atmos. Sci.Lett.15(2014)292-298.
[14]Joint Typhoon Warning Center(JTWC)-US.Navy,www.usno.navy.mil/JTWC.
[15]S.Coles,AnIntroductiontoStatisticalModelingofExtremeValues,in:Springer Series in Statistics,2001.
[16]K.Emanuel,Meteorology:Emanuel replies,Nature 438(2005)E13.
[17]A.Henderson-Sellers,H.Zhang,G.Berz,Tropical cyclones and global climate change:A post-IPCC Assessment,Bull.Am.Meteorol.Soc.79(1998)19-38.
[18]J.P.Kossin,K.R.Knapp,D.J.Vimont,A globally consistent reanalysis of hurricane variability and trends,Geophys.Res.Lett.34(2007)L04815. http://dx.doi.org/10.1029/2006GL028836.
[19]C.W.Landsea,CountingAtlantictropicalcyclonesbackto1900,EOSTrans.Am. Geophys.Union 88(2007)197-200.
[20]K.Emanuel,R.Sundararajan,J.Williams,Hurricanes and global warmingresults from downscaling IPCC AR4 simulations,Bull.Am.Meteorol.Soc.89 (2008)347-367.
[21]K.Emanuel,The dependence of hurricane intensity on climate,Nature 326 (1987)483-485.
[22]K.Emanuel,Tropical cyclones,Annu.Rev.Earth Planet.Sci.31(2003)75-104.
[23]T.R.Knutson,R.E.Tuleya,Increased hurricane intensities with CO2-induced warming as simulated using the GFDL hurricane prediction system,Clim. Dynam.15(1999)503-519.
[24]T.R.Knutson,R.E.Tuleya,Impact of CO2-induced warming on hurricane intensities as simulated in a hurricane model with ocean coupling,J.Clim.14 (2001)2458-2468.
[25]T.R.Knutson,R.E.Tuleya,Impact of CO2-induced warming on simulated hurricane intensity and precipitation:sensitivity to the choice of climate model and convective parameterization,J.Clim.17(2004)3477-3495.
[26]T.R.Knutson,J.J.Sirutis,S.T.Garner,Simulation of the recent multidecadal increase of Atlantic hurricane activity using an 18-km-grid regional model, American Meteorological Society,October,2007,pp.1549-1565.
26 February 2016
http://dx.doi.org/10.1016/j.taml.2016.04.001
2095-0349/©2016 The Authors.Published by Elsevier Ltd on behalf of The Chinese Society of Theoretical and Applied Mechanics.This is an open access article under the CC BY-NC-ND license(http://creativecommons.org/licenses/by-nc-nd/4.0/).
∗Corresponding author.Tel.:+86 10 82544201;fax:+86 10 62561284.
E-mail address:jcli05@imech.ac.cn(J.Li).
*This article belongs to the Fluid Mechanics
杂志排行
Theoretical & Applied Mechanics Letters的其它文章
- On the stress-strain states of cellular materials under high loading rates
- Heat transport in low-dimensional materials:A review and perspective
- Performance of global look-up table strategy in digital image correlation with cubic B-spline interpolation and bicubic interpolation
- Modeling the mechanics of HMX detonation using a Taylor-Galerkin scheme
- Numerical investigation of air-entrainment in skimming flow over stepped spillways
- A modified relation between the intraocular and intracranial pressures
