Study on the subgrade deformation under high-speed train loading and water–soil interaction
2016-09-06JianHanGuoTangZhaoXiaoZhenShengXueSongJin
Jian Han·Guo-Tang Zhao,2·Xiao-Zhen Sheng·Xue-Song Jin
Study on the subgrade deformation under high-speed train loading and water–soil interaction
Jian Han1·Guo-Tang Zhao1,2·Xiao-Zhen Sheng1·Xue-Song Jin1
©The Chinese Society of Theoretical and Applied Mechanics;Institute of Mechanics,Chinese Academy of Sciences and Springer-Verlag Berlin Heidelberg 2015
AbstractIt is important to study the subgrade characteristicsofhigh-speedrailwaysinconsiderationofthewater-soil coupling dynamic problem,especially when high-speed trains operate in rainy regions.This study develops a nonlinear water-soil interaction dynamic model of slab track couplingwithsubgradeunderhigh-speedtrainloadingbased on vehicle-track coupling dynamics.By using this model, thebasicdynamiccharacteristics,includingwater-soilinteraction and without water induced by the high-speed train loading,arestudied.Themainfactors-thepermeabilitycoefficien andtheporosity-influencin thesubgradedeformation are investigated.The developed model can characterize the soil dynamic behaviour more realistically,especially when considering the influenc of water-rich soil.
KeywordsWater-soil interaction·High-speed train
loading·Finite difference method·Subgrade deformation· Permeability coefficien·Porosity
1 Introduction
In 1856,Darcy established a linear law of seepage.Since then many advances have been made in seepage mechanics, and theoretical basics have been provided for engineering calculations.Most previous studies did not consider the interaction between pore fluiflw and porous media deformation.However,many seepage problems with surface settlement involve fluid-soli interaction[1].Terzaghi[2], as an early researcher of the fluid-soli coupling deformationphenomenon,proposedaone-dimensionalconsolidation model based on the concept of effective stress that was widely used for solving solid mechanics problems.Biot later conducted further research on the interaction between a three direction deformation material and pore pressure. He also established a relatively perfect tridimensional consolidation theory based on the following assumptions:the material is isotropic and has a small linear elastic deformation,the pore fluiis incompressible and fill the pore space of the solid skeleton,and flui flw through a porous skeleton satisfie Darcy’s law[2].Two researchers,Barry [3]and Mercer[4],studied the flw and deformation in poroelasticity through a theoretical analysis and numerical simulation but did not study any applications.Nowadays, fluid-solicoupling seepage mechanics is widely applied in engineering,especially in tunnel engineering,highway subgrade construction,underground gas storage engineering,environmental engineering,chemical engineering,etc. For a high-speed railway,too,it is very important to consider the fluid-soli coupling in the subgrade in a water-rich area.
Alongwiththerapiddevelopmentofhigh-speedrailways, research on the dynamics of a high-speed railway is becomingincreasinglycomplicated.Originallyindependentvehicle system dynamics and track system dynamics were replaced by vehicle-track coupling dynamics.Since Winkler proposed the elastic foundation beam theory,for the dynamics of a subgrade,railway subgrade modelling has been developed considering a semi-infinit elastic foundation[5]and layeredelasticfoundation[6,7].However,thelayeredelastic body used to model the subgrade in previous studies did not fully characterize the real subgrade deformation.The plas-ticity of the subgrade and water-soil interaction also needs to be considered.
There was a study by Bian[8]who studied the consolidation and long-term settlement of soft soil ground induced by train traffi loading based on a 2.5-dimensional finit element method together with the thin layer element method. He investigated the influencof speed on subgrade settlement.In addition,Xiang[9]studied the consolidation deformation properties of a silt roadbed under the effect of a tide.Also,Chen[10]studied the dissipation of excess pore water pressure in the one-dimensional finit strain consolidation of soft clays.Another researcher,Xu[11],developed a one-dimensional continuity equation and conducted consolidation analysis of unsaturated soils with a high degree of saturation.In addition,Li[12]analysed one-dimensional consolidation problems considering the exponential flw law and time-dependent loading.Then Chen[13]investigated the deformation characteristics of slab track-subgrade with water level changes through a model test,the results of which showed that water has a very obvious influenc on subgrade deformation.However,the boundary of the model test is still different from that of an actual line. Therefore,more attention should be paid to subgrade deformation with water-soil interaction more realistically.The key factors related to the water flw should also be investigated.
In this study,to analyse the effect of water-soil coupling togetherwithhigh-speedtrainloadingonthesubgradedeformation,a coupling dynamic model consisting of a vehicle and the CRTS-I slab track is developed to determine the rail-supporting forces.The rail-supporting forces are used as the boundary loading for the coupling model of the slab trackandsubgradeconsideringthewater-soilinteraction.By usingthismodel,thebasicdynamiccharacteristicsincluding water-soilinteractionandwithoutwaterinducedbythehighspeed train loading are studied.Main factors-permeability coefficien and porosity-influencin the subgrade deformation are investigated.
2 Track-subgrade coupling model with water–soil interaction
In this study a program based on the fast Lagrangian method of continuum(FLAC)numerical method is written by using the FISH language for conducting nonlinear coupling dynamic analysis.Figure 1 shows the analysis process.
2.1Finite difference model of slab track
A two-dimensional finitdifference model of the CRTSI slab track system is built.Figure 2 shows the mesh and geometric dimensioning of the model.The model includes three layers:slab,asphalt cement mortar(CAM),and a concrete base.It contains 138 elements and 171 nodes.Table 1 shows the material parameters of CRTS-I slab track components.
2.2Finite difference model of subgrade
A two-dimensional finit difference model of the subgrade system is built.Figure 2 shows the mesh and geometric dimensioning ofthe model.The model includes three layers: the firs layer of subgrade bed,the second layer of subgrade bed,and the third layer of subgrade.It contains 2128 elements and 2223 nodes.
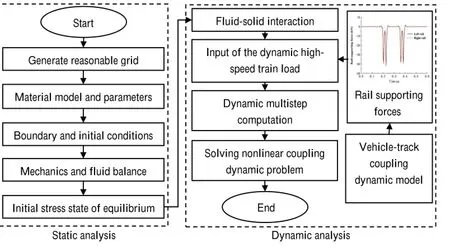
Fig.1 Process for nonlinear coupling dynamic analysis

Table 1 Material parameters of slab track components

Fig.2 Mesh and geometric dimensioning of CRTS-I slab track and subgrade
A viscoelastic artificia boundary[14]was applied to the bottom of the subgrade.This type of boundary can characterize the real behaviour of the subgrade bottom support and avoidwavereflectio ontheboundary.Theboundaryissimulatedusinganormalandtangentialspringanddamping.One end of the spring-damping is connected to the subgrade bottom,and the other end is fi ed.Springs and dampers shown in Fig.2 are described in Eqs.(1)and(2)(Appendix).Both sides of the subgrade are free.The top surface and both sides of the subgrade are considered to be permeable boundaries.
The constitutive relation of the subgrade is the Mohr-Coulomb elastic-plastic model.Tables 2 and 3,respectively, show the solid parameters and the fluiparameters of the subgrade components.

Table 2 Solid material parameters of subgrade components

Table 3 Fluid material parameters of subgrade components
2.3Contact model between track and subgrade
The contact relationship between the concrete base and the topsurfaceofthesubgradeissimulatedbyzerothicknesselements.TheconstitutiverelationistheCoulombshearmodel. Thecontactzoneincludesdoublesurfaces.Thecontactlogic method is used to search for the contact point,which gives thepointoneachofthetwosurfacestobeusedcontinuously. Figure 3 shows the force diagram of the contact surface. Taking point N as an example,LNindicates the length controlled by contact point N.The points closest to point N are M and P.Therefore,LNis equal to half of the distance from N to M and from N to P.Thus,the interface is divided into several continuous parts with length Li.Each part is controlled by point i(I,Q,M,N,P,and O in Fig.3).In Fig.3,S is the slider,T is the tensile strength,knis the normal stiffness,and ksis the shear stiffness.The total load in the normal and tangential directions is determined using Eq. (3)(Appendix).Table 4 shows the parameters of the contact model.
2.4Water–soil interaction
FLAC models the flw of flui through a permeable solid, such as soil in this study.The flw modelling may be done by itself,independent of the usual mechanical calculation, or it may be done in parallel with the mechanical modelling, in order to capture the effects of fluid-soli interaction.One type of fluid-soli interaction is consolidation,in which the slow dissipation of pore pressure causes displacements tooccurinthesoil.Thistypeofbehaviorinvolvestwomechanical effects.First,changes in pore pressure cause changes in effective stress,which affect the mechanical response of the soil.Second,the flui in a zone reacts to mechanical volume changes by a change in pore pressure.This study models the water-soil interaction in subgrade using the FLAC.Watersoil interaction should satisfy the following assumptions:
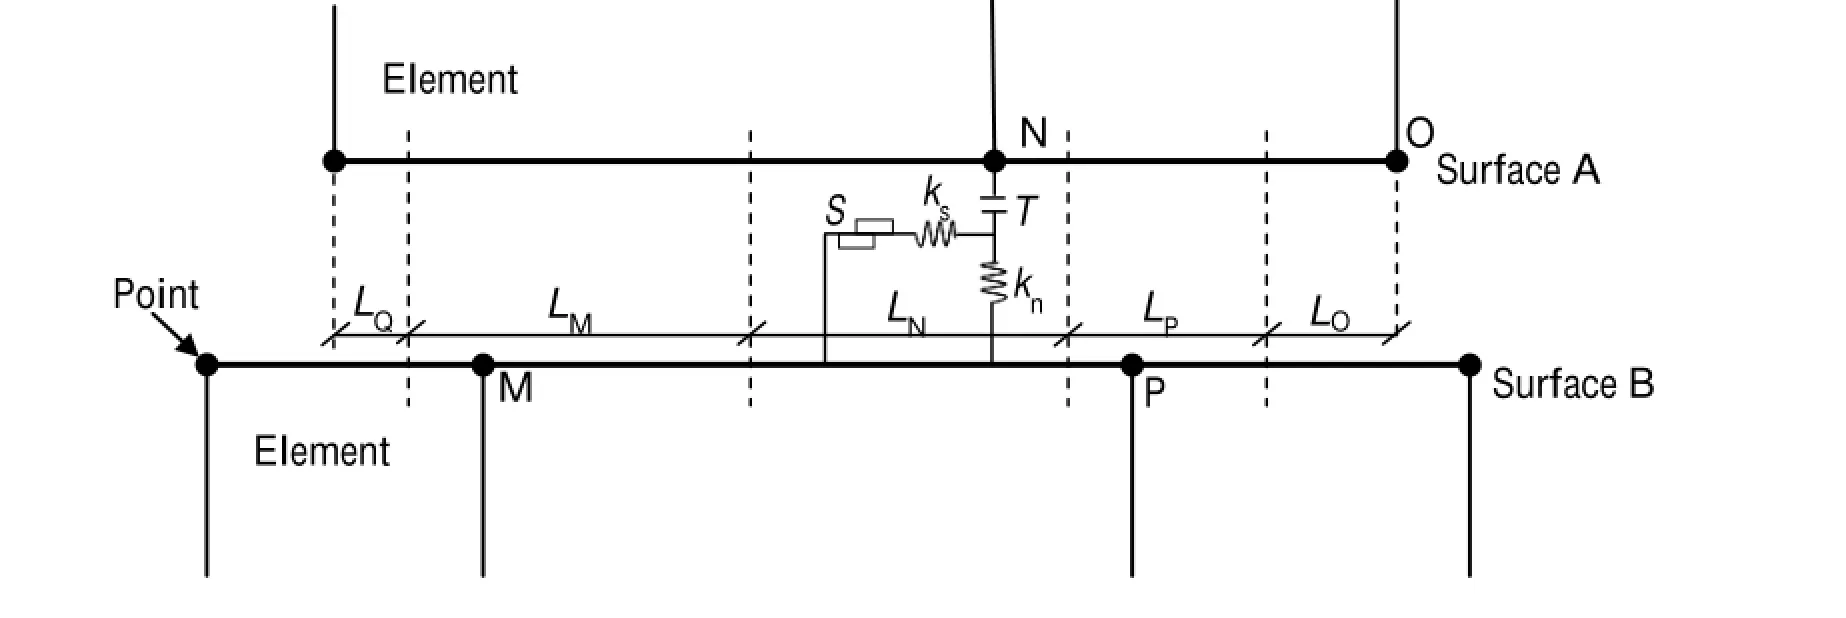
Fig.3 Force diagram of contact surface

Table 4 Parameters of contact model
(1)Porous medium skeleton only has a small strain;
(2)Solid particles in porous medium(soil particles)are incompressible;
(3)The flw of pore water obeys Darcy’s law;
(4)Theinfluenc ofcapillarypressureisneglected(theflui pressure is equal to air pressure when saturation is less than one),and the air pressure is zero in the unsaturated zone.
Thevariablesinvolvedinthedescriptionofflui flwthrough soil are the pore pressure,saturation,and the three components of the specifi discharge vector.These variables are related through the flui mass-balance equation,Darcy’s law forflui transport,aconstitutiveequationspecifyingtheflui response to changes in pore pressure,saturation,and volumetric strains.Pore pressure influenc is involved in the mechanical constitutive laws to complete the fluiflwmechanical coupling.Assuming the volumetric strain rates are known,substitution of the mass balance equation into theflui constitutiverelation,usingDarcy’slaw,yieldsadifferential equation in terms of pore pressure and saturation that can be solved for particular geometries,properties,and boundary and initial conditions.
The differential equations mentioned above describing the water-soil interaction in subgrade,and corresponding to FLAC’s numerical implementations are given in the appendix.
2.5Load condition
Figure 4 shows the coupling dynamic model of a vehicle and CRTS-I slab track that is used to predict the discrete railsupporting forces when a vehicle passes through the slab track.A high-speed railway vehicle is considered a rigid multi-body model in which the car body is supported on two double-axle bogies with a primary and a secondary suspension system.The dynamic model of the slab track subsystem includes the rail,fastener system,slab,CA mortar,and concrete base.The rail is treated as a continuous Timoshenko beam resting on rail pads,and the lateral,vertical,and torsional motions of the rail are considered simultaneously. When calculating the dynamic response of the vehicletrack,the tracing-curve-method[15]is adopted to locate the wheel-rail contact geometry.The non-linear Hertzian elastic contact theory is used to calculate the wheel-rail normal contactforces.Thetangentialwheel-railcreepforcesaref rst calculated using Kalker’s linear creep theory and then modifie using the Shen-Hedrick-Elkins nonlinear theory[16]. Moving rail-supporting is adopted as a new vehicle-track couplinginterfaceexcitationmodel(calledthe“trackingwindow”)[17-19].This excitation model well simulates the moving real vehicle under the excitation of discrete sleepers, and it can save a lot of computation time.The vehicle-track interaction is solved using a new explicit integration method [20].
The rail-supporting forces at fastener i can be calculated using Eq.(9)(Appendix)by the coupling dynamic model of the vehicle and CRTS-I slab track shown above.
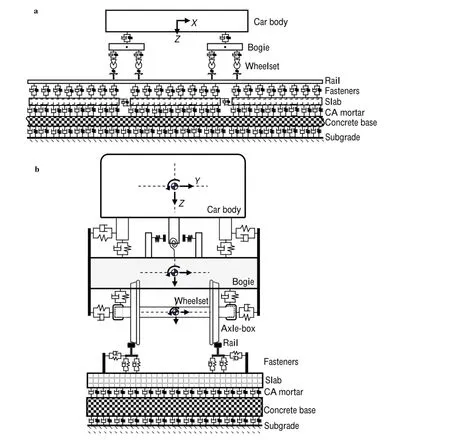
Fig.4 Coupling dynamic model of a vehicle and a CRTS-I slab track.a Elevation.b End view
Therail-supportingforcesalongthelongitudinaldirection of the track can be equivalent to one force by superimposing rail-supporting forces.In the process of superposition,each force should be multiplied by a track reduction factor along the longitudinal direction.Therefore,highspeed train loading onto the slab surface can be calculated using an equivalent method as given in Eq.(10)(Appendix).
The equivalent rail-supporting force is taken as the input of the 2D finit difference coupling model of the slab track andsubgrade.Thisequivalentrail-supportingforceisapplied to the fastener.
3 Results and discussions
In the present analysis,the vehicle speed is 250 km/h.Typical rail irregularities characterized by wavelengths between 1 and 30 m are selected to excite the vehicle-track coupling dynamic system,as shown in Fig.5a.Figure 5b,c respectively show the time histories of the equivalent railsupporting forces with and without irregularities when the vehicle passes through the slab track.The passes of the four wheels(W1-W4)produce the four peaks observed in the fig ures.Figure 5b shows that the peaks corresponding to four wheels that are approximately equal without considering theirregularity.Figure 5c shows that the peaks corresponding to four wheels that are unequal due to the influenc of a rail irregularity,which causes the pitching motion of the bogie. Thus,W1(W2)is approximately equal to W3(W4).In this paper,the equivalent rail-supporting forces with irregularities in Fig.5c are used to excite the track-subgrade coupling dynamic model.
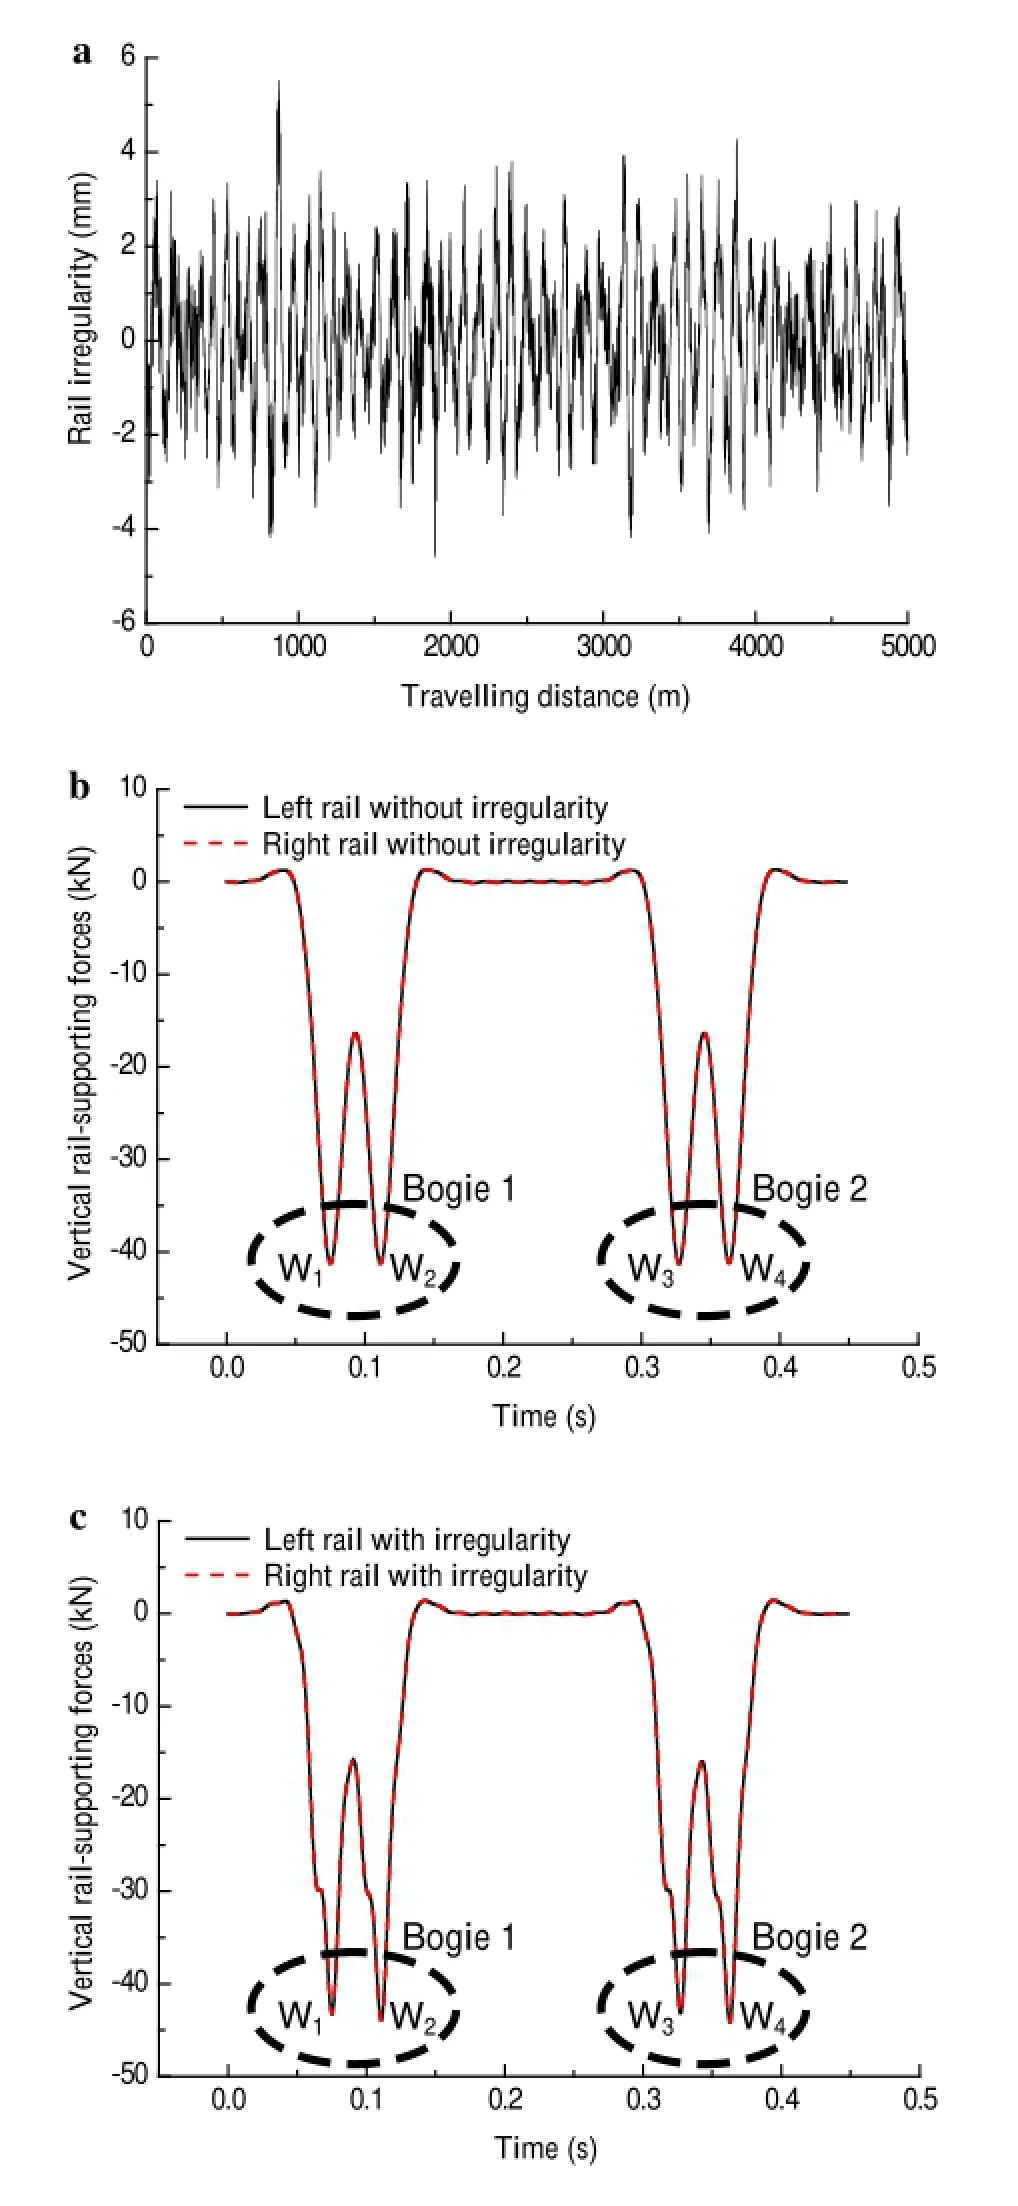
Fig.5 Rail irregularity and equivalent rail-supporting forces.a Rail irregularity.b Equivalent rail-supporting forces without irregularity.c Equivalent rail-supporting forces with irregularity
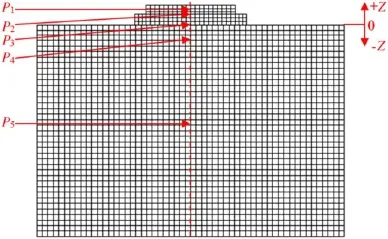
Fig.6 Monitoring location diagram

Fig.7 Vertical stress with depth
3.1Dynamic behaviour of subgrade under water–soil interaction
3.1.1Subgrade stress
Figure 6 shows the zero point and the vertical positive direction.Piis define as the point at the central line of the track ontheinterfaceoftwomaterials(P1:betweenslabandCAM, P2:between CAM and concrete base,P3:between concrete base and the firs layer of the subgrade,P4:between the firs layer and the second layer of the subgrade,P5:between the second layer and the third layer of the subgrade).Figure 7 shows the vertical stress with depth under the high-speed train loading.The cases with considering water and without water are compared.Figure 7 shows that the vertical stress includingwaterishigherthanthatwithoutwater.Forthecase withoutwater,theexternalpressureinducedbythetrainload is supported only by soil.However,for the case including water,the total stress induced by the train load is supported bybothsoilandtheporewater.Thecomponentsupportedby the soil causes the effective stress of the soil and the compo-nentsupportedbythewaterinducestheexcessporepressure. So,the interaction between water and soil leads to the higher stress.
Figure8showstheverticalstressattenuationcoefficien of the cases including water and excluding water.The vertical stress of the cases including and excluding water attenuate quickly from top to P4,and the vertical stresses basically complete the attenuation when the depth reaches P5.It also canbeseenthattheattenuationcoefficien ofthecaseincluding water is higher than that excluding water.
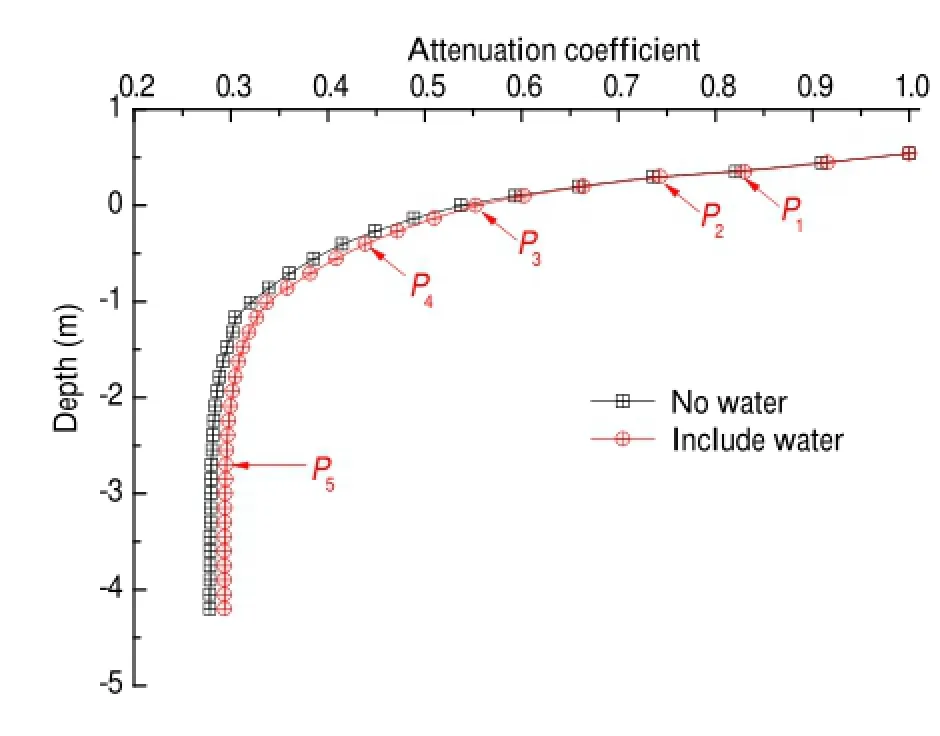
Fig.8 Attenuation coefficien with depth

Fig.9 Vertical deformation with depth
3.1.2Subgrade deformation
Figure 9 shows that the vertical deformation decreases with anincreaseinverticaldepth.InFig.9,themeaningof P1-P5is the same to that in Sect.3.1.1.The existence of inflectio points,such as P1,P2,and P3,is mainly because of the obvious material differences between adjacent layers.When the high-speed train passes,the water is squeezed out of the subgrade boundary,as is shown in Fig.10,and the soil is compressed easily.Thus,the vertical deformation including water is higher than that without water.
3.2Influenc of permeability coefficien and porosity on
subgrade deformation under high-speed train loading and water–soil interaction
The influencof the permeability coefficien of the three layers of subgrade is investigated.In the firs layer,the permeability coefficient of 1×10⁻³cm/s,5×10−3cm/s, 1×10⁻²cm/s,5×10−2cm/s,and1×10−1cm/sareusedand namedasL1-PA,L1-PB,L1-PC,L1-PD,andL1-PEforconvenience.Inthesecondlayer,thepermeabilitycoefficient of 5×10⁻⁴cm/s,1×10−3cm/s,5×10−3cm/s,1×10−2cm/s, and5×10−2cm/sareusedandnamedasL2-PA,L2-PB,L2-PC,L2-PD,and L2-PE.In the third layer,the permeability coefficient of5×10−4cm/s,1×10−3cm/s,5×10−3cm/s, 1×10⁻²cm/s,and 5×10⁻²cm/s are used and named as L3-PA,L3-PB,L3-PC,L3-PD,and L3-PE.

Fig.10 Fluid vector in subgrade
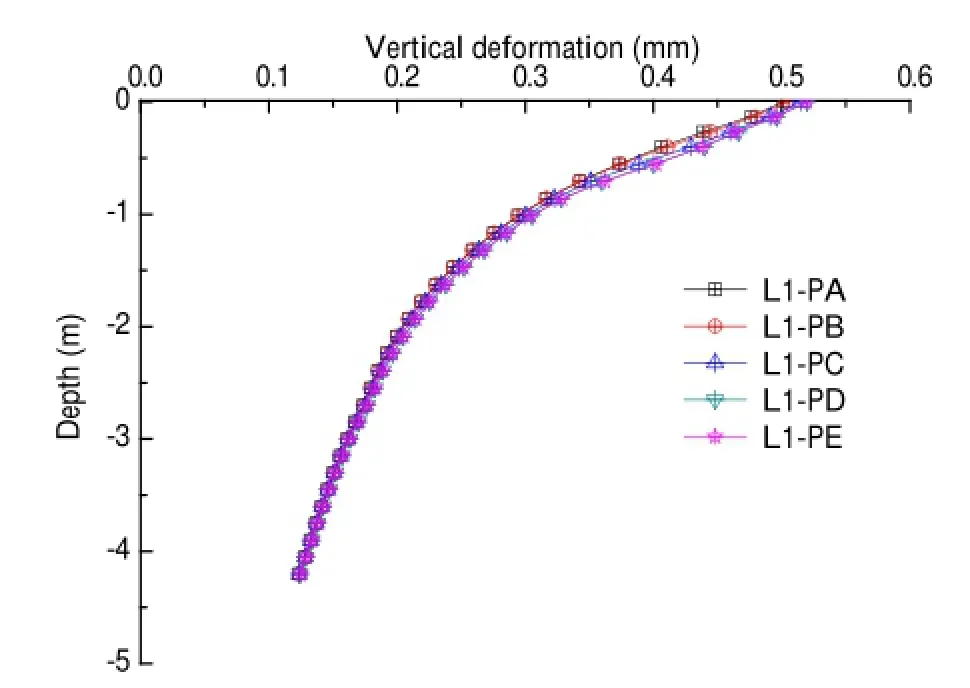
Fig.11 Vertical deformation influence by permeability coefficient of the firs layer
Figure 11 shows that the subgrade deformation along with the change of depth influence by different permeability coefficient in the firs layer.With the increase of the permeability coefficien in the firs layer,the vertical deformation increase slowly in the firs layer(−0.4 to 0 m).Thissuggests that the larger permeability coefficien leads to the water squeezed out of the subgrade easier,and then leads to larger subgrade deformation.As for the smaller deformation increase,there are two main reasons.The firs reason is that the firs layer itself has a large friction coefficient The other reasonisthattherelativelylargeYoung’smodulusofthefirs layer leads its smaller deformation range.The deformation changes below the firs layer are small.This indicates that the change of the permeability coefficien in the firs layer has little impact on the second and third layers.
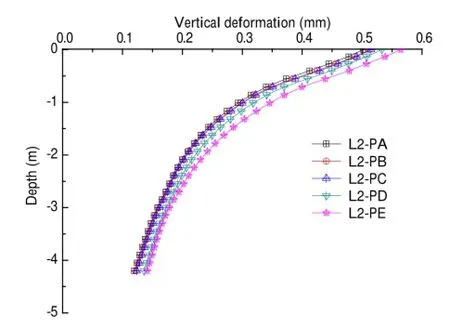
Fig.12 Vertical deformation influence by permeability coefficient of the second layer
Figure 12 shows that the subgrade deformation along with the change of depth influenceby different permeability coefficient in the second layer.With the increase of the permeability coefficien in the second layer,the vertical deformations in the firs layer(−0.4 to 0 m)and the second layer(−2.7 to 0.4 m)increase more obviously than that in thethirdlayer.Thedeformationofthesecondlayerincreases obviously due to the permeability coefficien changes of this layer.The deformation of the firs layer increases obviously due to the deformation of the second layer.The changing rules of the vertical deformations of the firs layer and the second layer with the permeability coefficien are similar. Therefore,the deformation of the subgrade top is chosen for studying the change rule with the permeability coefficient The relationship between the vertical deformation(z)and the permeability coefficien(k)can be fitte with a Logistic Formula(11)(Appendix).Figure 13 shows the fittin curve of subgrade top deformation changing with the permeability coefficien inthesecondlayer.Inthebeginningstagethevertical deformation increases quickly with an increase in the permeability coefficient Then it increases slowly.
Figure14showsthatthesubgradedeformationalongwith the change of depth influenceby different permeability coefficient inthethirdlayer.Withtheincreaseofthepermeabilitycoefficien inthethirdlayer,theverticaldeformations inthethreelayersofthesubgrade(−5.7to0m)increase.The rulesoftheverticaldeformationsofthethreelayerschanging with the permeability coefficien in the third layer are similar to that changing with the permeability coefficien in the second layer.The relationship between vertical deformation (y)and permeability coefficien(x)can be also fitte with a Logistic Formula(11)(Appendix).

Fig.13 Fitting curve-deformation changing with the permeability coefficien in the second layer
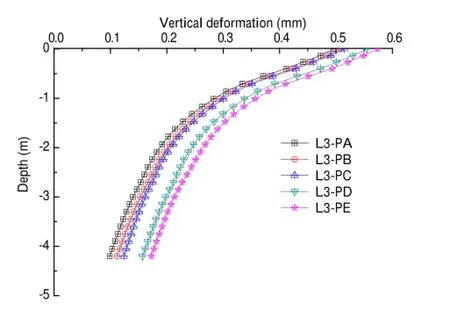
Fig.14 Vertical deformation influence by permeability coefficient of the third layer
Figure 15 shows the fittin curve of subgrade top deformationchangingwiththepermeabilitycoefficien inthethird layer.
In order to investigate the influencof the permeability coefficien on the subgrade deformation in three layers, the permeability coefficien influenc factor is define to be Eq.(12)(Appendix).
According to Eq.(12)(Appendix),the permeability coefficien influencfactors with the changing permeability coefficien in the firs layer,the second layer,and the third layer,respectively,areshowninFig.16.Thelargerinfluenc factor means that the permeability coefficien influence the deformation more obviously.The permeability coefficien influenc factorhasalocalmaximumindepthcorrespondingtothefirs layerwhenthepermeabilitycoefficien changesin the firs layer.The permeability coefficien influenc factor has a local maximum in depth corresponding to the second layer when the permeability coefficien changes in the second layer.The permeability coefficien influenc factor has a maximum in depth corresponding to the third layer when the permeability coefficien changes in the third layer.By comparing these three cases,it can be seen that the influ ence factor is the largest when the permeability coefficien changes in the third layer.
Permeability coefficien affects the subgrade deformation by changing the water flw ability through the soil porosity. So,the porosity itself is also an important factor affecting the subgrade deformation.Figure 17 shows the vertical deformation on the subgrade top influence by the porosity permeability coefficien in the third layer.In Fig.17,PA, PB,PC,PD,and PE represent permeability coefficient of 5×10⁻⁴cm/s,1×10−3cm/s,5×10−3cm/s,1×10−2cm/s, and 5×10⁻²cm/s,respectively.It can be seen from Fig.17 that the deformationscorresponding to fi e permeability coefficient increase with the increase of porosity.It indicates that the increase of the porosity and the permeability coefficien both lead to the water squeezed out of the subgrade easily,and then lead to the increase of the subgrade deformation.
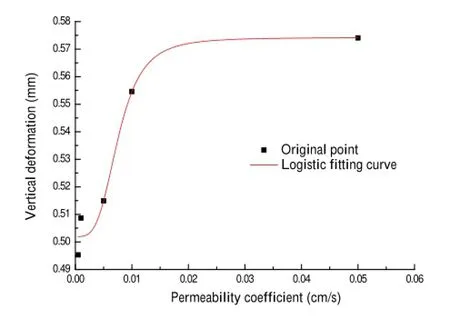
Fig.15 Fitting curve-deformation changing with the permeability coefficien in the third layer
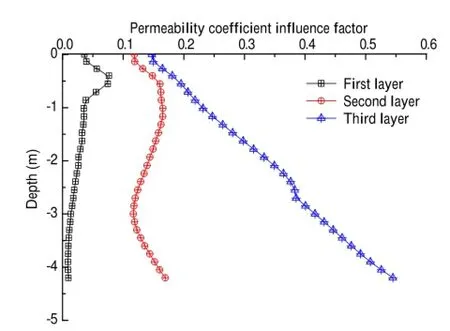
Fig.16 Thepermeabilitycoefficient asaninfluenc factorofthethree layers

Fig.17 Vertical deformation influence by both permeability coeffi cients and porosities
4 Conclusions
A 2D finit difference model of the slab track coupled with the subgrade considering the fluid-soli interaction is established.The equivalent rail-supporting forces obtained by the vehicle-trackcouplingdynamicmodelaretakenastheinputs to the track/subgrade model.By using the model,the basic dynamic characteristics and two main factors after considering the water influencinthe subgrade deformation are studied.The following conclusions can be drawn from the results:
(1)When the high-speed train passes,the water induces the excessporepressure,whichleadstoverticalstressincludingwaterthatishigherthanthatwithoutwater.Thewater squeezed out of the subgrade boundary leads to vertical deformationincludingwaterthatishigherthanthatwithout water.
(2)The permeability coefficien of the firs layer has little impact on the subgrade deformation.The permeability coefficient of the second layer and the third layer affect the subgrade deformation more obviously than that of the firs layer.The permeability coefficien changing in one layer affects the deformations itself and its above layers significantl.The increase of the porosity and the permeability coefficien both lead to the increase of the subgrade deformation.AcknowledgmentsThis work was supported by the National Natural Science Foundation of China(Grants U1134202,51305360),the NationalBasicResearchProgramofChina(Grant2011CB711103),and the 2015 Doctoral Innovation Funds of Southwest Jiaotong University.
Appendix
Equations and Symbols:

where Ktand Knare,respectively,the tangent and normal stiffness,Ctand Cnare,respectively,the tangent and normal damping,and G is the shear modulus.R is the equivalent length between the source and the boundary,and Δl is the smallest mesh size(0.15 m).Csis the shear wave velocity, and Cpis the press wave velocity.Csand Cpare calculated by using Eq.(2)as

where G,K and ρ are,respectively,shear modulus,bulk modulus,and density of the remaining part under the subgrade bed.These parameters can be seen or calculated from Table 2.

Transport Law:
The fluitransport is described by Darcy’s law.For a homogeneous,isotropic soil and constant water density,this law is given in the form:

whereqiisthespecifi dischargevector,p isporepressure,k istheabsolutemobilitycoefficient(permeability)ofthesoil, ˆk(s)is the relative mobility coefficient which is a function offlui saturation,s(inFLAC,ˆk(s)=s2(3−2s)),ρfisthe flui density,and gj,j=1,2 are the two components of the gravity vector.
Balance Laws:

For small deformations,the fluimass balance can be expressed as where ζ is the variation of water volume per unit volume of soil due to diffusive flui mass transport,as introduced by Biot(1956).Note that fluiis compressible,which is reflecte by the flui modulus Kf=Δp/(ΔVf/Vf).

The balance of momentum has the form where ρ=(1−n)ρs+nsρwis the bulk density,and ρsand ρware the densities of the soil and water,respectively.Note that(1−n)ρscorresponds to the dry density of the matrix.
Constitutive Laws:
In the FLAC,changes in the variation of fluicontent are related to changes in pore pressure p,saturation s,and mechanical volumetric strains ε.The response equation for the pore flui is formulated as where M is the Biot modulus[N/m2],n is the porosity,and α is the Biot coefficient

The constitutive response for the soil has the form

whereσi′jistheeffectivestressrate,H isthefunctional form oftheconstitutivelaw(Mohr-Coulombmodelinthisstudy), κ is a history parameter,δijis the Kronecker delta,and ξijis the strain rate,which can be transformed into displacement (velocity,acceleration)accordingtocompatibilityequations. In the FLAC numerical approach,the flw domain is discretized into quadrilateral zones define by four nodes.(The same discretization is used for mechanical concerns,when applicable.)Both pore pressure and saturation are assumed tobenodalvariables.Internally,eachzoneissubdividedinto a triangle,in which the pore pressure and the saturation are assumed to vary linearly.The numerical scheme relies on a finit difference nodal formulation of the flui continuity equation.The formulation can be paralleled to the mechanical constant stress formulation that leads to the nodal form of Newton’s law.It is obtained by substituting the pore pressure,specifi dischargevector,andpore-pressuregradientfor velocity vector,stress tensor,and strain-rate tensors,respectively.Theresultingsystemofordinarydifferentialequations is solved using an explicit mode of discretization in time.

where Fsupis the discrete rail-supporting force,ksupand csupare,respectively,the supporting stiffness and damping,and Zsupand˙Zsupare,respectively,the displacement and the velocity.

where kiis the reduction factor.For a slab track,according tothereductionanalysisbyusingtheANSYS,k0is1,k±1= 0.286,k±2=0.0038,k±3=0.00055,k±4=0.00031,and soon.Thefastenernumberwithinavehiclelengthis(2n+1)(n=10).

where k0=0.01145,p=2.1297,A=0.56756,and B= 0.50654 for the subgrade top.

whereα isthepermeabilitycoefficien influenc factor,zmax, zmin,and zmidare the maximum,minimum,and middle deformationindifferentdepths,respectively.i=1,2,3corresponds to the changing permeability coefficien in the firs layer,the second layer,and the third layer,respectively.
References
1.Dong,P.C.:The problems of fluid-soli coupling and its advance in research.J.Geomech.5,17-26(1999).(in Chinese)
2.Kong,X.Y.:Higher Seepage Mechanics,2nd edn.Press of UniversityofScienceandTechnologyofChina,Hefei(2010).(inChinese)
3.Barry,S.I.,Mercer,G.N.:Flow and deformation in poroelasticity-I unusual exact solutions.Math.Comput.Modell.30,23-29(1999)
4.Mercer,G.N.,Barry,S.I.:Flowanddeformationinporoelasticity-II numerical method.Math.Comput.Modell.30,31-38(1999)
5.Hung,H.H.,Yang,Y.B.:Elastic waves in visco-elastic half-space generatedbyvariousvehicleloads.SoilDyn.Earthq.Eng.21,1-17 (2001)
6.Chen,S.S.:The Response of Multilayered System to Dynamic Surface Loads[Ph.D.Thesis].University of California,Berkeley (1987)
7.Maffeis,A.,Seandella,L.,Stupazzin,M.,et al.:Numerical prediction of low-frequency ground vibrations induced by high-speed trains at Ledsgaard.Sweden,Soil Dyn.Earthq.Eng.23,425-433 (2003)
8.Bian,X.C.,Zeng,E.X.,Chen,Y.M.:Long-term settlements of soft soilgroundinducedbytraintraffi load.RockSoilMech.29,2990-2996(2008).(in Chinese)
9.Xiang,X.C.,Hou,J.S.,Zhu,C.Q.:Consolidation deformation properties of silt roadbed under effect of tide.Rock Soil Mech. 30,1142-1146(2009).(in Chinese)
10.Chen,J.Y.,Gong,X.N.,Deng,Y.H.:Research on dissipation of excess pore water pressure in one-dimensional finit strain consolidation of soft clays.Rock Soil Mech.30,191-195(2009).(in Chinese)
11.Xu,H.F.,Xie,K.H.:One-dimensional continuity equation and consolidation analysis of unsaturated soils with high degree of saturation.J.Civil Archit.Environ.Eng.33,23-27,68(2011).(in Chinese)
12.Li,C.X.,Xie,K.H.,Lu,M.M.,et al.:One-dimensional consolidationanalysisconsideringexponentialflwlawandtime-depending loading.Rock Soil Mech.32,553-558,578(2011).(in Chinese)
13.Chen,R.P.,Zhao,X.,Jiang,H.G.,etal.:Modeltestondeformation characteristicsofslabtrack-subgradeunderchangesofwaterlevel. J.China Railw.Soc.36,87-93(2014)
14.Liu,J.B.,Gu,Y.,Du,Y.X.:Consistent viscous-spring artificia boundaries and viscous-spring boundary elements.Chinese J. Geotech.Eng.28,1070-1075(2006)
15.Chen,G.,Zhai,W.M.:Anewwheel/railspatiallydynamiccoupling model and its verification Veh.Syst.Dyn.41,301-322(2004)
16.Shen,Z.Y.,Hedrick,J.K.,Elkins,J.A.:Acomparisonofalternative creep-force models for rail vehicle dynamic analysis.Veh.Syst. Dyn.12,79-83(1983)
17.Xiao,X.B.,Jin,X.S.,Wen,Z.F.:Effect of disabled fastening systems and ballast on vehicle derailment.J.Vib.Acoust.Trans. ASME 129,217-229(2007)
18.Jin,X.S.,Wen,Z.F.:Effect of discrete track support by sleepers on rail corrugation at a curved track.J.Sound Vib.315,279-300 (2007)
19.Ling,L.,Xiao,X.B.,Jin,X.S.:Developmentofasimulationmodel for dynamic derailment analysis of high-speed trains.Acta Mech. Sin.30,860-875(2014)
20.Zhai,W.M.:Two simple fast integration methods for large-scale dynamic problems inengineering.Int.J.Numer.Methods Eng.39, 4199-4214(1996)
6 April 2015/Revised:17 June 2015/Accepted:30 June 2015/Published online:9 November 2015
✉Xue-Song Jin xsjin@home.swjtu.edu.cn
1State Key Laboratory of Traction Power,Southwest Jiaotong University,Chengdu 610031,China
2China Railway Corporation,Beijing 100844,China
杂志排行
Acta Mechanica Sinica的其它文章
- Correcting the initialization of models with fractional derivatives via history-dependent conditions
- Tomographic PIV investigation on coherent vortex structures over shark-skin-inspired drag-reducing riblets
- Analysis of the geometrical dependence of auxetic behavior in reentrant structures by finit elements
- The equilibrium stability for a smooth and discontinuous oscillator with dry friction
- Impact toughness of a gradient hardened layer of Cr5Mo1V steel treated by laser shock peening
- Why a mosquito leg possesses superior load-bearing capacity on water:Experimentals
