A cavitation model for computations of unsteady cavitating flws
2016-09-06YuZhaoGuoyuWangBiaoHuang
Yu Zhao·Guoyu Wang·Biao Huang
A cavitation model for computations of unsteady cavitating flws
Yu Zhao1·Guoyu Wang1·Biao Huang1
©The Chinese Society of Theoretical and Applied Mechanics;Institute of Mechanics,Chinese Academy of Sciences and Springer-Verlag Berlin Heidelberg 2015
AbstractA local vortical cavitation(LVC)model for the computation of unsteady cavitation is proposed.The model is derived from the Rayleigh-Plesset equations,and takes into account the relations between the cavitation bubble radius and local vortical effects.Calculations of unsteady cloud cavitating flws around a Clark-Y hydrofoil are performed to assess the predictive capability of the LVC model using well-documented experimental data.Compared with theconventionalZwart’smodel,betteragreementisobserved between the predictions of the LVC model and experimental data,including measurements of time-averaged flw structures,instantaneous cavity shapes and the frequency of the cloud cavity shedding process.Based on the predictions of the LVC model,it is demonstrated that the evaporation process largely concentrates in the core region of the leading edge vorticity in accordance with the growth in the attached cavity,and the condensation process concentrates in the core region of the trailing edge vorticity,which corresponds to the spread of the rear component of the attached cavity.Whentheattachedcavitybreaksupandmovesdownstream,the condensation area fully transports to the wake region,which is in accordance with the dissipation of the detachedcavity.Furthermore,usingvorticitytransportequations,we also finthat the periodic formation,breakup, and shedding of the sheet/cloud cavities,along with the associated baroclinic torque,are important mechanisms for vorticity production and modification When the attached cavitygrows,theliquid-vapourinterfacethatmovestowards the trailing edge enhances the vorticity in the attached cavity closure region.As the re-entrant jet moves upstream,the wavy/bubbly cavity interface enhances the vorticity near the trailing edge.At the end of the cycle,the break-up of the stable attached cavity is the main reason for the vorticity enhancement near the suction surface.
KeywordsCavitation·Transport-based model·Vortex structure
1 Introduction
Cavitation is a dynamic phase-change phenomenon that occurs in liquids when the static pressure drops below the vapour pressure of a liquid[1,2].It is well known that the unsteady cavitation in turbo-machinery and marine control surfaces leads to various problems,such as material damage,vibration,noiseandreduced efficien y[3,4].Cavitating flws in most industrial applications are turbulent,and the dynamics of the developed interface involve complex interactions between the vapour and liquid phases,which are still not well understood.
The computational modelling of cavitation has been pursuedformanyyears.TheNavier-Stokes-basedcomputations of turbulent cavitating flws have received increased attention due to advances in computational capabilities and in the physical modelling of these problems.Studies in this fiel may be classifie into two categories:the interface fit ting method and the continuum modelling method.Interface methods assume that there is a clear and distinct interface between the liquid and vapour that can be determined via an iterative procedure.The applications of this method are limitedtosimplerproblemsinwhichthecavitycanbedescribed as a well-defineclosed volume of pure gas.Thus,thismethod is sufficien once the cavity is detached[5-7].In contrast,a continuum method does not attempt to track the liquid and vapour interface;the method treats the flw as two phases with an averaged mixture density,which continuously varies between the liquid and vapour extremes. These two-phase models are becoming increasingly popular because they include the physics of cavitating flws.
The two-phase models are implemented using different approaches:the homogeneous model and the two-flui method.The two-fluiapproach assumes that both phases co-exist at every point in the flw fiel and that each phase is governed by its own set of Navier-Stokes equations.In these models,the transfer terms are generally very difficul to obtain[8].In contrast,the homogeneous model treats the flws as a mixture of two fluid behaving as one.In this approach,the relative motion between phases is neglected, and the multiphase flw is treated as a single continuous phase and shares the same set of Navier-Stokes equations. Considering the simplicity and low computation cost,it is clear why the homogeneous model attracts more attention.
Inhomogeneousmodels,additionalequationsarededuced tosolveforthevapourandliquidvolumefractions.Twomain categories of additional equations are well known:the equations of state(EOSs)and transport-based equations(TEMs). In the firs category,the density is directly coupled to the pressure via the equations of state[8-14].However,these approaches fail to capture certain fundamental flui physics, such as baroclinic vorticity production,which has been demonstrated experimentally[15],and cannot account for the convection and transport phenomenon of the cavitation bubblesbecauseofthelackofacavitationtransportequation. In the second category,vapour volume/mass fraction distributiondataareobtainedthroughamodelledtransportequation based on the mass transfer between the vapour and liquid phases.Differentcavitationmodelshavedifferentsourceand sink terms.The Zwart[16,17]and Singhal[18]models are both based on the simplifie Rayleigh-Plesset equations for bubble dynamics.The Merkle[19]and Kunz[20]models employdimensionalargumentsandsemi-empiricalguidance to address source and sink terms.These models originate from the convective character of the equation,which enables modelling of the effects of inertial forces on cavities,such as elongation,detachment and drift of bubbles.The study by Senocak[21,22]addressed the source and sink terms usingtransportlawsacrossphaseboundaries.Intheirmodel, empirical constants can be replaced by the explicit calculations based on the interfacial dynamics.The above TEM models are widely used in computations of unsteady cavitating flws with different emphases.
Highlyvorticalflui motionisoftenobserveddownstream of the attached cavitation.This motion is caused by vorticity shedding into the flw fiel slightly downstream of the cavity.Such vortex cavitation generates a large cavitation cloud under certain conditions[16].It has been proven that the cloud cavitation is a large-scale vortex with many small cavitation bubbles[23,24].In addition,various studies have demonstrated the strong correlation between cavitation and vortex structures.In their research,Gopalan[15]observed that the collapse of the vapour structure is a primary mechanism of vorticity production and leads to the generation of hairpin vortices in the downstream region.Studies by Iyer [25]and Laberteaux[26]found that the streamwise velocity fluctuation increased with increased cavitation,which confirm that the collapse of the vapour cavities is a source of vorticity generation.Additionally,Huang[27]found that the periodic formation,breakup,shedding,and collapse of the sheet/cloud cavities,as well as the associated baroclinic and viscoclinic torques,are important mechanisms for vorticity production and modification To emphasise the vortex-cavitation interactions,cavitation models containing strong vortical effects are needed.
Hence,the goals of the present study are as follows: (1)Develop a transport equation-based vortex cavitation model.(2)Assess the predictive capability of the vortex cavitation model using well-documented experimental data. (3)Study the vortex-cavitation interactions in cloud cavitating flws.
2 Mathematical model
2.1Local vortical cavitation(LVC)model
Considering closed interrelations between cavitation and local vortical flws,the radii of bubbles are highly related to the vortex structure.Similar to the“rankine vortex”,considering the constant pressure inside the cavitation bubble, thepressuredistributionsofacavitatingvortexareasfollows

Here,pvis assumed to be the vapour pressure at the liquid temperature,p∞is the pressure of the surroundings,ρ is the density,Γ is the circulation of the free vortex,and r0is the radius of the central core.The central core of the cavitating vortex is regarded as the cavitation bubble.
Figure 1 shows the pressure distributions of various types of vortices.The pressure distributions of the“Rankine Vortex”and cavitating vortex are the same outside the central core region(r≥r0),which is dominated by a free vortex. Various pressure distributions inside the central core region (r≤r0)are highlighted.For the“rankine vortex”,the pressure in the central core region decreases as the circulation (Γ)increases.For the cavitating vortex,the pressure inside the bubble remains constant.According to the continuity ofpressure distributions,the pressure at the bubble boundary (r=r0)can be calculated as

Fig.1 Pressure distributions of different types of vortices

Then,the radius of the cavitation bubble can be determined by

This equation shows the relation between the bubble radius and the vortex structure.The bubble radius is a function of circulationinastaticenvironmentandsaturationvapourpressure.
The Rayleigh-Plesset equations describe the growth of a vapour bubble in a liquid

wherer0representsthebubbleradius,σrepresentsthesurface tension coefficient and pvrepresents the vapour pressure. Neglecting the second-order terms(which is appropriate for lowoscillationfrequencies)andthesurfacetension,theequation reduces to

Then,the rate of change of a single bubble mass is

If there are NBbubbles per unit volume,the volume fraction αgmay be expressed as

Then,thetotalinterphase masstransferrateduetocavitation per unit volume is

Considering the relation between the bubble radius and the vortex structure shown in Eq.(3),the total interphase mass transferrateduetocavitationperunitvolumecanbereduced to

Here,Fr=2π/|Γ|represents the local vortical effect. This expression has been derived assuming bubble growth. Meanwhile,as the vapour volume fraction increases,the vaporisation must decrease accordingly because there is less liquid.Thus,the condensation and vaporisation terms can be generalised as where CCond=45 and CVap=90000 are empirical constants.

Various methods can be used for the modelling of the function Fr.A simple format based on dimensional analysis is used in the present study:

Here,U∞is the reference velocity scale,and L0is the characteristic length scale.The lower limit is introduced for numerical stability reasons.fris called the rotating function and can be calculated as

Here,the Galilean-invariant factor r∗is calculated as r∗= |S/ω|(S and ω represent the shear strain rate and vorticity magnitude,respectively).Cr1=0.0isanempiricalconstant. Details of the rotating function frare shown in Fig.2,inwhich the logarithmic scale is used for r∗.The figur shows that when r∗=1,the constraint fr=1.0 is satisfie for flws without local vortical effects.
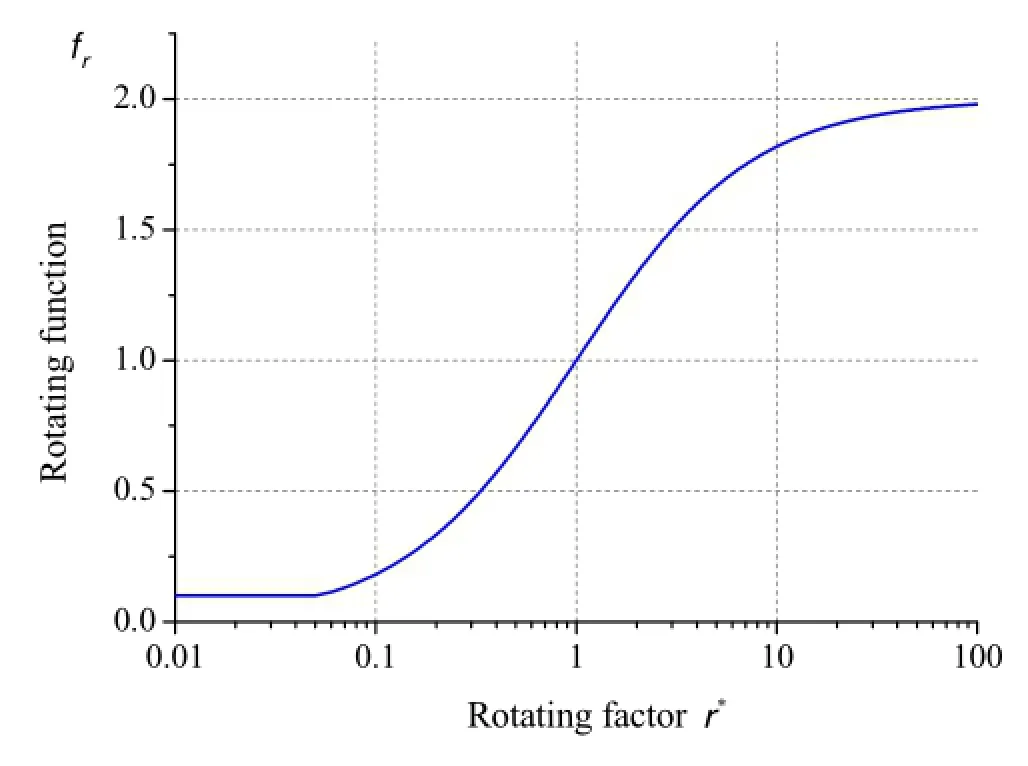
Fig.2 Distribution of rotating function with rotating factor
2.2Governing equations and turbulence model
The set of governing equations consists of the conservative form of the Favre-averaged Navier-Stokes equations plus a transport equation to account for the cavitation dynamics. The equations,written in Cartesian coordinates for ease of presentation,are as follows:
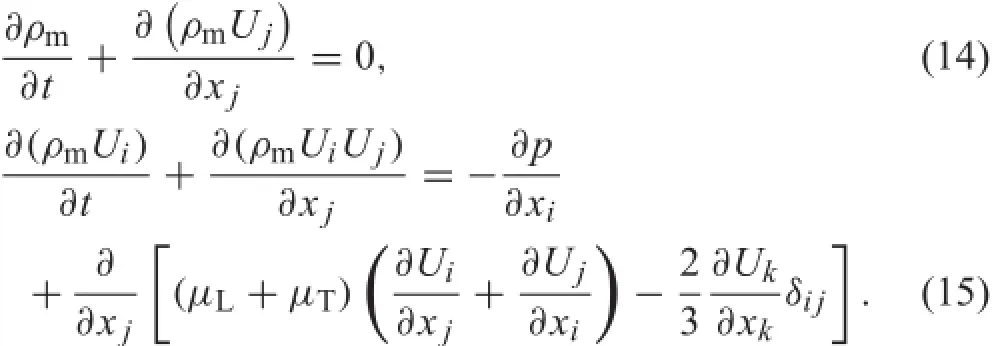
The mixture property φmcan be expressed as

where ρmis the mixture density;U is the velocity;p is the pressure;μLand μTare the laminar and turbulent viscosity, respectively;the subscripts i,j,k are the directions of the axes;the subscripts l and v denote liquid and vapour,respectively;and φ can be the density,viscosity,etc.A nominal density ratio of 1000 is used.
For the cavitation modelling,a transport equation with source terms is solved as follows

where αvis the vapour volume fraction and˙m+and˙m−are the liquid-vapour evaporation and condensation rates, respectively;the modelling of these terms is based on Eqs.(10)and(11).
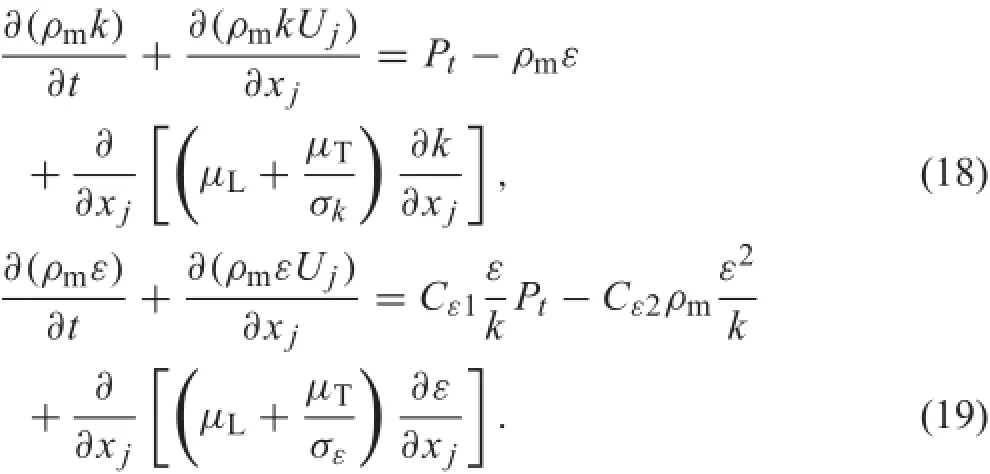
Thek−ε two-equationturbulencemodelwithawallfunction treatment is given as follows[28] Here,theproductiontermoftheturbulentkineticenergy(Pt)and the Reynolds stress tensor(τij)are define as

with Cε1=1.44,Cε2=1.92,σε=1.3,σk=1.0.The turbulent eddy viscosity is define as

The filte-based model(FBM)[29-32]is adopted.This model limits the influenc of the eddy viscosity based on the local numerical resolution,thus essentially forming a combined direct numerical simulation and RANS model. Specificall,the turbulent viscosity is corrected by comparing the turbulence length scale and the filte size Δ,which is based on the local mesh spacing:

Using the filte,the turbulence length scale is not resolved if it is less than the filte size.The filte size is chosen to be comparable to the maximum grid size:

Thus,if the grid resolution is significantl smaller than the turbulence length scale in the entire flw field the solution will approach that of a direct numerical simulation;for inadequately resolved computations,the Reynolds averaged Navier Stokes(RANS)model is recovered.With the appearance of the filte function in Eq.(23),the sensitivity to inlet turbulent quantities is reduced[29].
3 Computational setup
The computational domain and boundary conditions are given according to the experimental setup[27].As shown in Fig.3,the Clark-Y hydrofoil with a chord length of c=0.07m was located in a channel with height 2.86c,a length of 4c upstream of the leading edge,and a length of 8c downstream of the leading edge.The hydrofoil is fi ed with an angle of attack of α=8◦.
The two important dimensionless parameters are the Reynolds number Re and the cavitation number σ,which is define based on the outlet pressure p,i.e.,the saturated vapour pressure pv,and the inlet velocity U∞:

A structural mesh was used in this study,and the details are shown in Fig.3.O-H-type grids were generated near the hydrofoil.The calculation of the dimensionless distance from the hydrofoil surface under non-cavitating conditions is shown in Fig.4.The values of the dimensionless distance are almost 1.0.Moreover,the mesh near the hydrofoil, marked as the“refine zone”in Fig.3,is carefully checked with various node numbers.The investigation is performed by monitoring the values of the lift CLand drag CDcoeffi cients.Based on the comparisons with experimental results [33]shown in Fig.5,the mesh that contains 240×40 nodes was employed in this study.The total node count is 81088. The time integration scheme is a second-order backward Euler algorithm,and the spatial derivatives are computed using a second-order upwind scheme.In the computations, Δt=7×10⁻⁴s is chosen based on convergence studies, which gives an average CFL number of CFL=U∞Δt/Δx that is less than 10.In the FBM model,the filte size in Eq.(24)is chosen to be Δpresent=1.05Δmesh.Here,Δmeshis the largest grid size of the O-shaped grid around the hydrofoil in the computation domain and is approximately 0.012c.

Fig.3 Computational domain and mesh details
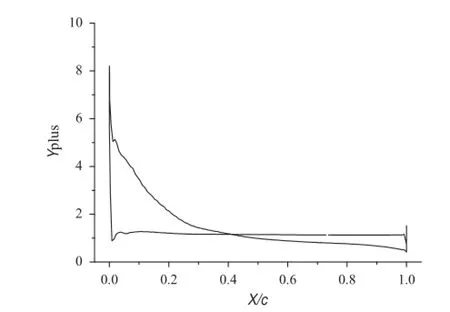
Fig.4 Dimensionless distance from the hydrofoil surface
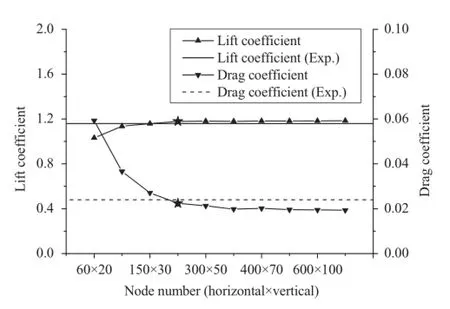
Fig.5 Mesh refinemen
4 Model validations
Figure 6compares the predicted mean values of the normalisedensemble-averaged velocity(U)profile atdifferent chord-wise locations.The profileare tracked along the vertical direction at different locations,namely,X/c= 0%,20%,40%,60%,80%,and 100%.In general,good agreement is observed between the experimental measure-ments and both Zwart’s and the LVC model’s predictions. However,slight differences can be observed near the trailing edge region,thus the LVC model’s predictions better agree with the experimental results compared with Zwart’s model.
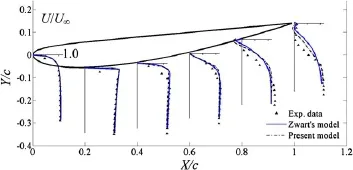
Fig.6 Comparisons of the time-averaged,experimentally measured U-velocity[33]and numerically predicted U-velocity with different models
It has been demonstrated that cloud cavitation exhibits a distinct quasi-periodic pattern[12,27,34].The features of the unsteady process include the attached cavity expanding up to the trailing edge,followed by breakup near the leading edge due to the re-entrant jet and the subsequent complete convection of the cloud cavity into the wake.The instantaneous contours of the liquid volume fraction are compared with experimental visualisations in Fig.7.The cavity visualisations are placed side by side for 10%,40%,70%,and 90%of each corresponding cycle.
At the beginning of the cycle,as shown from 10%to 40%of the cycle,a transparent attached cavity arises near the leading edge of the hydrofoil and continues to grow. Comparedwiththeexperimentalresults,theLVCmodelproduces better predictions than does Zwart’s model for both theattachedanddetachedcavity.First,theLVCmodel’spredictions can capture the formation of the attached cavity, which may cover the entire suction surface,while Zwart’s model predicts that the attached cavity will extend to the middle section of the hydrofoil.Second,the LVC model predicts that the detached cavity of the last cycle will undergo a displacement of approximately 0.5 chord lengths downstream from the trailing edge,while Zwart’s model predicts that the detached cavity will dissipate soon after shedding from the trailing edge.Then,as shown from 40%to 70% of the cycle,when the stable attached sheet cavity grows to its maximum length,the adverse pressure gradient is sufficientl strong to overcome the weaker momentum of the flw confineby the near-wall region,and a re-entrant jet forms and moves upstream.From the experimental cavitation patterns,we observe the re-entrant jet moving upstream leads to a higher spreading rate of the attached cavity and the formation of a large cavitating structure.The LVC model can clearly capture this large cavitating structure,whereas Zwart’s model cannot capture it.Finally,at the end of the cycle,as the re-entrant flw cuts off the attached cavity,the large cavity structure moves downstream in the form of a cloudcavity.Meanwhile,anewattachedcavitygrowsforthe next cycle,which can be well captured by the LVC model.
Comparisons between the shedding processes predicted with different models are presented in Fig.8.The x-axis is a dimensionless time Tref,define as
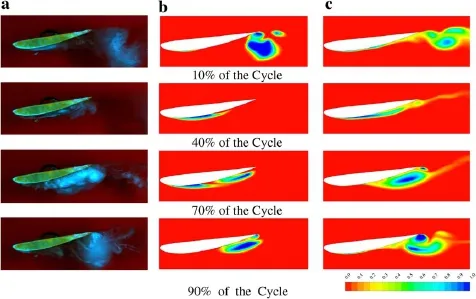
Fig.7 Comparisons of the experimentally observed cavity shapes[33]with those numerically predicted using different models.a Experimental cavitation patterns.b Zwart’s model.c LVC model

wherecisthechordlengthandU∞isthefreestreamvelocity. The y-axis is a dimensionless position at the hydrofoil suction side.L/Lref=0 corresponds to the leading edge,andL/Lref=1.0 corresponds to the trailing edge.In the figure one may fin that the predicted cavity volume distributions along the hydrofoil suction side are significantl different. The maximum length of cavities predicted by Zwart’s model isnearly1.2ofthehydrofoil chord,whiletheattached cavity predictedbytheLVCmodelcandevelopfartherthanalength of0.5chordlengthsdownstreamfromthetrailingedge.From the figures one can also fin that the two predicted cavity evolutions exhibit different periods.
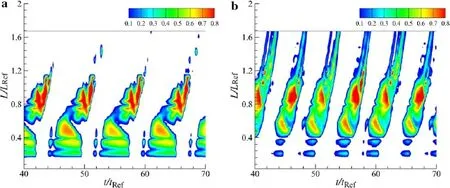
Fig.8 Time evolution of the water vapour fraction in various sections predicted with Zwart’s and the LVC model.a Zwart’s model.b LVC model
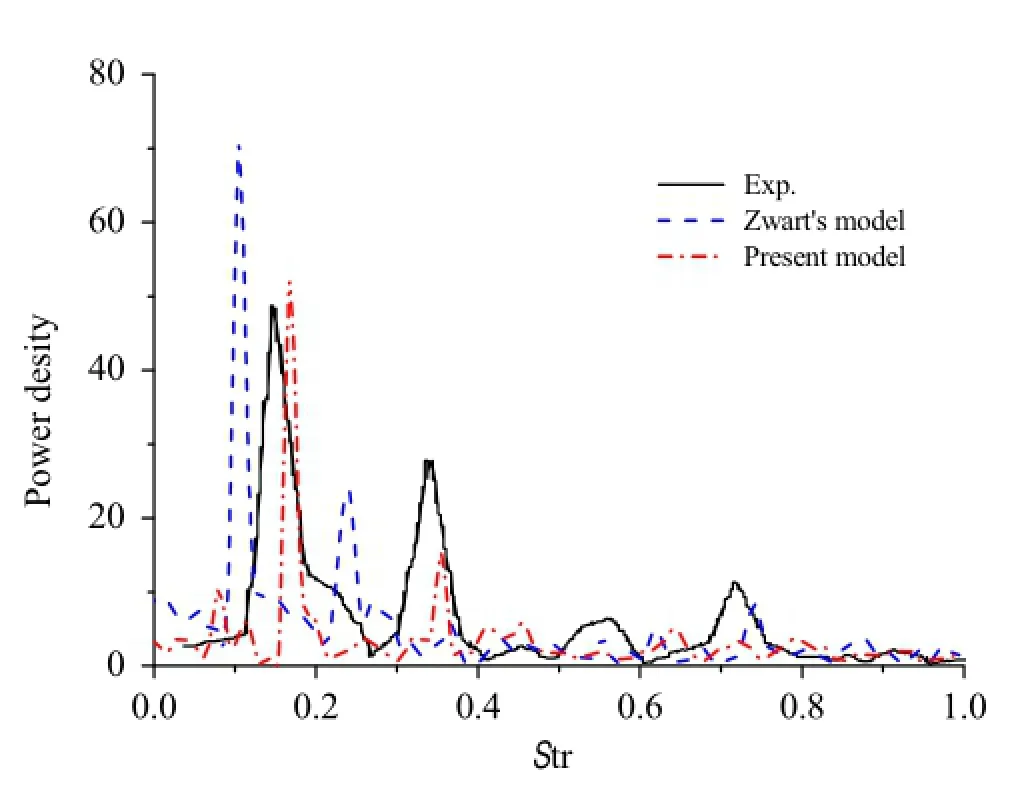
Fig.9 Powerspectraldensitiesofliftcoefficien fluctuation predicted with the two models
Qin’s[12]and Huang’s[35]studies indicated that sheet/-cloud cavitation produces unsteady lift for most hydrofoils. Thus,one can use a lift analysis to compare better the unsteadiness of cloud cavitation.Figure 9 shows a spectral analysis of the transient lift coefficient predicted by the two models.The frequency is normalised by the chord length c and the upstream velocity U∞:Str=f c/U∞.The figur demonstrates that Zwart’s model predicts that the primary load frequency with the highest energy amplitude is approximately Str=0.12,whereas that of the LVC model is approximately Str=0.18,which better agrees with the experimental measurement,Str=0.17[34].
Overall,compared to Zwart’s model,one can fin better agreements between the LVC model’s predictions and the experimental results,including the external shape and global structure of both the attached and detached cavity as well as the frequency of the cloud cavity shedding process.
5 Interrelations between vortex and cavitation
The following discussion focuses on the interrelations between cavitation and vortex to obtain an insight into the present vortex-cavitation model.Figure 10 shows the instantaneous contours of vorticity and liquid-vapour transform rates.The contours denote 10%,40%,70%,and 90% of each corresponding cycle.Source terms with a positive symbol represent the evaporation process and those with a negative symbol represent the condensation process.
As the attached cavity grows towards the trailing edge (loosely define from 10%to 40%of the cycle),vorticity(“+”)production is enhanced by the favourable pressure gradientneartheleadingedge.Meanwhile,neartherearsection, vorticity(“+”)accumulates locally due to the slowdown of the downstream convection process caused by the presence of an adverse pressure gradient.For both Zwart’s model and theLVCmodel’spredictions,theevaporationprocesslargely concentratesinthecoreregionoftheenhancedvorticity(“+”)in good accordance with the attached cavity near the leading edge.However,the situation is different near the trailing edge,where cavity detachment occurs.As shown in the fig uresat10%ofthecycle,theevaporationprocesscanonlybe observedinthepredictionsofZwart’smodel.Thismeansthat theLVCmodel’spredicteddetachedcavitywilldetachfaster thanwillthecavityinZwart’smodel.Thisisthemainreasonfor the shorter period of the LVC model’s predicted cavity evolution compared to Zwart’s model.In addition,for the LVC model’s predictions,the condensation area fully transports to the wake region approximately 0.5 chord lengths downstream away from the trailing edge.This is the main reason for the cavity length predicted by the LVC model, which is longer than that predicted by Zwart’s model,and shows the influenc from the vortex structures in the wake on the cavitation process.

Fig.10 Instantaneous vorticity and liquid-vapour transform rate contours predicted with the two models.a Vorticity.b Source terms
As the re-entrant jet forms and moves upstream(loosely defineas 40%-70%of the cycle),the vorticity(“+”)accumulation process is eventually interrupted by a sudden emergence of unsteady flw separation at the trailing edge. Meanwhile,strong vorticity(“−”)production is enhanced by the favourable pressure gradient at the trailing edge.Near the leading edge,a difference in the evaporation process can be observed between the two models.As shown in the fig ures at 70%of the cycle,a strong evaporation process can be observed in Zwart’s model.However,little evaporation occurs in the LVC model,which may better match the stable attachedcavity.Nearthetrailingedge,inbothZwart’smodel and the LVC model,the evaporation process largely concentrates in the core region of vorticity(“−”),the production of which is enhanced by the favourable pressure gradient at the trailing edge.This is in accordance with the spread of the rear component of the attached cavity,which is induced by the re-entrant jet moving upstream.
Whentheattachedcavitybreaksup,therearportionsheds downstream in the form of a cloud cavity(loosely define at 70%-90%ofthecycle).Meanwhile,theleadingedgevorticity(“+”)breaks up,and the rear portion converts towards the trailing edge region,eventually coupling with a trailing edge vorticity(“−”).In both Zwart’s model and the LVC model, the evaporation process largely concentrates near the core region of the trailing edge vorticity(“−”).However,for the LVC model’s predictions,the condensation area fully transports to the wake region approximately 0.5 chord lengths downstream away from the trailing edge.This produces the cavity length predicted by the LVC model,which is longer than that predicted by Zwart’s model,and demonstrates the influenc ofthevortexstructuresinthewakeonthecavitation process.
Itisusefultoexaminethevorticitytransportequation[15]to obtain a better understanding of the interrelations.

As expected,the baroclinic term∇ρm×∇p/ρ2mof the vorticity is important along the liquid-vapour interface but is negligible inside the cavity region.Contour plots of the LVC model’s predicted baroclinic torque∇ρm×∇p/ρ2mare also showninFig.11atrepresentativetimeinstances(10%,40%, 70%and 90%of the cycle).The baroclinic torque term is relatedtothecrossproductofthedensityandpressuregradients,∇ρm×∇p.Incloudcavitatingflws,differentdensities and pressures produce density and pressure gradients in the water and vapour phases.One can fin large values of both density and pressure gradients near the liquid-vapour interface.As the cavity moves,the parallelism of density and pressure gradient vectors can be broken due to the movement of the liquid-vapour interface.
When the attached cavity grows,a large absolute value of the baroclinic torque term is observed in the attached cavityclosure region.This is induced by the liquid-vapour interface moving towards the trailing edge with the growth of the attached cavity.In addition,a large absolute value of the baroclinic torque term can also be found near the trailing edge.This is induced by the moving interface of the largescale detached cavity in the last cycle.Then,the attached cavity attains its maximum size and has a smooth interface, whichinducesasmallabsolutevalueofthebaroclinictorque term near the suction surface.As the re-entrant jet moves upstream,the cavity interface near the trailing edge becomes wavy/bubblyduetothepartialdetachedcavity.Thisleadstoa large absolute value of the baroclinic torque term.At the end of the cycle,the stable attached cavity breaks up and moves downstream.Therefore,a large absolute value of the baroclinic torque term can be observed near the suction surface.
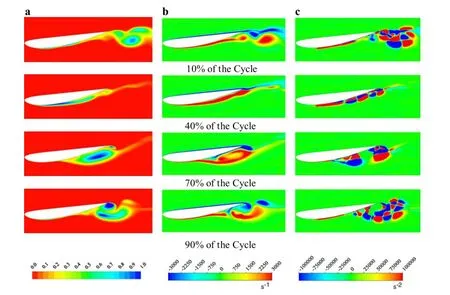
Fig.11 Instantaneous cavity shapes,dilation and baroclinic torque terms predicted by the LVC model.a Cavity shapes.b Vorticity.c Baroclinic term(∇ρm×∇p/ρ2m)
6 Conclusions
In this study,the conception of a cavitating vortex is proposed,based on which a cavitation model considering the relations between cavitation and local vortical effects is developed.Calculations of unsteady cavitating flws around a Clark-Y hydrofoil are performed to assess the predictive ability of the LVC cavitation model using well-documented experimental data.Based on the computations,the interrelations between cavity and local vortical structures are discussed.The following conclusions can be drawn:
(1)The LVC model based on cavitating vortex theory can wellpredicttheunsteadycavitationaroundahydrofoil.Compared with Zwart’s model,better agreements are observed between the LVC model predictions and the experimental measurements,including time-averaged flw structures, instantaneous cavity shapes and the frequency of the shedding process.
(2)The LVC model can better describe the influenc of vorticityonboththeevaporationandcondensationprocesses. Atthebeginningofthecycle,theevaporationprocesslargely concentrates in the core region of the attached cavity based on the growth of the attached cavity.When the re-entrant jet moves upstream,minimal evaporation near the leading edge implies a stable attached cavity,and the evaporation process concentrates in the core region of the trailing edge vorticity corresponding to the spread of the rear portion of the attached cavity.When the attached cavity breaks up and moves downstream,the condensation area fully transports to the wake region,which is in accordance with the dissipation of the detached cavity.
(3)The periodic formation,breakup,shedding,and collapse of the sheet/cloud cavities,as well as the associated baroclinic torque,are shown to be important mechanisms forvorticityproductionandmodification Whentheattached cavitygrows,theliquid-vapourinterfacethatmovestowards the trailing edge enhances the vorticity in the attached cavity closure region.As the re-entrant jet moves upstream,thewavy/bubbly cavity interface enhances the vorticity near the trailing edge.At the end of the cycle,the break-up of the stable attached cavity is the main reason for the vorticity enhancement near the suction surface.
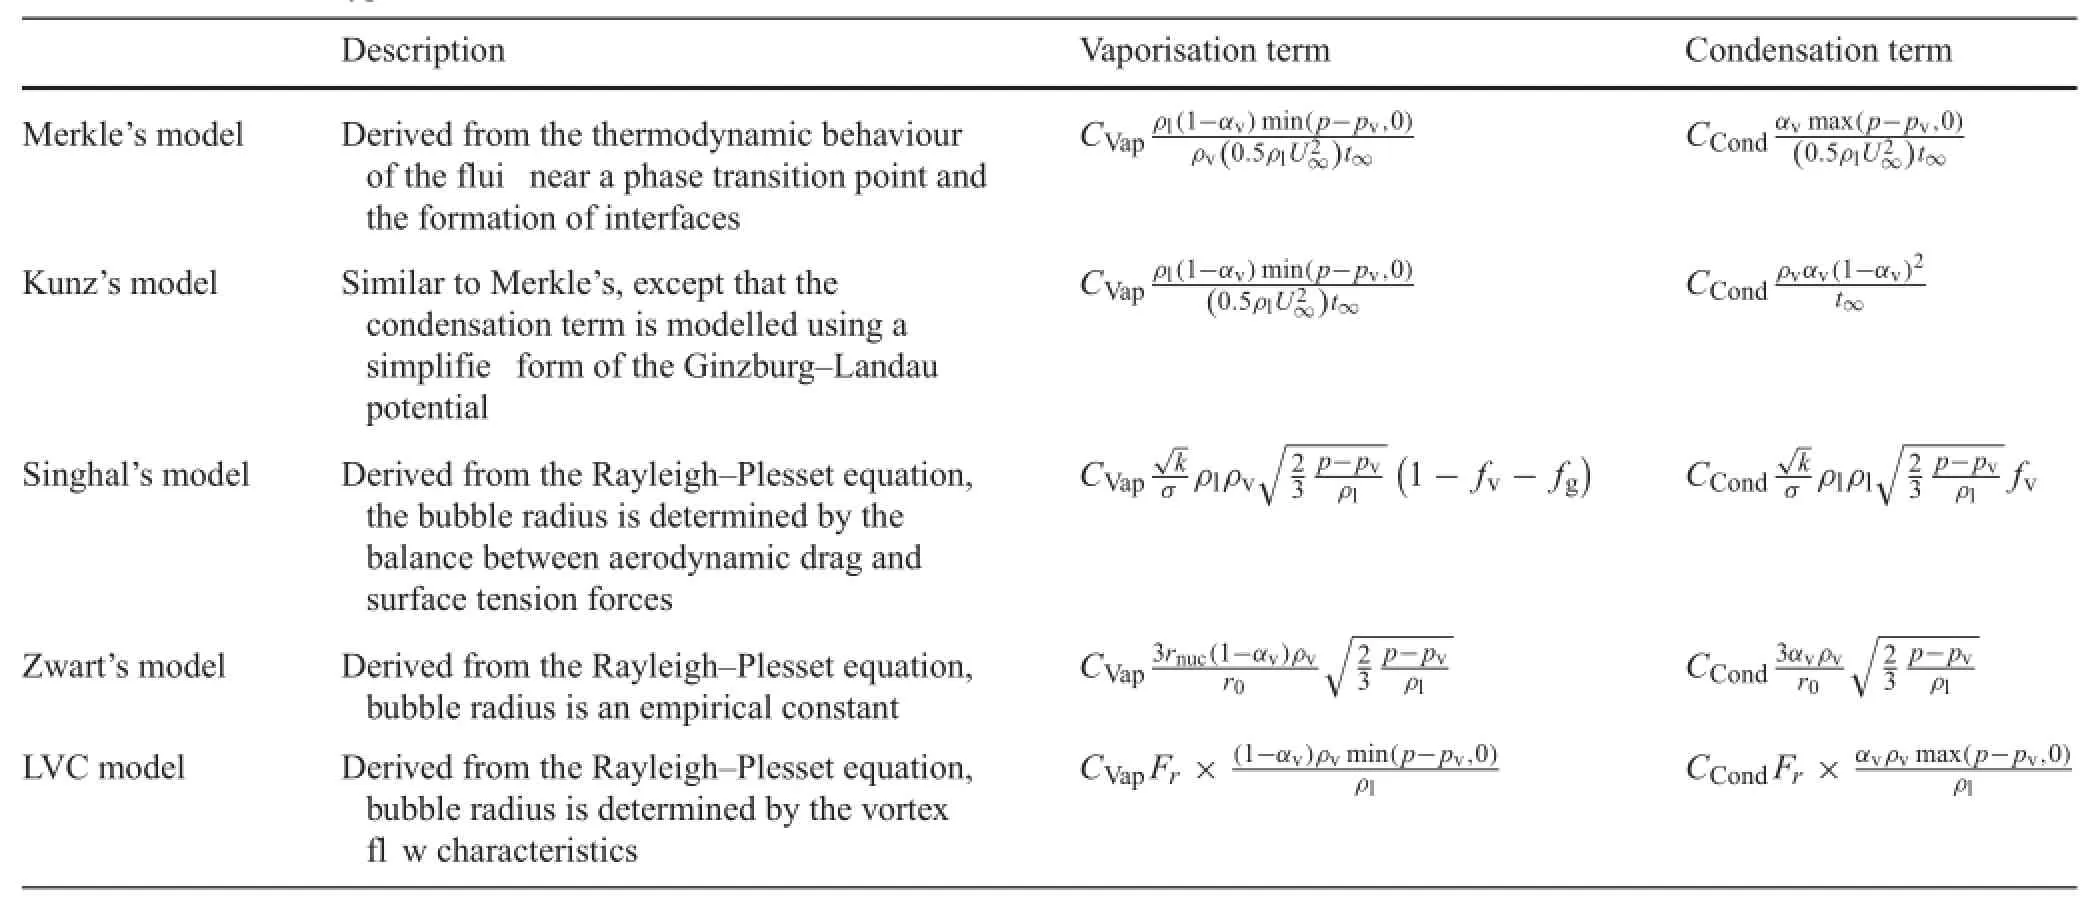
Table 1 Overview of typical TEM cavitation models
Regarding future research,detailed studies are needed to understand further the vortex cavitation model.First,the function Fr,whichrepresentsthelocalvorticaleffects,canbe modelled using various methods.Please note that different formats should be validated for different types of cavitating vortical flws.In addition,a sensitivity analysis of the model’s empirical constants,including the vaporisation and condensation constants and the empirical constant in the rotatingfunction,shouldbeconductedtoobtaininsightsinto the influence on the vortex cavitation predictions.
Further details of typical TEM models are presented in Table 1.In these cavitation models,the volume/mass fraction of the liquid(and vapour)phase is convected.Merkle et al.[19],Kunz et al.[20],Singhal et al.[18],and Zwart et al.[17]developed various models that are based on this concept,but use different source terms.One apparent advantageofthismodelcomesfromtheconvectivecharacterofthe equation,which enables modelling of the effects of inertial forces on cavities,such as elongation,detachment and drift of bubbles.
The source terms in these models are different.As indicated by Table 1,these models can be divided into two categories.Both Singhal’s and Zwart’s models are derived from the Rayleigh-Plesset equations.Thus,the source terms are modelled as being proportional to the square root of the amount by which the pressure is below the vapour pressure: (P−Pv).Similarly,Merkle’s and Kunz’s models are based on an analysis of the thermodynamic behaviour of the flui near a phase transition point and the formation of interfaces. The source terms are thus modelled as being proportional to the pressure above the vapour pressure:(P−Pv).In Kunz’s model,the condensation term is modelled using a simplifie form of the Ginzburg-Landau potential.Moreover,the LVC model is derived from the Rayleigh-Plesset equations;however,the source terms are proportional to the pressure above the vapour pressure:(P−Pv).This may be because of the additional vortex effect factor Frin the LVC model.Specifi cally,thesourcetermsoftheLVCmodelhaveformatsthatare similartoMerkle’sandKunz’smodels,eventhoughtheLVC model is derived from the Rayleigh-Plesset equations and is similar to Singhal’s and Zwart’s models.This implies various inherent relations between the two categories of models, which should attract more attention in future studies.
AcknowledgmentsThe project was supported by the National Natural Science Foundation of China(Grants 11172040,51239005)
References
1.Knapp,R.T.,Daily,J.W.,Hammitt,F.G.:Cavitation.McGraw-Hill, New York(1970)
2.Brennen,C.E.:Cavitation and Bubble Dynamics.Oxford University Press,Oxford(1995)
3.Arndt,R.E.A.:Cavitation in flui machinery and hydraulic structures.Annu.Rev.Fluid Mech.13,273-326(1981)
4.Joseph,D.:Cavitationinaflwingliquid.Phys.Rev.E 51,R1649-R1650(1995)
5.Chen,Y.,Heister,S.D.:A numerical treatment for attached cavitation.J.Fluids Eng.116,613-618(1994)
6.Deshpande,M.,Feng,J.,Merkle,C.L.:Numerical modeling of the thermodynamic effects of cavitation.J.Fluids Eng.119,420 (1997)
7.Liu,L.,Li,J.,Feng,Z.:A numerical method for simulation of attached cavitation flws.Int.J.Numer.Methods Fluids 52,639-658(2006)
8.Goncalves,E.,Patella,R.F.:Numerical simulation of cavitating flws with homogeneous models.Comput.Fluids 38,1682-1696 (2009)
9.Deshpande,M.,Feng,J.,Merkle,C.L.:Cavity flw predictions based on the Euler equations.J.Fluids Eng.116,36(1994)
10.Ventikos,Y.,Tzabiras,G.:A numerical method for the simulation of steady and unsteady cavitating flws.Comput.Fluids 29,63-88 (2000)
11.Edwards,J.R.,Franklin,R.K.,Liou,M.-S.:Low-diffusion flux splitting methods for real flui flws with phase transitions.AIAA J.38,1624-1633(2000)
12.Qin,Q.,Song,C.C.S.,Arndt,R.E.A.:A Numerical Study of the Unsteady Turbulent Wake Behind a Cavitating Hydrofoil.Division of Fluid Dynamics 56th Annual Meeting.American Physical Society,East Rutherford(2003)
13.Huang,D.,Zhuang,Y.,Cai,R.:A computational method for cavitationalflwsbasedonenergyconservation.Proc.Inst.Mech.Eng. Part C J.Mech.Eng.Sci.221,1333-1338(2007)
14.Barre,S.,Rolland,J.,Boitel,G.,et al.:Experiments and modeling of cavitating flws in venturi:attached sheet cavitation.Eur.J. Mech.—B/Fluids 28,444-464(2009)
15.Gopalan,S.,Katz,J.:Flow structure and modeling issues in the closure region of attached cavitation.Phys.Fluids 12,895-911 (2000)
16.Kubota,A.,Kato,H.,Yamaguchi,H.:A new modelling of cavitating flws:a numerical study of unsteady cavitation on a hydrofoil section.J.Fluid Mech.240,59-96(1992)
17.Zwart,P.,Gerber,A.,Belamri,T.:A Two-Phase Flow Model for PredictingCavitationDynamics.FifthInternationalConferenceon Multiphase Flow,Yokohama(2004)
18.Singhal,A.K.,Athavale,M.M.,Li,H.,et al.:Mathematical basis andvalidationofthefullcavitationmodel.J.FluidsEng.124,617-624(2002)
19.Merkle,C.L.,Feng,J.,Buelow,P.E.:Computational Modeling of theDynamicsofSheetCavitation.In:Proceedingsofthe3rdInternational Symposium on Cavitation,Grenoble(1998)
20.Kunz,R.F.,Boger,D.A.,Stinebring,D.R.,et al.:A preconditioned Navier-Stokesmethodfortwo-phaseflwswithapplicationtocavitation prediction.Comput.Fluids 29,849-875(2000)
21.Senocak,I.,Shyy,W.:Interfacial dynamics-based modelling of turbulent cavitating flws,Part-1:Model development and steadystate computations.Int.J.Numer.Methods Fluids 44,975-995 (2004)
22.Senocak,I.,Shyy,W.:Interfacial dynamics-based modelling of turbulent cavitating flws,Part-2:Time-dependent computations. Int.J.Numer.Methods Fluids 44,997-1016(2004)
23.Kubota,A.,Kato,H.,Yamaguchi,H.,et al.:Unsteady structure measurementofcloudcavitationonafoilsectionusingconditional sampling technique.J.Fluids Eng.111,204-210(1989)
24.Arndt,R.E.A.:Cavitationinvorticalflws.Annu.Rev.FluidMech. 34,143-175(2002)
25.Iyer,C.O.,Ceccio,S.L.:The influenc of developed cavitation on the flw of a turbulent shear layer.Phys.Fluids 14,3414(2002)
26.Laberteaux,K.R.,Ceccio,S.L.,Mastrocola,V.J.,etal.:Highspeed digital imaging of cavitating vortices.Exp.Fluids 24,489-498 (1998)
27.Huang,B.,Young,Y.L.,Wang,G.,et al.:Combined experimental and computational investigation of unsteady structure of sheet/cloud cavitation.J.Fluids Eng.135,071301(2013)
28.Launder,B.E.,Spalding,D.B.:The numerical computation of turbulent flws.Comput.Methods Appl.Mech.Eng.3,269-289 (1974)
29.Tseng,C.-C.,Wei,Y.,Wang,G.,et al.:Modeling of turbulent, isothermal and cryogenic cavitation under attached conditions. Acta Mech.Sin.26,325-353(2010)
30.Utturkar,Y.,Wu,J.,Wang,G.,et al.:Recent progress in modeling of cryogenic cavitation for liquid rocket propulsion.Prog.Aerosp. Sci.41,558-608(2005)
31.Wu,J.,Wang,G.,Shyy,W.:Time-dependent turbulent cavitating flw computations with interfacial transport and filte-based models.Int.J.Numer.Methods Fluids 49,739-761(2005)
32.Johansen,S.T.,Wu,J.,Shyy,W.:Filter-basedunsteadyRANScomputations.Int.J.Heat Fluid Flow 25,10-21(2004)
33.Huang,B.:Physical and numerical investigation of unsteady cavitating flws.Sci.China Technol.Sci.56,2207-2218(2013)
34.Wang,G.,Senocak,I.,Shyy,et al.:Dynamics of attached turbulent cavitating flws.Prog.Aerosp.Sci.37,551-581(2001)
35.Huang,B.,Zhao,Y.,Wang,G.:LargeEddySimulationofturbulent vortex-cavitation interactions in transient sheet/cloud cavitating flws.Comput.Fluids 92,113-124(2014)
23 January 2015/Revised:26 March 2015/Accepted:8 April 2015/Published online:14 August 2015
✉Guoyu Wang
wangguoyu@bit.edu.cn
1School of Mechanical Engineering,Beijing Institute of Technology,Beijing 100081,China
杂志排行
Acta Mechanica Sinica的其它文章
- Correcting the initialization of models with fractional derivatives via history-dependent conditions
- Tomographic PIV investigation on coherent vortex structures over shark-skin-inspired drag-reducing riblets
- Analysis of the geometrical dependence of auxetic behavior in reentrant structures by finit elements
- The equilibrium stability for a smooth and discontinuous oscillator with dry friction
- Impact toughness of a gradient hardened layer of Cr5Mo1V steel treated by laser shock peening
- Why a mosquito leg possesses superior load-bearing capacity on water:Experimentals
