Research on Molecular Spectra of Interactions Between Salvianolic Acid A and Salvianolic Acid B with Insulin, and Effect of Glucose on the Binding
2016-07-12YANGWenyueCUILinQULinglingXUNingHUANGYunCUILijianZHANWenhongZHAODing
YANG Wen-yue, CUI Lin, QU Ling-ling, XU Ning, HUANG Yun,2*,CUI Li-jian, ZHAN Wen-hong, ZHAO Ding
1.Pharmaceutical College, Hebei Medical University, Shijiazhuang 050017, China 2.Institute of Chinese Integrative Medicine, Hebei Medical University, Shijiazhuang 050017, China 3.Experimental Center, Hebei University of Chinese Medicine, Shijiazhuang 050091, China
Research on Molecular Spectra of Interactions Between Salvianolic Acid A and Salvianolic Acid B with Insulin, and Effect of Glucose on the Binding
YANG Wen-yue1, CUI Lin1, QU Ling-ling1, XU Ning1, HUANG Yun1,2*,CUI Li-jian3*, ZHAN Wen-hong1, ZHAO Ding1
1.Pharmaceutical College, Hebei Medical University, Shijiazhuang 050017, China 2.Institute of Chinese Integrative Medicine, Hebei Medical University, Shijiazhuang 050017, China 3.Experimental Center, Hebei University of Chinese Medicine, Shijiazhuang 050091, China
The interactions of Salvianolic acid A (SAA) and Salvianolic acid B (SAB) with insulin were studied by using fluorescence spectroscopy, UV-vis spectroscopy and ATR-FTIR spectroscopy in simulating physiological condition (pH 7.40).The fluorescence quenching of insulin by SAA and SAB were static quenching process.The results of synchronous fluorescence and three-dimensional fluorescence spectra suggested no obvious conformation changes of insulin after SAA or SAB binding.But ATR-FTIR spectra showed that SAA and SAB could change the secondary structures of insulin, of which β-turns decreased and random coil increased accompanied with α-helices and β-sheets no clear change.The glucose might influenced the the bioactivity of insulin in the SAA-insulin and SAB-insulin systems by changing the binding constants of SAA (or SAB) with insulin and exacerbating the changes of insulin conformation and relative contents of α-helices.
Salvianolic acid A;Salvianolic acid B;Insulin;Glucose;Spectroscopy
Introduction
Danshen injection is a kind of traditional Chinese medicine (TCM) injections often used in clinical for the treatment of diabete complications including peripheral neuropathy and microangiopathy[1-2].Some researchs show that water-soluble phenolic acids compounds could prevent diabetic nephropathy, due to improving abnormal blood rheology of diabetes mellitus patients[3-4].Salvianolic acid A (SAA) which was demonstrated to have the function of cardiovascular protection and Salvianolic acid B (SAB) which was used in clinical practice for the treatments of myocardial infarction and coronary heart disease (Fig.1) are important water-soluble phenolic acid compounds[5-9]in DANSHEN injection.
Diabetes mellitus is a serious pathological disease especially with various acute or chronic complications such as diabetic nephropathy, diabetic cardiopathy, and diabetic encephalopathy, which usually need intravenous therapy.But lots of normal saline (NS) infusion is liable to cause water-sodium retention and homeostasis disturbances when drugs are given via a peripheral venous access.In clinical, these patients are given drugs and insulin dispensed in 5% glucose injection through intravenous drip instead of NS[10].
Insulin plays important roles in blood glucose, influences lipid metabolism, protein degradation, synthesis, and growth, which is a polypeptide hormones secreted by pancreatic β cell.It is composed of A peptide chain (21 amino acids) and B peptide chain (30 amino acids).The A peptide chain contains one random coil and two α-helices, the B peptide chain containing one α-helices and two β-turns.The complex biological function of insulin molecular is implemented through combining with its receptor.It showed that there is a hydrophobic region in insulin as the active site binding to receptor[11-12].The classical binding sites are situated in α-helices region, and in β-sheets region.The active binding sites and biological function of insulin might be affected if the contents of α-helices and β-sheets altered.


Fig.1 Structures of compounds
The technique of attenuated total reflectance (ATR) has revolutionized solid and liquid sample analyses[13], which has been implemented in biological studies in order to probe chemical reactions/structure at the solid/liquid interface.There are some vibration bands of protein and polypeptide in the IR region, only the amide I band proved to be significant information for the detailed characterization of protein secondary structure[14], such as α-helices, β-sheets, β-turns and random coil.The width of the contributing component bands is usually greater than the separation between the maximum of adjacent peaks.As a consequence, the individual component bands cannot be resolved in the experimental spectra.The Fourier deconvolution procedure, referred to as resolution enhancement involves narrowing the widths of infrared bands, allowing increased separation of the overlapping components present within the broad band envelope.The secondary structure content was calculated from the areas of the individual assigned bands.
Synchronous fluorescence spectrum can simplify the spectrum, narrow band and reduce the spectral overlap.The change of the position of synchronous fluorescence reflects the change of surrounding microenvironment polarity of amino acid residues[15].Insulin molecule has 4 tyrosine residues, 3 of which are in the hydrophobic binding site.We determined the synchronous fluorescence spectra of insulin when Δλ=15 (Tyr residues).The conformation change of insulin can be speculated based on the peak shift.
Thus, we explore whether the interactions between SAA or SAB and insulin occurred and the influence of glucose on them, and investigate the binding mechanism, the binding constant, the change of insulin secondary structure and the effect of glucose on the binding.The plasma free concentration of drug would be reduced if SAA or SAB combined with insulin.If the combination influences the α-helices and β-sheets in the secondary structure of insulin, the biological activity of insulin will may be further affected.The results may provide an important theoretical support for the use of DANSHEN injection in the treatment of diabetes and its complications.
1 Materials and methods
1.1 Materials and apparatus
Insulin was purchased from Sigma (New York, USA) and Tris (99.0%) was from Shanghai Chemistry Reagent Company (Shanghai, China), Salvianolic acid A and Salvianolic acid B from National Institutes for Food and Drug Control (Beijing, China).All other chemicals were of analytical reagent grade.Double distilled water was used throughout the experiment.
The fluorescence spectra were recorded on F-380 spectrofluorimeter (Gangdong, China).The absorption spectra were measured on TU-1901 spectrophotometer (Purkinje General, China).In addition, the ATR-FTIR spectra were measured on FTIR-8400S spectrometer (Shimadzu, Japan) with ATR accessory (PIKE, USA).Titrations were done manually by using trace syringes.
1.2 Procedures
Appropriate amounts of insulin were dissolved in Tris-HCl buffer solution (0.05 mol·L-1, pH 7.40, containing 0.10 mol·L-1NaCl) to prepare the stock solution (5×10⁻⁴mol·L-1), which was diluted to lower concentration (5×10⁻⁶mol·L-1) for actual use.SAA and SAB solutions (1×10⁻³mol·L-1) were prepared in double distilled water.
2 mL insulin (5×10⁻⁶mol·L-1) was titrated with 0, 8, 16, 24, 32, 40, 48, 56 μL SAA or SAB (1×10⁻³mol·L-1).Titrations were done by using a micro-injector.The final concentrations of SAA or SAB varied from 0 to 28×10-6mol·L-1at an increment of 4×10⁻⁶mol·L-1.Another solution of insulin with the SAA (or SAB) in the presence of 5% glucose was prepared similarly.
Fluorescence spectra were recorded at 298 and 310 K in the range from 285~350 nm at excitation wavelength 280 nm.The widths of excitation and emission slits were both set at 2.5 nm.The synchronous fluorescence spectra were recorded when Δλ=15 over the wavelength range of 280~350 nm.The three-dimensional fluorescence spectra were performed under the following conditions: emission wavelength from 250 to 350 nm, excitation wavelength from 240 to 300 nm with an increment of 2 nm.
The UV absorption spectra of SAA (SAB, insulin, SAA-insulin or SAB-insulin) were recorded in the range of 200~350 nm.
All FTIR spectra were taken via the ATR method with the resolution of 4 cm-1and 60 scans.The sample compartment was purged with dry air to eliminate the absorption of water vapour.The spectra of the buffer solution and insulin solution were firstly collected and then the spectrum of buffer was subtracted from that of insulin to obtain the pure insulin subtractive spectrum.The spectra of drug solution were subtracted from that of drug-insulin to obtain the insulin (after the drug was added) subtractive spectra.
The subtractive spectra were performed two point baseline correction within the scope of 1 700~1 600 cm-1(amide Ⅰ band) and smoothed with a five-point Savitsky-Golay to remove the noise.The second derivative and Fourier deconvolution were applied to estimate the position of peaks and half-peak width.The spectra were fitted by the Gauss curve fitting, and the secondary structure contents of insulin were calculated from the areas of the individual assigned bands and their fraction of the total area in the amide Ⅰ region.
The experimental date were analyzed and graphed by origin 9.0.The result data of ATR-FTIR curve-fitting differential spectra were expressed as mean±SD, and statistical analysis was performed with SPSS 13.0.Normality test and independent sample T test were used to compare the difference between the second structure of insulin with that after binding with SAA (SAB) or SAA-glucose (SAB-glucose).P values less than 0.05 were considered statistically significant.
2 Results and discussion
2.1 Effect of SAA and SAB on fluorescence spectra of insulin
The fluorescence quenching spectra of insulin with different concentrations of SAA or SAB were shown in Fig.2.Insulin had a strong fluorescence emission peak at 308 nm and the fluorescence emission intensity of insulin decreased regularly with the increasing concentration of SAA or SAB, indicating SAA and SAB interacted with insulin and quenched its intrinsic fluorescence.
2.2 The fluorescence quenching mechanism
The different fluorescence quenching mechanisms are usually classified as either dynamic or static quenching.It is necessary to know quenching types for studying the mechanism of quenching.We use the quenching constants dependence on the temperature to elucidate the quenching mechanism.TheKSVvalue decreases with temperature increasing for static quenching, and the reverse results would be observed for dynamic quenching[16].
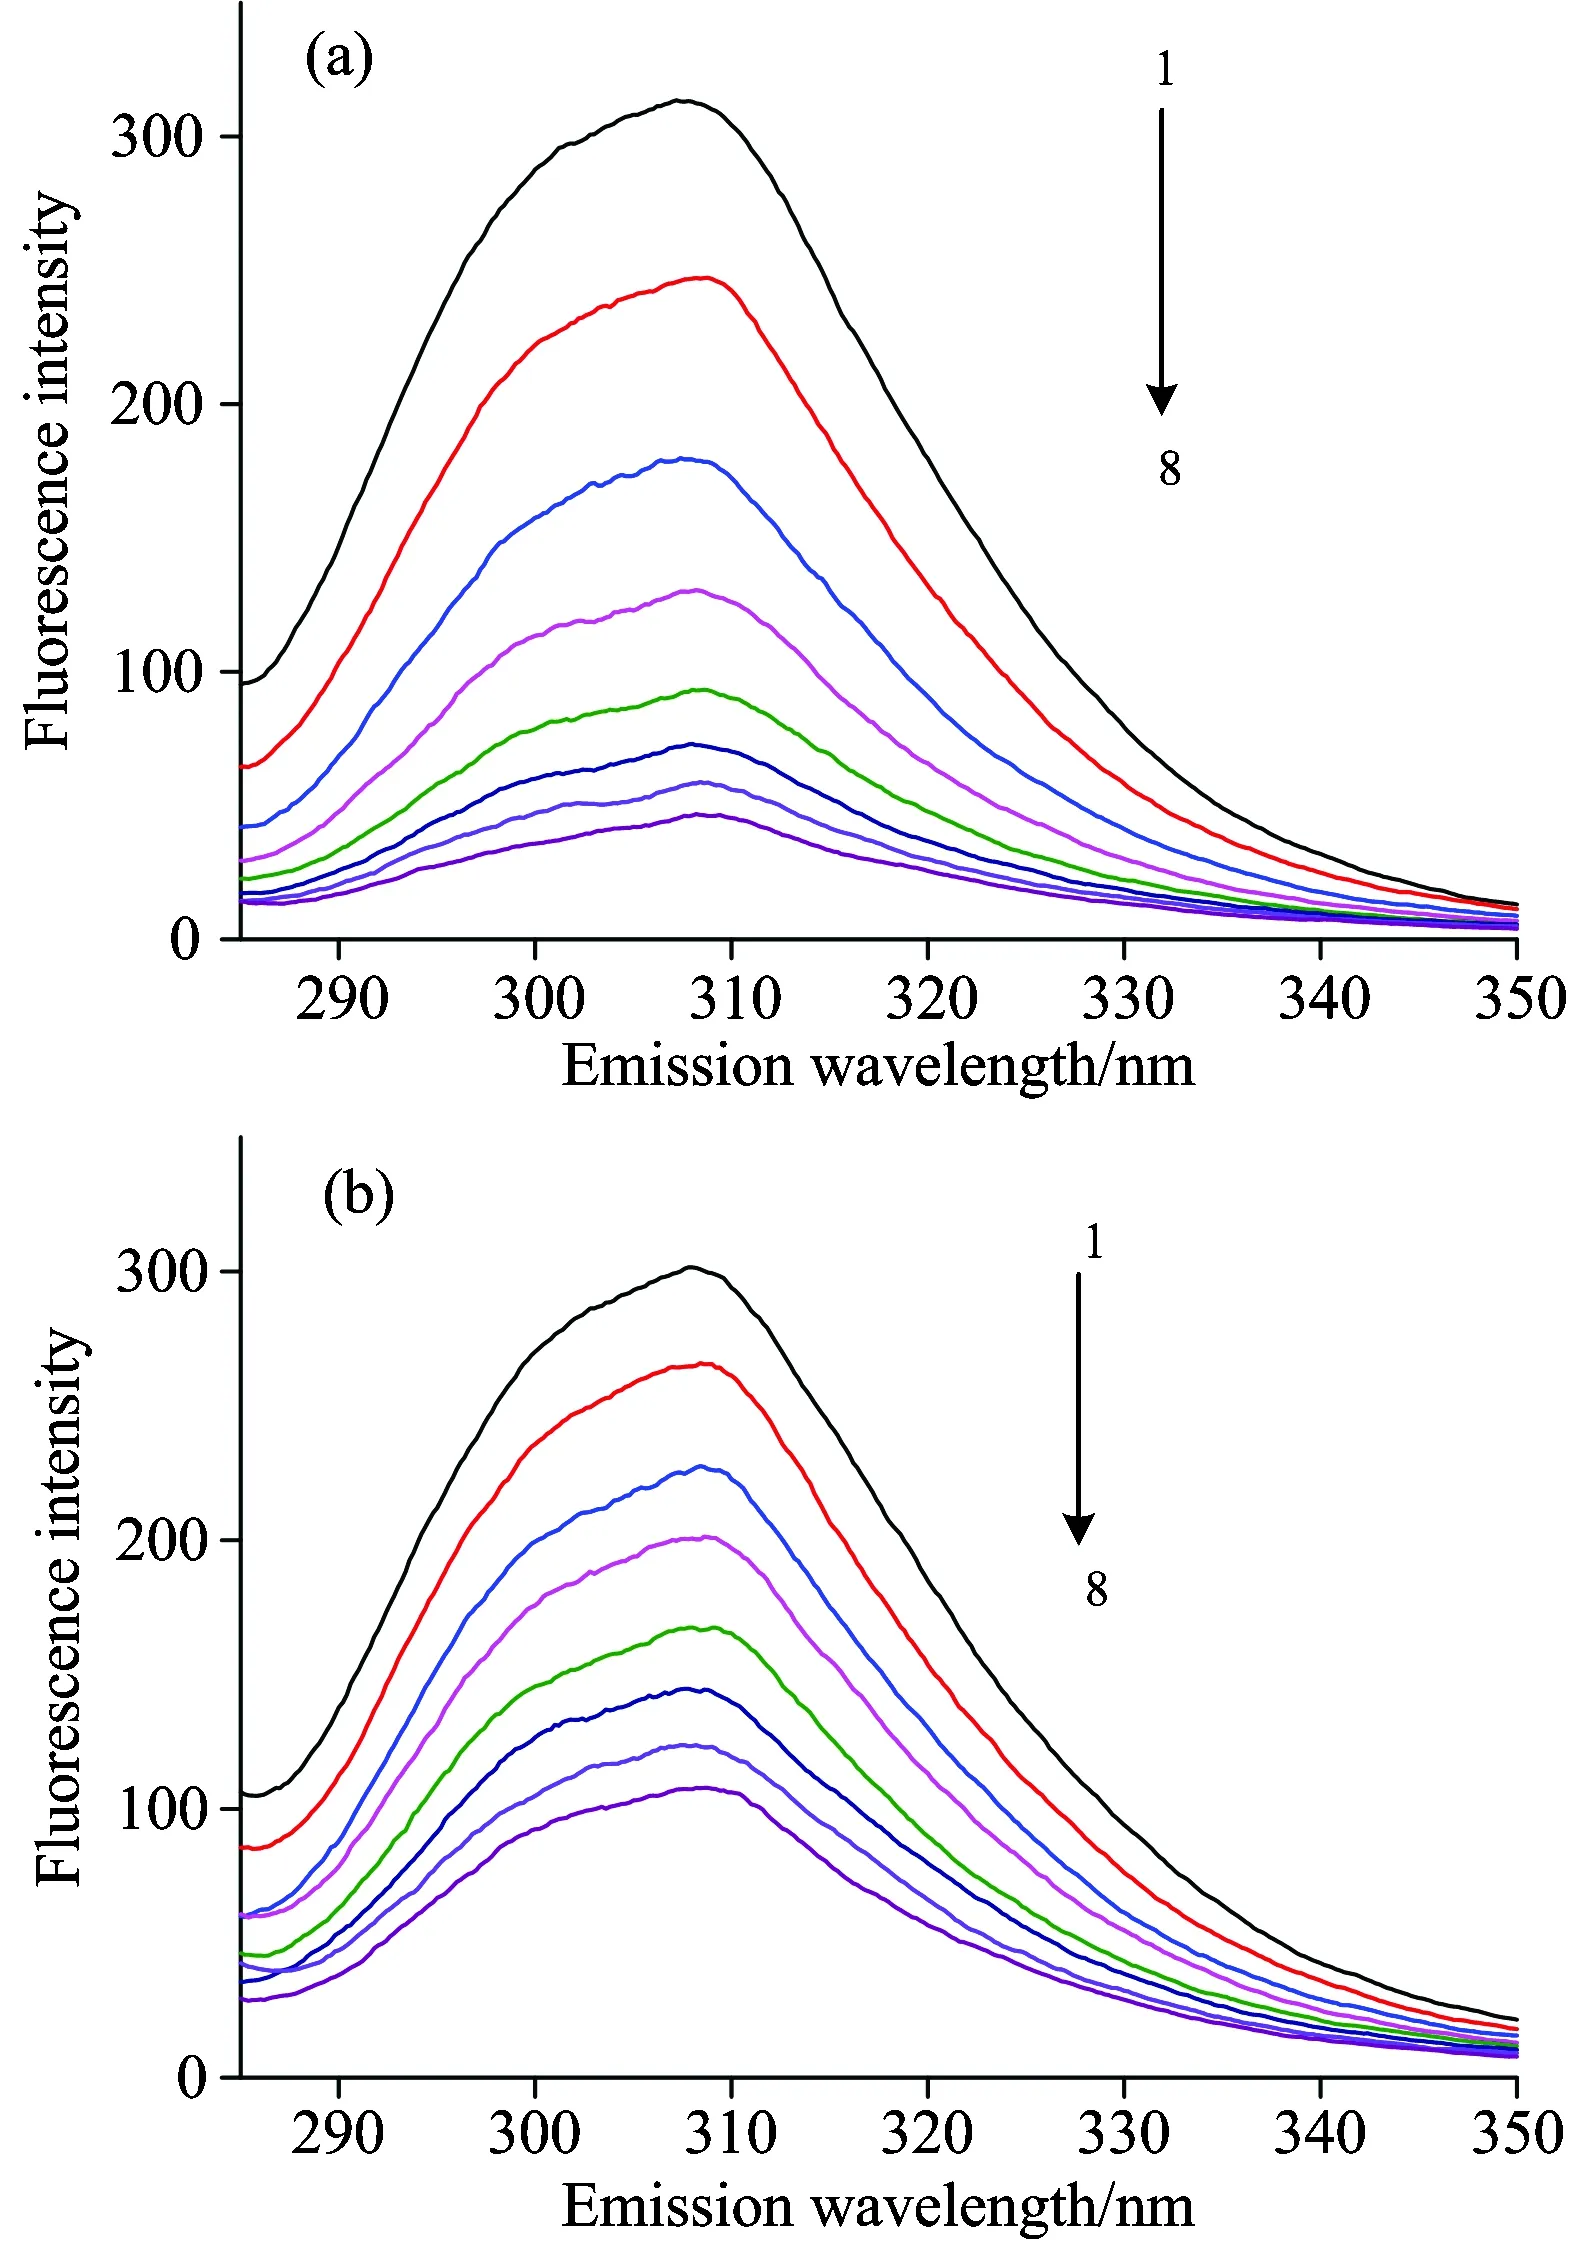
Fig.2 Fluorescence quenching spectra of (a) SAA-insulin and (b) SAB-insulin (T=298 K)
From curve 1→8,cInsulin=5×10⁻⁶mol·L-1,cSAA=cSAB=0, 4, 8, 12, 16, 20, 24 and 28×10-6mol·L-1, respectively
In order to study the quenching mechanism, the procedure is assumed to be dynamic quenching.The Stern-Volmer equation is described by
F0/F=1+Kqτ0[Q]=1+KSV[Q]
(1)
whereF0andFare the fluorescence intensities of biomolecule before and after the quencher added.Kqis the biomolecule quenching constant,τ0is average lifetime of the bio-molecular without quencher, [Q] is the concentration of quencher, andKSVis the dynamic quenching constant.
Fig.3 showed the Stern-Volmer plots of the fluorescence quenching of insulin at different temperatures.TheKSVat different temperatures were shown in Table 1, suggesting the quenching mechanisms of SAA-insulin and SAB-insulin were static quenching since the quenching constants decrease with the rising temperature, which refers to the formation of fluorophore-quencher complex[17].
UV absorption measurement is a simple but effective method which is often used to confirm the probable quenching mechanism between small molecules and proteins.The absorption spectra of insulin in the absence and presence of SAA or SAB were recorded by subtracting the corresponding spectra of SAA or SAB free form in the buffer from that of SAA (SAB)-insulin system.
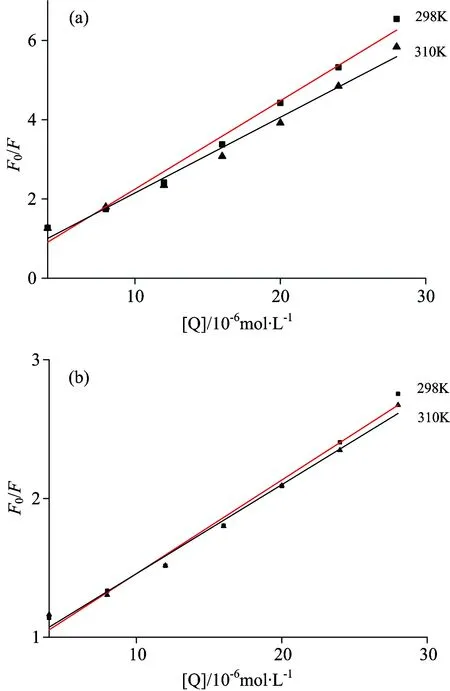
Fig.3 Stern-Volmer plots of (a) SAA-insulin and (b) SAB-insulin at different temperatures
Table 1 Binding parameters of SAA (SAB)- insulin at different temperatures
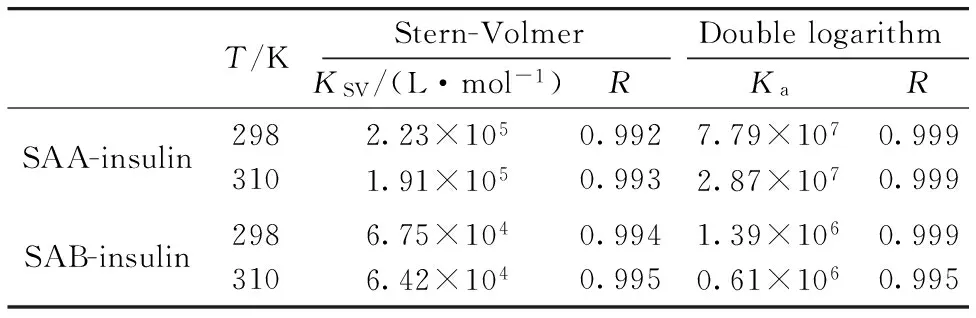
T/KStern-VolmerDoublelogarithmKSV/(L·mol-1)RKaRSAA-insulin2983102.23×1051.91×1050.9920.9937.79×1072.87×1070.9990.999SAB-insulin2983106.75×1046.42×1040.9940.9951.39×1060.61×1060.9990.995
It was obvious that the spectra of insulin-SAA and insulin-SAB (Fig.4) were different from the differential spectrum, suggesting the quenching mechanism of insulin by SAA or SAB were static quenching procedure, because for static quenching, the ground-state of fluorophore can form the complexes with quencher that causes the absorption spectra of fluorophore changed[18].The above results were in agreement with the conclusions of fluorescence spectra.
2.3 Binding constant
The binding constant can be obtained by the following equation
lg[(F0-F)/F]=lgKa+nlg[Q]
(2)
whereKais the binding constant.

Fig.4 The absorption spectra of insulin
Table 1 showed the values ofKa, which were 7.79×10⁷(SAA) and 1.39×10⁶(SAB).Ka(SAA)>Ka(SAB) at the same temperature, indicating the steric hindrance gave SAB a disadvantage to binding with insulin.The results demonstrated that the abilities of binding to insulin were related to the structures of the drugs.
2.4 Binding forces
Thermodynamic parameters for a binding interaction can be used as a main evidence to learn the nature of intermolecular forces between small molecule and biomacromolecule.According to thermodynamic equations
ln(K2/K1)=(1/T1-1/T2)ΔH/R
(3)
ΔG=ΔH-TΔS
(4)
ΔG=-RTlnK
(5)
AccordingtothevaluesofΔHand ΔSin the process, the interaction mode can be determined as follows: ΔH>0 and ΔS>0 imply a hydrophobic interaction; ΔH<0 and ΔS<0 suggest the Vander Waals force and hydrogen bond; ΔH<0 and ΔS>0 reflect an electrostatic force[19].
The thermodynamic parameters were shown in Table 2.The negative ΔHand ΔSindicated that the Vander Waals force and hydrogen bond played major roles in stabilizing the SAA-insulin and SAB-insulin complexes.The negative value of ΔGwas taken as the evidence for the spontaneity of the binding of SAA and SAB with insulin.
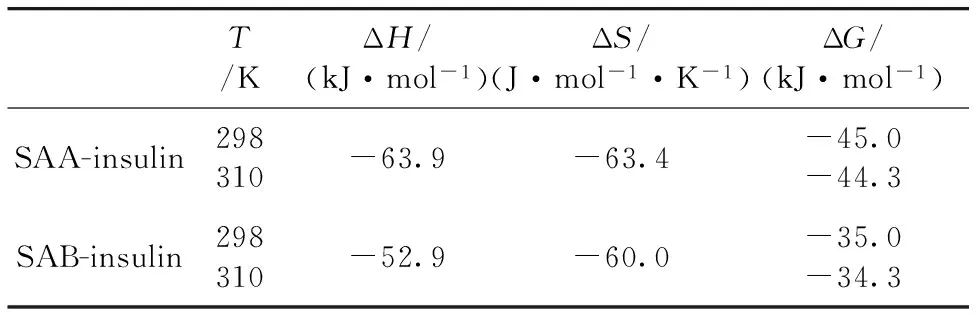
Table 2 Thermodynamic parameters of interaction between SAA (SAB) and insulin
2.5 Conformation investigation
2.5.1 Synchronous fluorescence spectra
The synchronous fluorescence spectra present the information about the molecular microenvironment in the vicinity of the fluorophore functional groups[20].
The synchronous fluorescence spectra were measured when the Δλ=15 nm and shown in Fig.5.The emission maximum of tyrosine of insulin of the SAA-insulin system or SAB-insulin system has hardly any shift.It was demonstrated that the microenvironment and conformation of tyrosine of insulin had no obvious change after SAA or SAB was added.
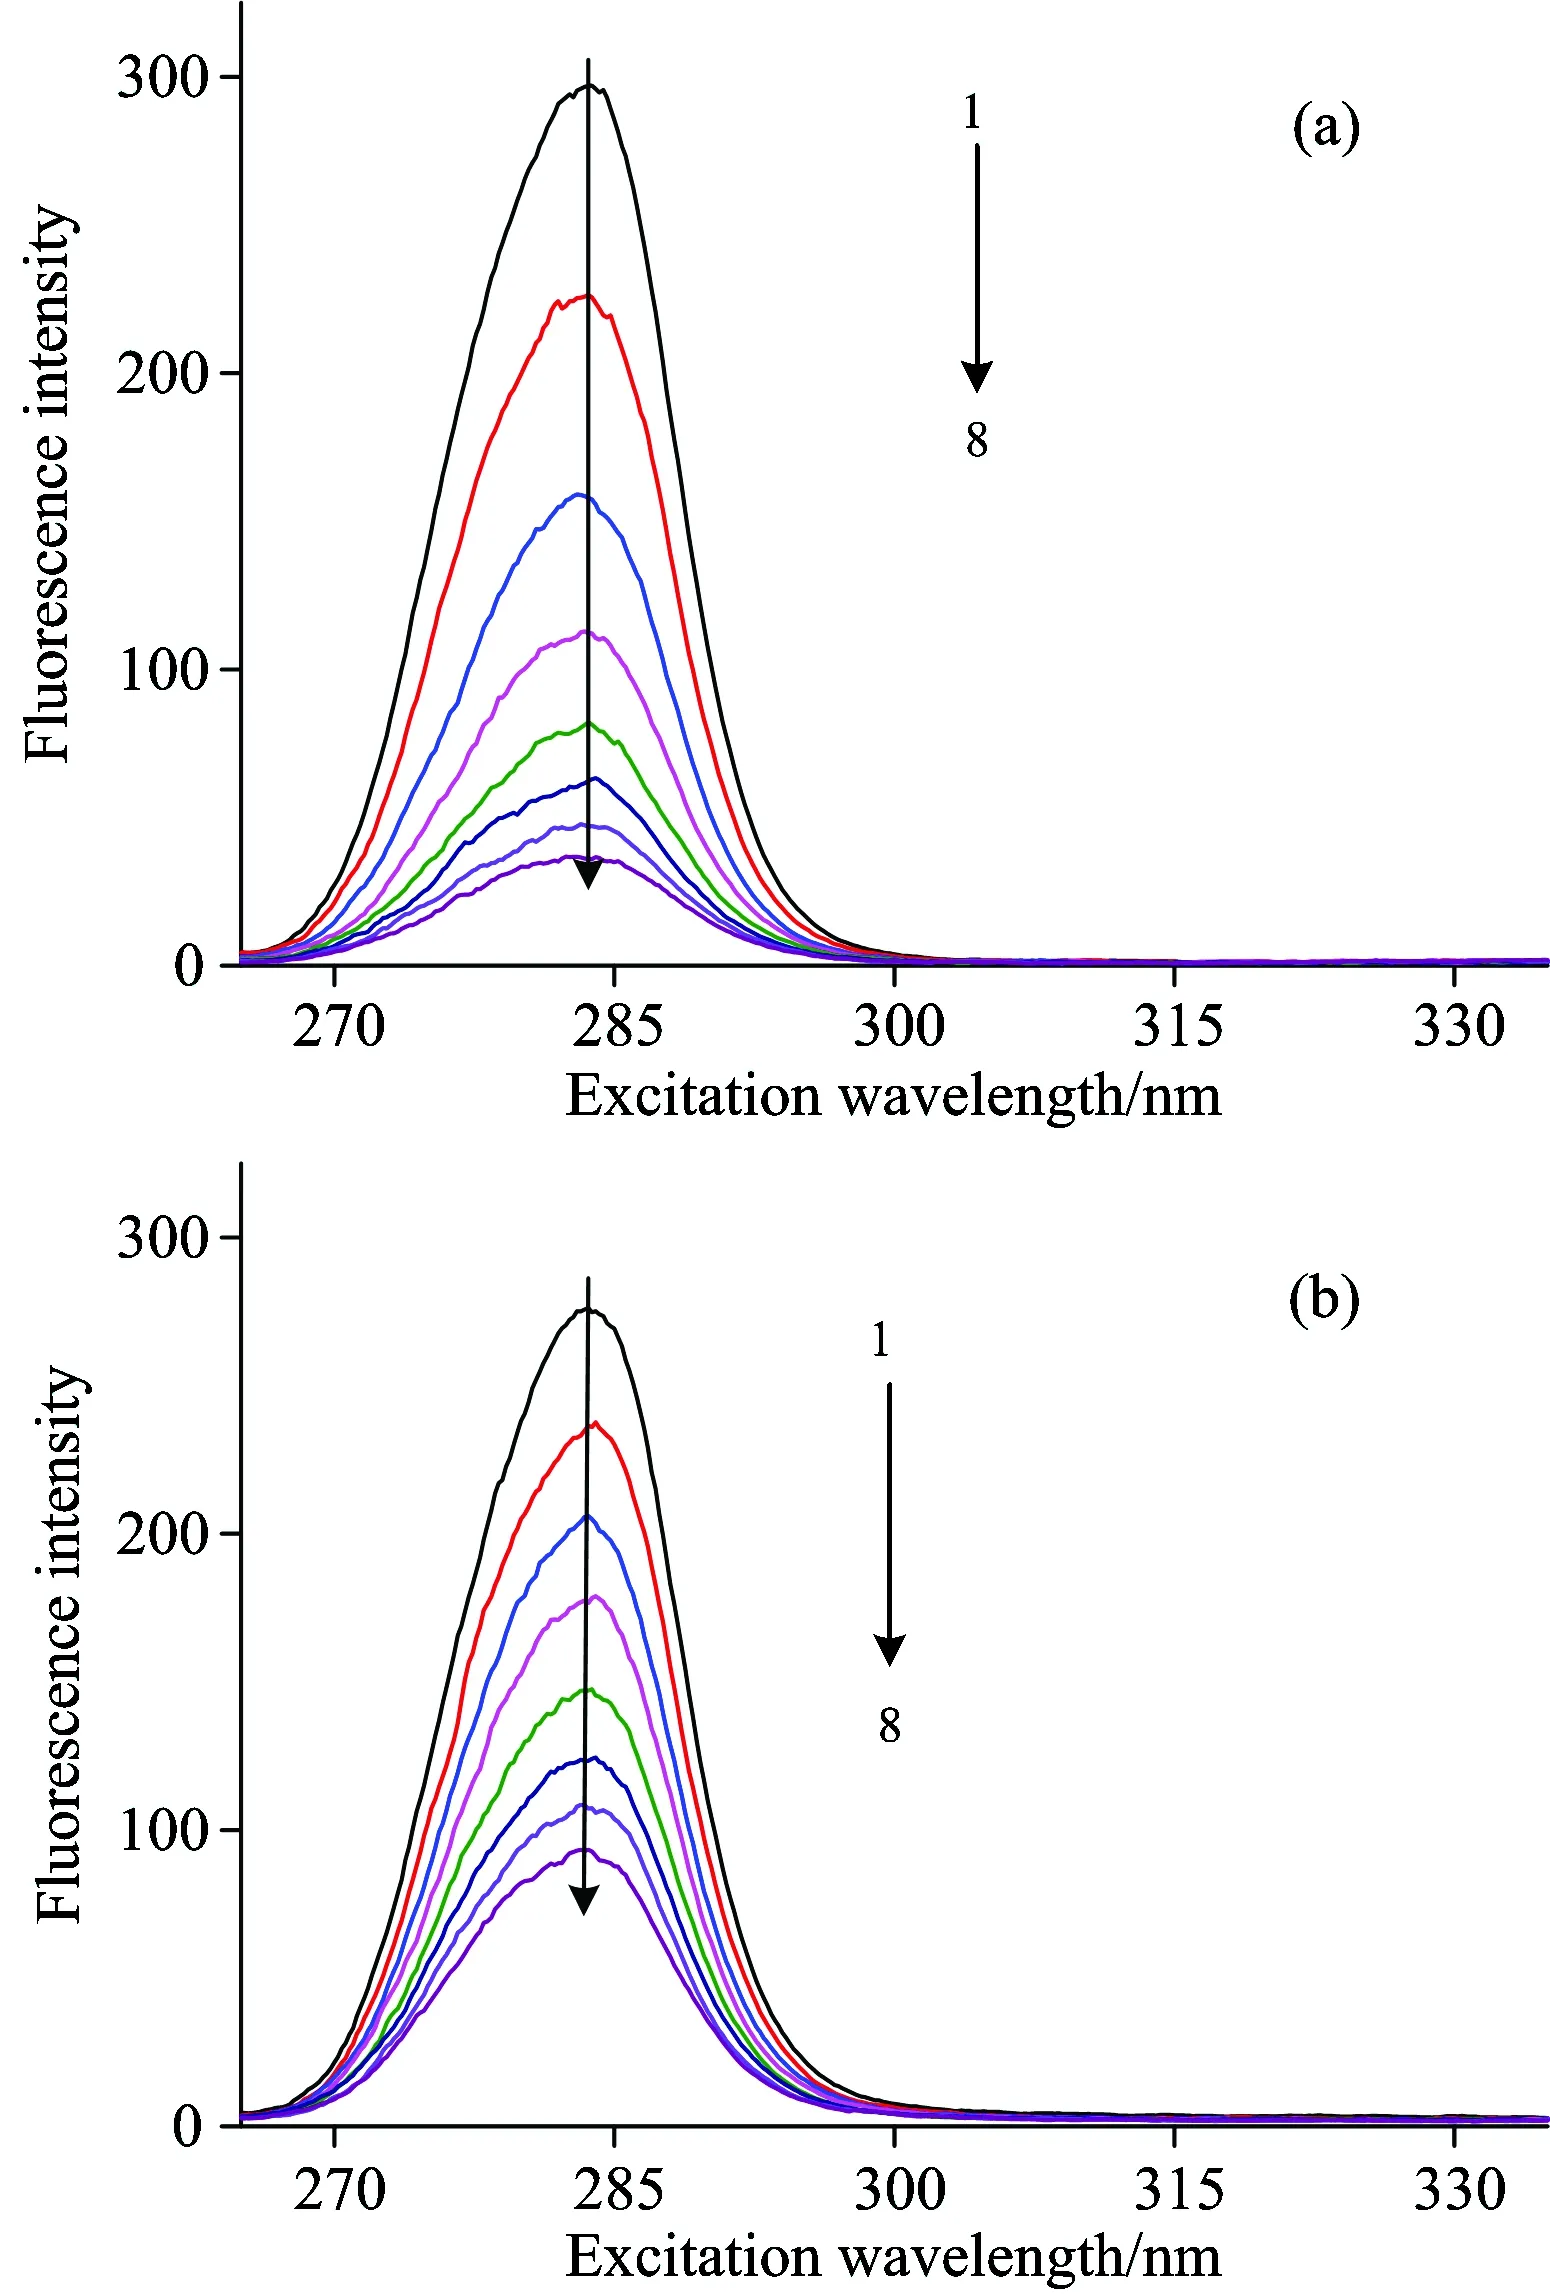
Fig.5 Synchronous fluorescence spectra of (a) SAA-insulin and (b) SAB-insulin (Δλ=15 nm)
From curve 1→8,cInsulin=5×10⁻⁶mol·L-1,cSAA=cSAB=0, 4, 8, 12, 16, 20, 24 and 28×10-6mol·L-1, respectively
2.5.2 Three-dimensional fluorescence spectroscopy
In three-dimensional fluorescence spectra, the excitation wavelength, the emission wavelength and the fluorescence intensity are the main parameters.They can provide detailed fluorescence information of the protein, which makes the investigation of the conformational changes of insulin[21].
Fig.6 presented the contour spectra of (a) insulin, (b) SAA-insulin, (c) SAA-insulin-glucose, (d) SAB-insulin and (e) SAB-insulin-glucose, and the related characteristic parameters were presented in Table 3.As we can see from the Fig.6, Peak 1 is the Rayleigh scattering peak (λex=λem) and Peak 2 the spectral behavior of Tyr residues.The intensity of peak 2 and the density of contour decreased obviously when the SAA and SAB were added.In addition, the fluorescence quenching extent of insulin by SAA was greater than that by SAB, suggesting the steric hindrance gave SAB a disadvantage to combining with insulin.But the Stokes shift had no significant change, which demonstrated that SAA and SAB had no significant affect on the polarity and hydrophilicity around Tyr microenvironment.The above results were similar to what is shown in the synchronous fluorescence spectra.


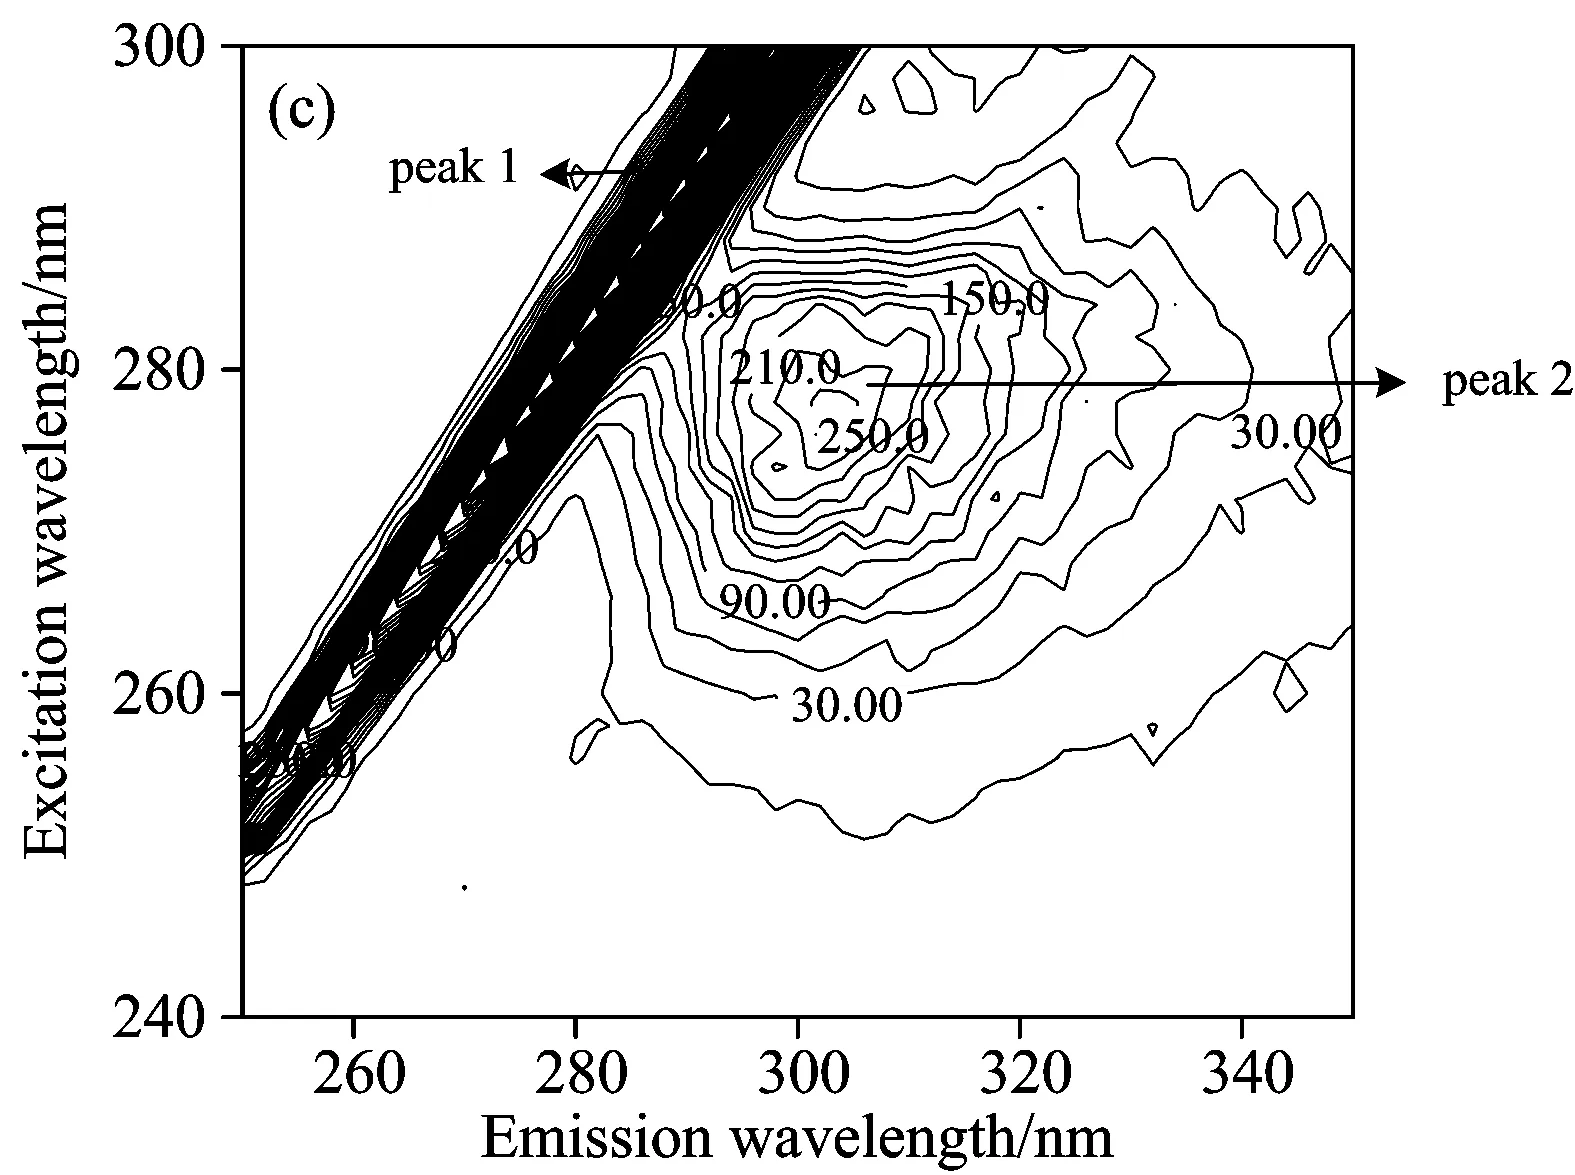
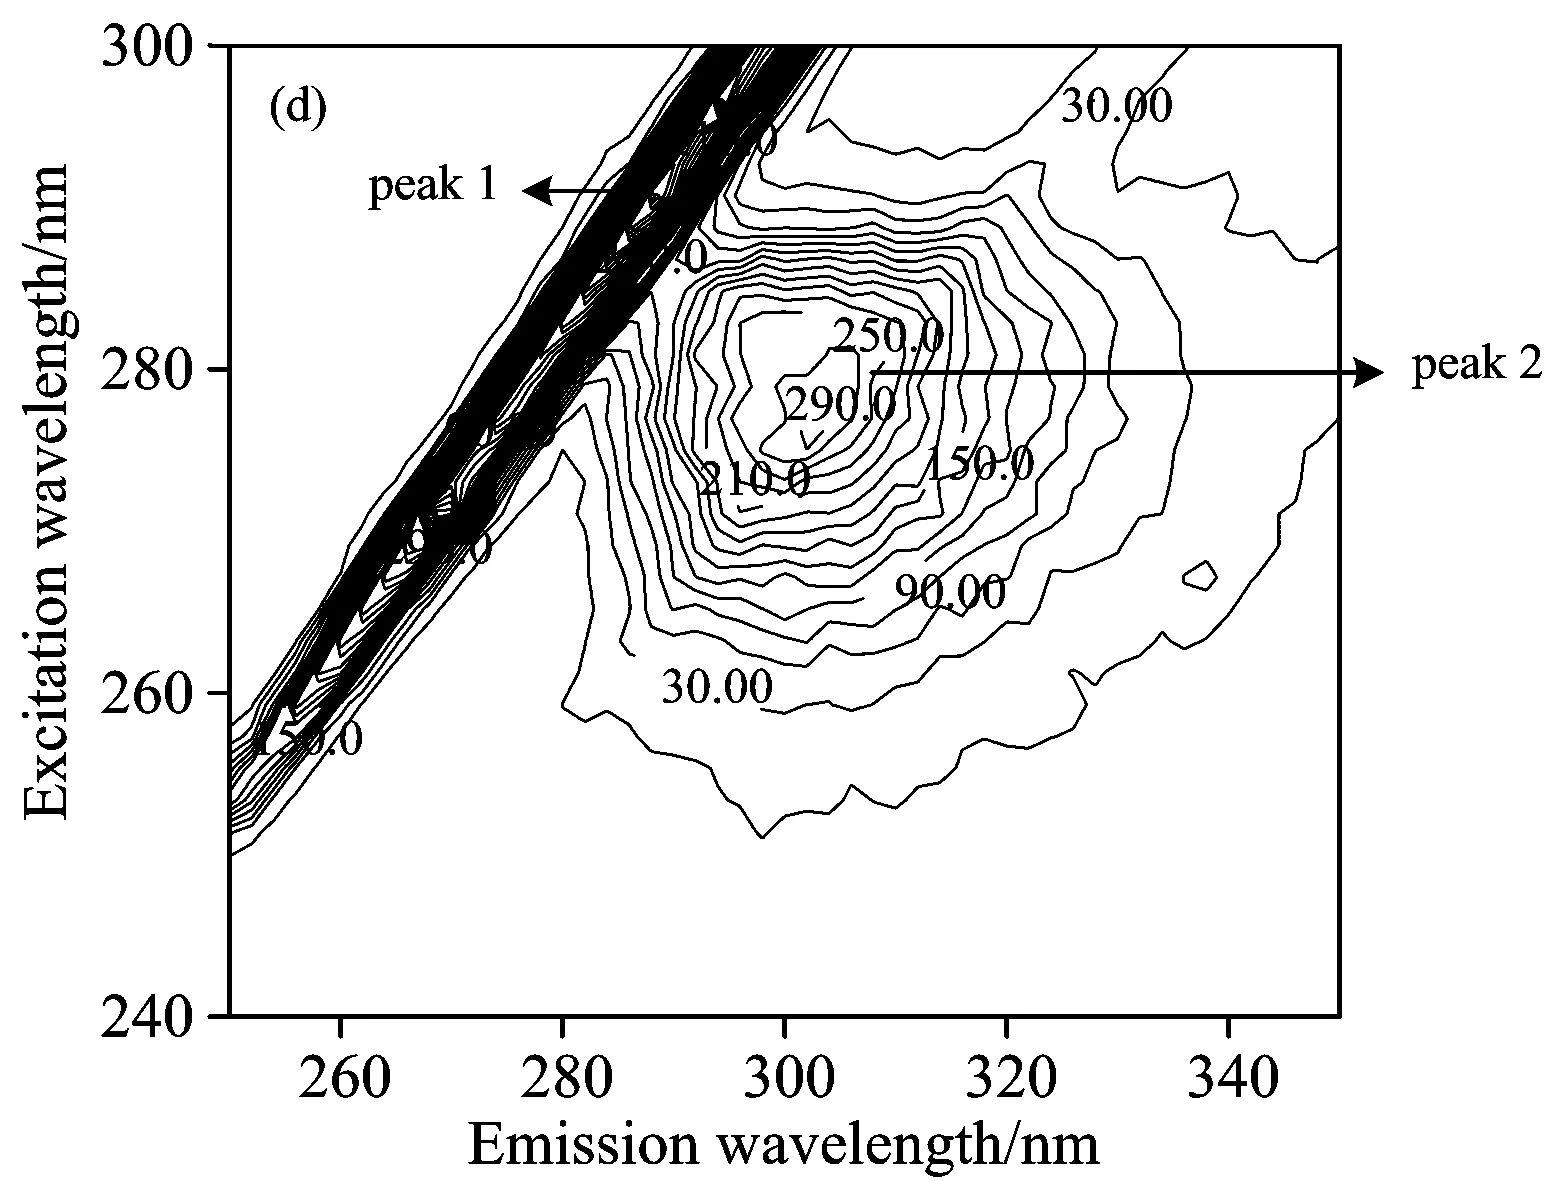

Fig.6 Contour spectra of (a) insulin, (b) SAA-insulin, (c) SAA-insulin-glucose, (d) SAB-insulin and (e) SAB-insulin-glucose
cInsulin=cSAA=cSAB=5×10⁻⁶mol·L-1,ωGlucose=5%
Table 3 Contour spectra characteristics of insulin, SAA-insulin, SAB-insulin, SAA-insulin-glucose and SAB-insulin-glucose

Peak2(λex/λem)IntensityInsulin276/303367Insulin-SAA276/303268Insulin-SAB276/303313Insulin-SAA-glucose278/305267Insulin-SAB-glucose278/305302
2.5.3 ATR-FTIR spectra
Infrared spectra of proteins represent different vibrations of the peptide.In general, the spectra range in 1 682~1 689 and 1 613~1 637 cm-1in amide Ⅰ bands can be attributed to β-sheets structure.The α-helices is in 1 645~1 662 cm-1region, and the position in the 1 662~1 682 and 1 637~1 645 cm-1region are regarded as β-turns and random coil structure, respectively[22].
The ATR-FTIR spectrum of the buffer solution (Tris-HCl) and insulin were firstly collected and then subtracted the spectrum of buffer from that of insulin to get the ATR-FTIR differential spectrum of insulin.In the similar way, the spectra of SAA (SAB) and SAA (SAB)-insulin were collected, the latter spectra subtracted that of SAA (SAB) to obtain the differential spectra of insulin after binding with SAA or SAB.
Fig.7 showed the ATR-FTIR differential spectra of insulin in Tris-HCl buffer and after binding with SAA or SAB.It could be seen that the peak position of the amide I band was at 1 649 cm-1and amide Ⅱ at 1 542 cm-1.The peak position did not change after SAA or SAB was added.
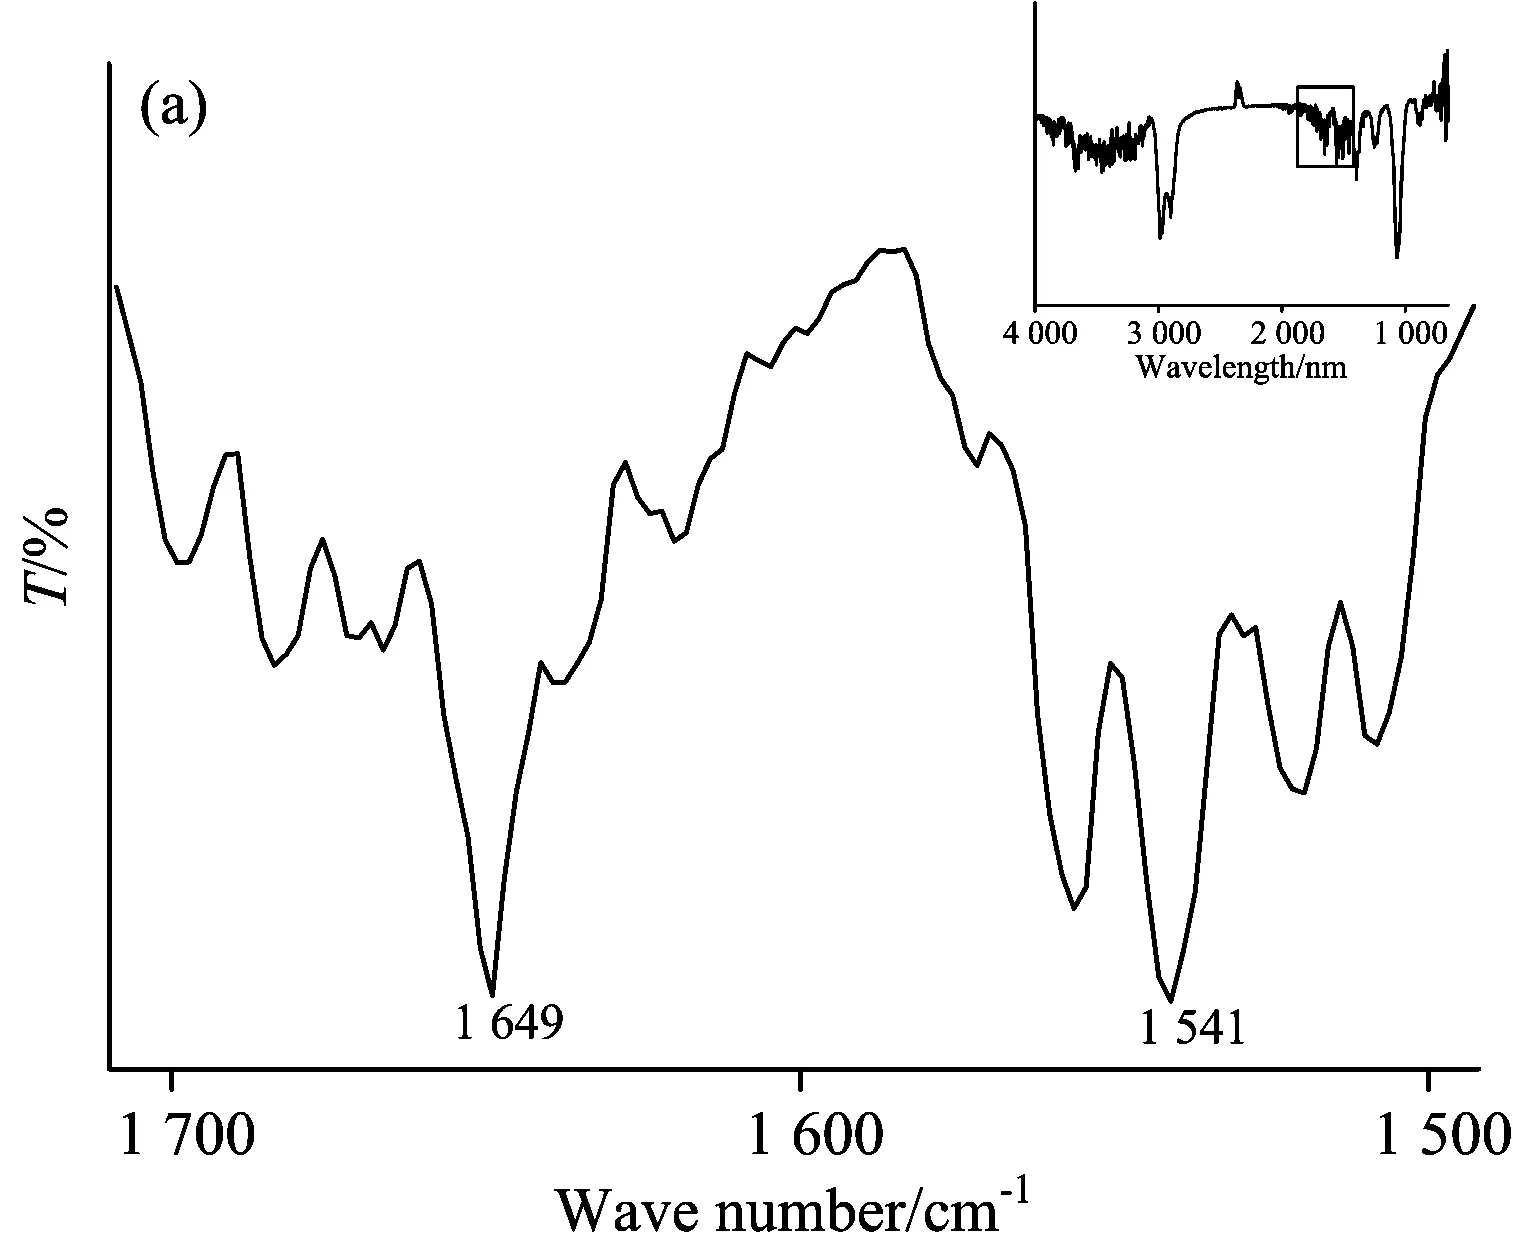


Fig.7 ATR-FTIR differential spectra of (a) insulin, (b) (SAA-insulin)-SAA, (c) (insulin-SAA-glucose)-(SAA-glucose), (d) (SAB-insulin)-SAB and (e) (insulin-SAB-glucose)-(SAB-glucose) system
A quantitative analysis of the protein secondary structure was given in Fig.8 and Table 4.The relative content of α-helices of insulin was 28.62%±0.41%, β-sheets 29.14%±1.21%, β-turns 30.62%±0.65%, and random coil 11.62%±0.59%.The contents of β-turns decreased and random coil increased markedly (p<0.05), while α-helices and β-sheets had no significant change (p>0.05) with the accession of SAA and SAB.The relative contents of different secondary structures of insulin changed, suggesting that SAA and SAB could influence the secondary structures of insulin.But the contents of α-helices and β-sheets had no significant change, suggesting that the active binding site of insulin might not be influenced by SAA and SAB, that is to say the change on biological function was not obvious when SAA or SAB binding to insulin.It also confirmed the results of synchronous fluorescence spectra and the three dimensional fluorescence spectra.
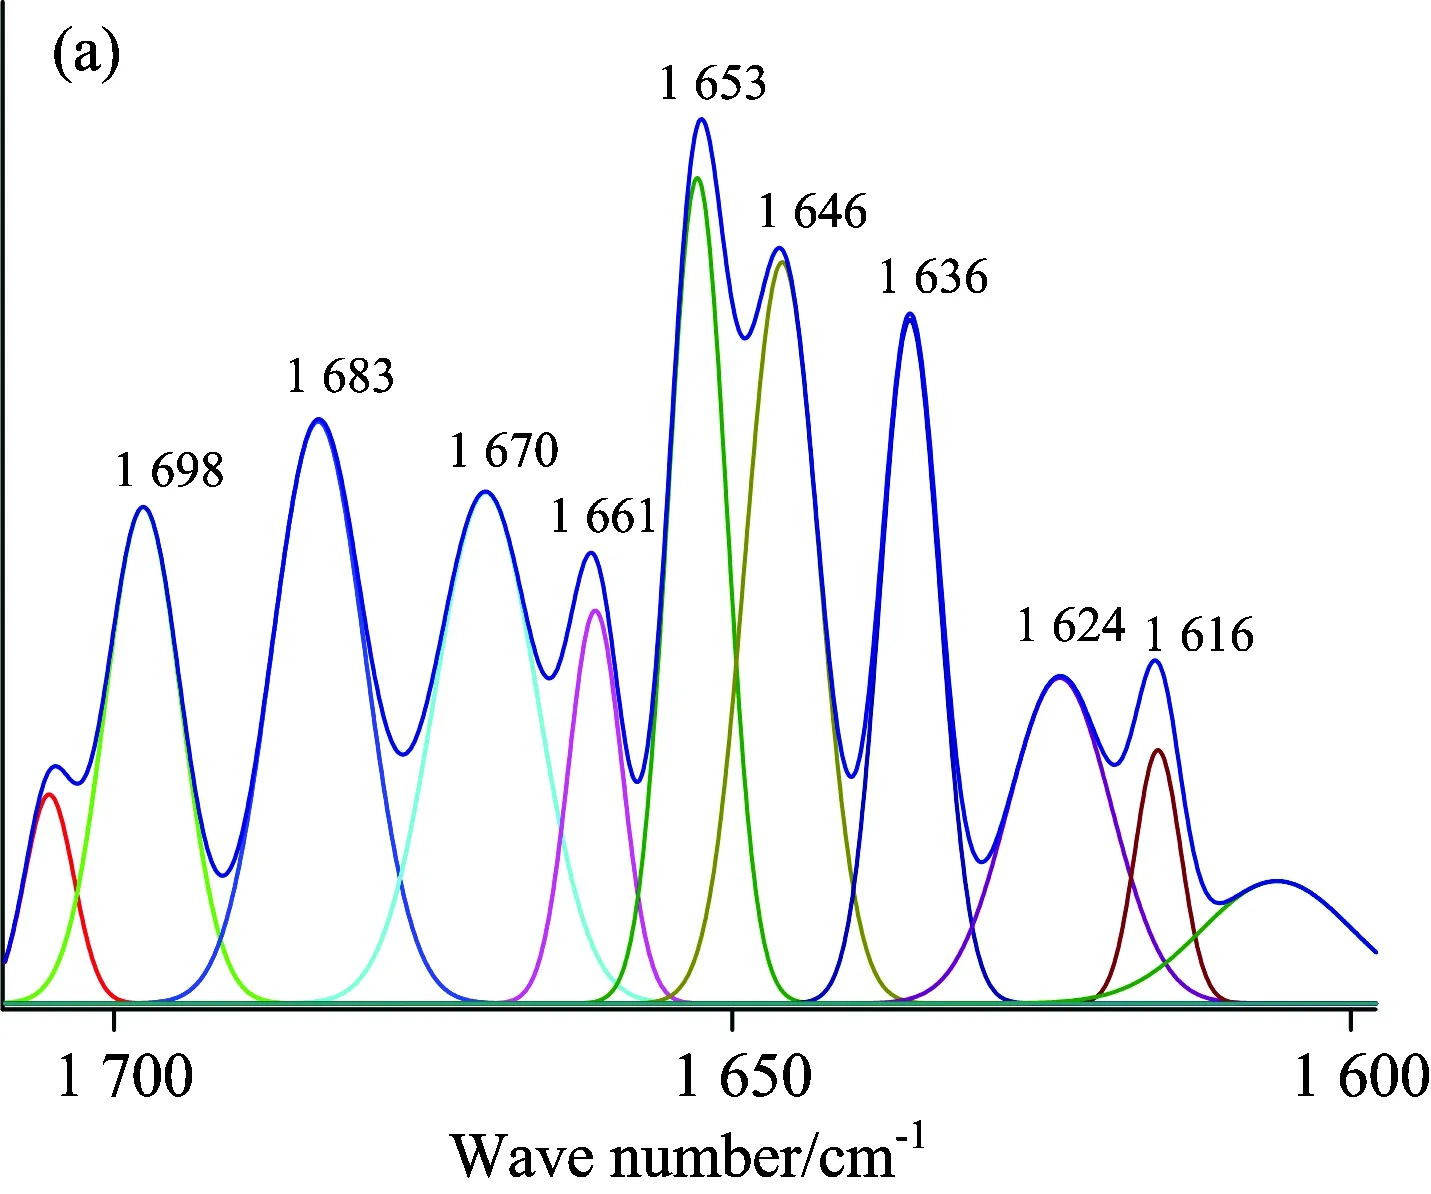
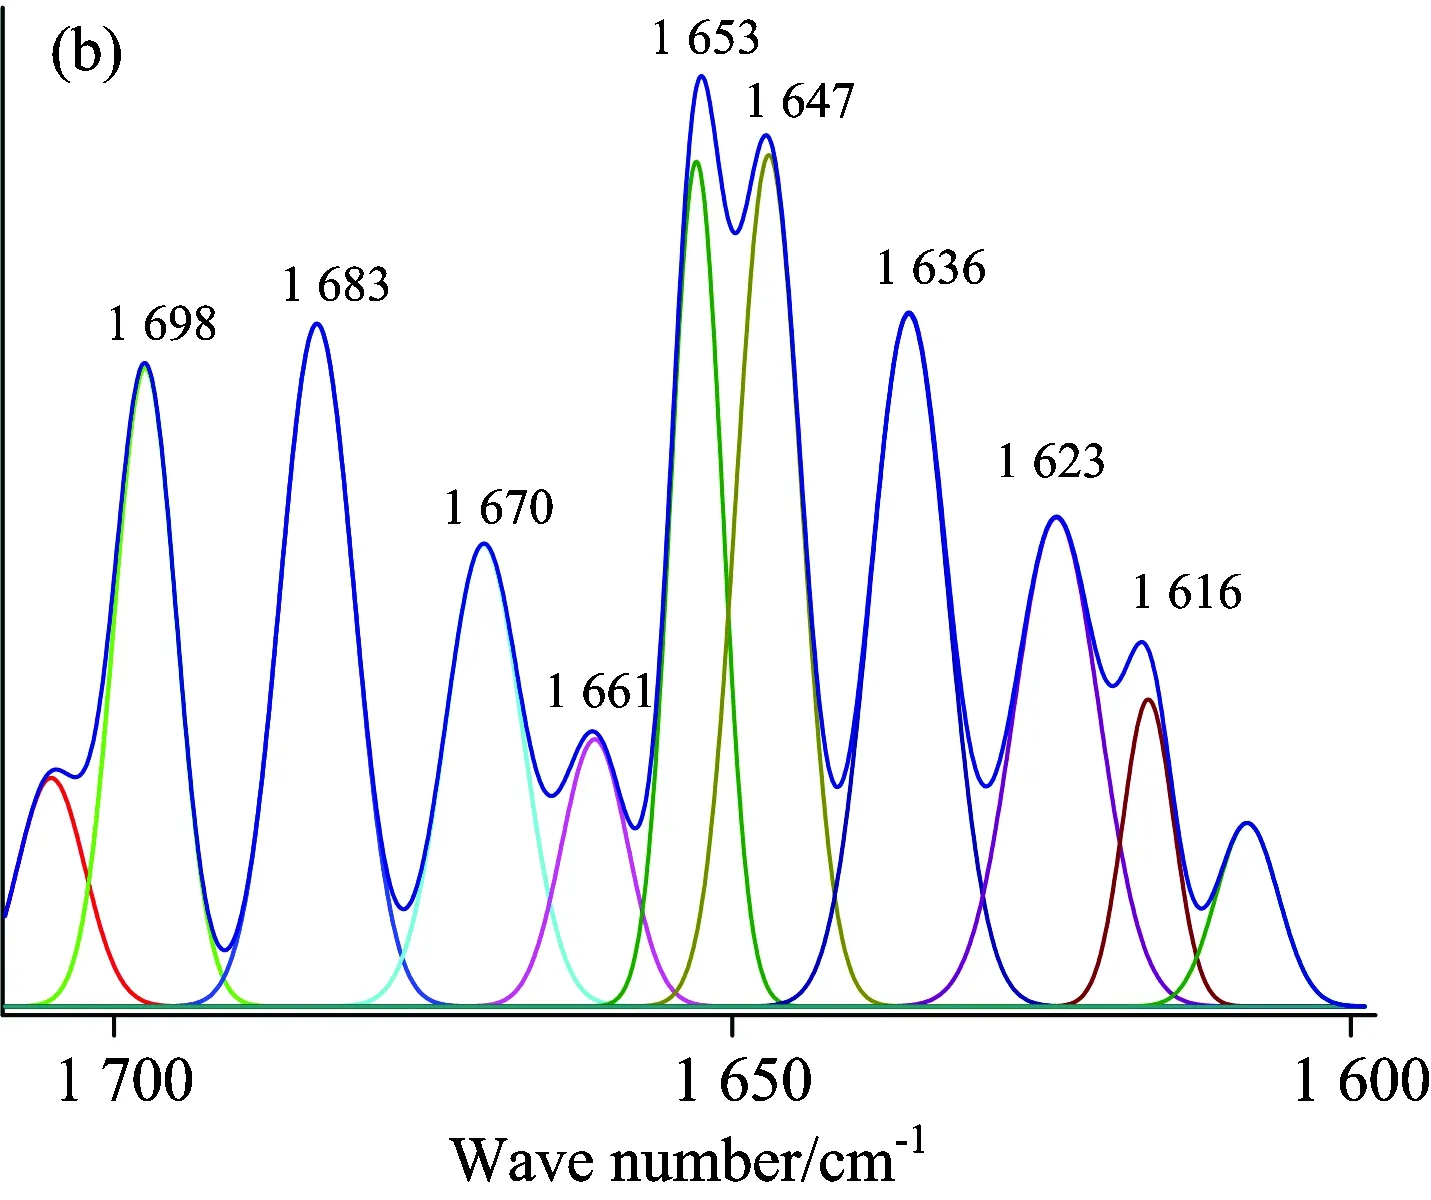
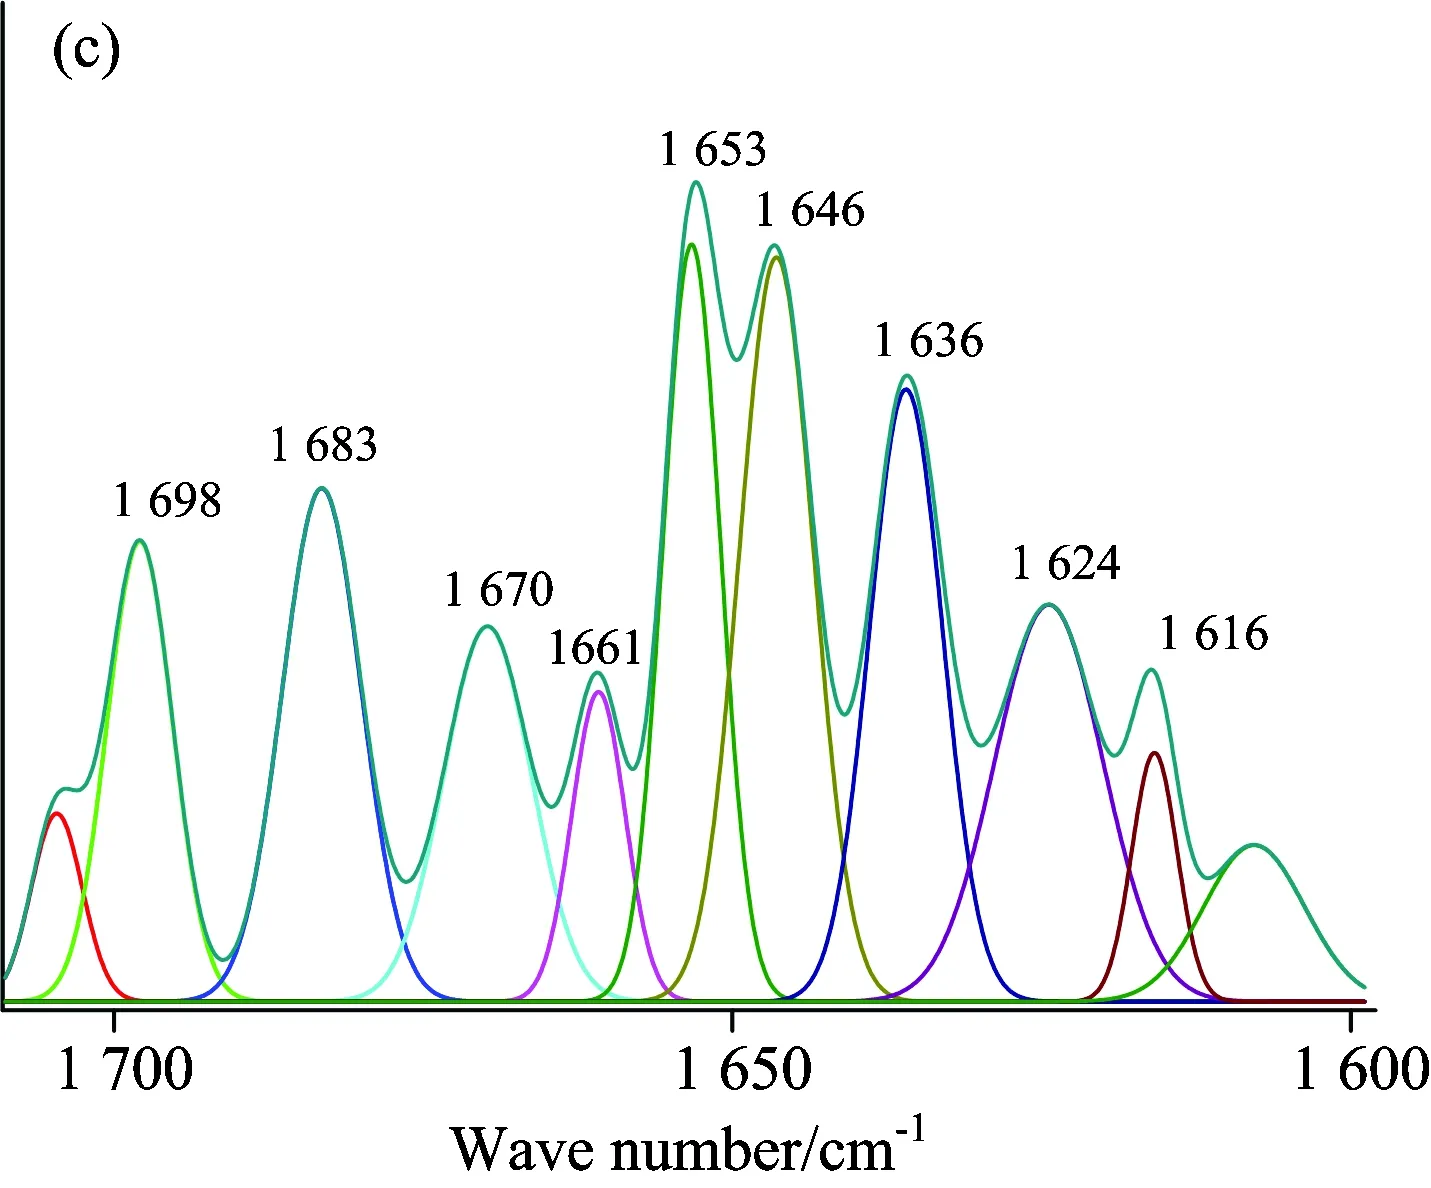

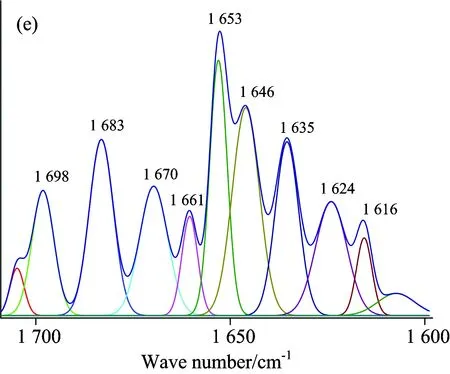
Fig.8 ATR-FTIR curve-fitting figures of differential spectra: (a) insulin, (b) (SAA-insulin)-SAA, (c) (insulin-SAA-glucose)-(SAA-glucose), (d) (SAB-insulin)-SAB and (e) (insulin-SAB-glucose)-(SAB-glucose) system

Table 4 The relative contents of different secondary structures
*p<0.05 compared with insulin system
2.6 Influence of glucose on binding constants and conformation
The influence of glucose on the interactions between insulin and SAA or SAB was further studied.The binding constants of the SAA (SAB)-insulin-glucose system were listed in Table 5.Obviously, the binding constant of SAA-insulin system with glucose was decreased from 7.79×10⁷to 0.30×10⁷, indicating glucose could lower the binding of SAA to insulin.But the binding constant of SAB-insulin system with glucose was increased from 1.39×10⁶to 6.34×10⁶, demonstrating glucose could accelerate the binding of SAB to insulin.By decreasing the binding constants of SAA and increasing of SAB with insulin, the free concentration of SAA was reduced and SAB increased, which was advantage over SAA but adverse to SAB to keep plasma drug concentration.
Table 5 Binding constant and the number of binding sites of SAA-insulin-glucose and SAB-insulin-glucose
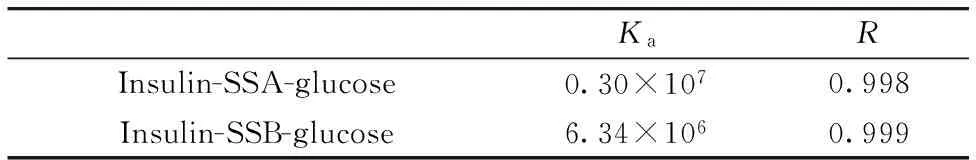
KaRInsulin-SSA-glucose0.30×1070.998Insulin-SSB-glucose6.34×1060.999
The contour fluorescence spectra and related characteristic parameters of SAA-insulin or SAB-insulin in the absence and presence of glucose were shown in Fig.6(c, e) and Table 3.With comparison and analysis, the Stokes shift had some changes in SAA(SAB)-glucose system, demonstrating that glucose might have some affect the polarity and hydrophobicity around Tyr microenvironment.
The ATR-FTIR Gauss curve-fitting figures after insulin binding with SAA-glucose (SAB-glucose) were shown in Fig.8(c, e) and contents of secondary structure listed in Table 4.It was obviously that the contents of α-helices and β-turns changed significantly while the changes of β-sheets and random coil had no statistically significant.It indicated that the bioactivity of insulin might be influenced after binding with SAA-glucose or SAB-glucose.
3 Conclusions
This paper presents the interactions of SAA or SAB with insulin and effect of glucose on the binding.SAA and SAB quenched the intrinsic fluorescence of insulin by static quenching process.The extent of insulin fluorescence quenching by SAA was greater than that by SAB at 298 K, suggesting the steric hindrance gave SAB a disadvantage to combining with insulin.The conformation has hardly any change after SAA and SAB binding with insulin.SAA and SAB could not affect the secondary structure of α-helices and β-sheets of insulin by ATR-FTIR.The results of second structure and conformation of insulin showed the biological activity was maybe not obviously changed after SAA or SAB binding to insulin.The binding constant of SAA-insulin system with glucose was decreased, while SAB-insulin system increased, which indicated glucose was an advantage over SAA but adverse to SAB keeping the plasma drug concentration.And the contents of α-helices changed significantly suggested that the bioactivity of insulin might be influenced after the accession of glucose.
The study results show that SAA and SAB could combine with insulin in glucose injection, by which free drug concentrations of DANSHEN injection were decreased.And the activity site of insulin might be changed after binding with glucose, by which the efficacy of insulin might be influenced.The above results provided an important theoretical research for glucose injection in combination of DANSHEN injection with insulin in the treatment of diabetes mellitus.
[1] Zhang Mei, Li Xu, Qiu Genquan, et al.Jorunal of Chinese Medicinal Materials,2005, 28(6): 529.
[2] Rong Xiuhua, Han Xuewen.Jorunal of Binzhou Medical College,1996, 19(6): 539.
[3] Zhao Ling.Journal of Zhejiang College of Traditional Chinese Medicine,2009, 33(1): 82.
[4] Wang Xiaomei, Zhen Zhuoli, Chen Xiaofen, et al.Journal of Hebei Medicine,2005, 11(9): 769.
[5] Hye Sook Kang, Hae Young Chung, Dae Seok Byun, et al.Arehievs of Pharmacal Researeh,2003, 26(1): 24.
[6] Fan Huaying, Fu Fenghua, Yang Mingyan, et al.Thrombosis Research,2010, 126(1): 17.
[7] Huang Z S, Zeng C L, Zhu L J, et al.Journal of Thrombosis and Haemostasis,2010, 8(6): 1383.
[8] Wang Shoubao, Tian Shuo, Fan Yang, et al.European Journal of Pharmacology,2009, 615(1-3): 125.
[9] Guo Yongxue, Xiu Zhilong, Zhang Daijia, et al.Joumal of Pharmaceutical and Biomedical Analysis,2007, 43(4): 1249.
[10] Yang Yanyi, Tian Ying, Tian Yanjiao, et al.Chinese Journal of Geriatric Care,2010, 8(4): 22.
[11] Ye Yunhua.University Chemistry,2010, 25: 19.
[12] Pullen R A, Lindsay D G, Stephen P Wood, et al.Nature, 1976, 259(5542): 369.
[13] Kazarian S G, Chan K L A.Biochimica Et Biophysica Acta-Biomembranes,2006, 1758(7):858.
[14] Hua Shi, Ling Xiong, Yang Kunyun, et al.Journal of Molecular Structure,1998, 446: 137.
[15] Cui Fengling, Qin Lixia, Zhang Guisheng, et al.Journal of Pharmaceutical and Biomedical Analysis,2008, 48: 1029.
[16] Li Qiang, Yang Wenyue, Qu Lingling, et al.Journal of Spectroscopy,2014, 834501:7.
[17] Huang Yun, Cui Lijian, Wang Jianming, et al.Journal of Luminescence,2012, 132: 357.
[18] Yang Jie, Qu Lingling, Yang Wenyue, et al.Journal of Spectroscopy,2014, 386586:9.
[19] Huang Yun, Cui Lijian, Chen Chen, et al.Chinese Pharmacological Bulletin,2010, 26(6): 754.
[20] Cui Fengling, Qin Lixia, Hu Xing, et al.Journal of Pharmaceutical and Biomedical Analysis,2008, 48: 1029.
[21] Huang Yun, Cui Lijian, Wang Jianming, et al.European Journal of Medicinal Chemistry,2011, 46: 6039.
[22] Zhang Xuan, Huang Lixin, Nie Songqing, et al.Journal of Chinese Pharmaceutical Sciences,2003, 12(1): 11.
*通讯联系人
O446.1
A
丹参酚酸A和丹参酚酸B与胰岛素相互作用的分子光谱学研究以及葡萄糖的影响
杨文月1, 崔 琳1,渠玲玲1, 许 宁1, 黄 芸1,2*, 崔力剑3*, 詹文红1,赵 丁1
1.河北医科大学药学院,河北 石家庄 050017 2.河北医科大学中西医结合研究所,河北 石家庄 050017 3.河北中医学院药学院,河北 石家庄 050091
采用紫外-可见光谱、荧光光谱和傅里叶变换衰减全反射红外光谱等技术,研究在模拟人体生理Ph值条件下,丹参酚酸A(或丹参酚酸B)与胰岛素分子之间的结合作用,以及丹参酚酸A(或丹参酚酸B)对胰岛素二级结构的影响,并考察葡萄糖对它们的影响。实验结果表明,丹参酚酸A和丹参酚酸B均能导致胰岛素内源性荧光静态猝灭;同步荧光和三维荧光谱图表明胰岛素与丹参酚酸A(或丹参酚酸B)结合后,构象没有发生明显变化。红外光谱研究表明,胰岛素与丹参酚酸A(或丹参酚酸B)结合后二级结构发生了一些改变,β-转角和无规则卷曲的相对含量略有增加,α-螺旋和β-折叠没有发生明显改变。葡萄糖的加入会改变丹参酚酸A(或丹参酚酸B)与胰岛素的结合程度,并加剧胰岛素构象变化以及二级结构中α-螺旋相对含量改变,从而影响丹参酚酸A(或丹参酚酸B)-胰岛素体系中胰岛素的生物活性。
丹参酚酸A;丹参酚酸B;胰岛素;葡萄糖;光谱
2015-05-06,
2015-09-17)
Foundation item:the HEBEI Province Science and Technology Support Program (142777114D),College Students’ Innovative Entrepreneurial Training Programs (USIP201525A)
10.3964/j.issn.1000-0593(2016)09-3053-09
Received:2015-05-06; accepted:2015-09-17
Biography:YANG Wen-yue, (1989—), female, postgraduate student, Pharmaceutical College of Hebei Medical University *Corresponding authors e-mail: huangyun9317@126.com; cuilijianzy@126.com
猜你喜欢
杂志排行

光谱学与光谱分析的其它文章
- 基于高光谱的环首都地区数字高程模型与可吸入颗粒物的空间相关性研究
- 大豆硒蛋白构象的光谱法研究
- Synthesis of La-Co-O Mixed Oxides via Polyethylene Glycol-Assisted Co-Precipitation Method for Total Oxidation of Benzene
- Mercury in Sclerotia of WolfiporiaExtensa (Peck) Ginns Fungus Collected Across of the Yunnan Land
- 可拓神经网络模式识别对成品油的鉴别与测量
- Spectroscopic Analysis of Organophosphorus Pesticides Using Colorimetric Reactions