Ordered Toroid Structures of Nanoparticles in Self-attractive Semiflexible Polymer/Nanoparticle Composites
2016-07-05ZhiyongYngAihuChiPingLiYongfuYngDeprtmentofPhysicsJingxiAgriculturlUniversityNnchng330045ChinCollegeofMthemticsPhysicsndInformtionEngineeringJixingUniversityJixing314001Chin
Zhi-yong Yng,Ai-hu Chi,Ping Li,Yong-fu Yng. Deprtment of Physics,Jingxi Agriculturl University,Nnchng 330045,Chin . College of Mthemtics Physics nd Informtion Engineering,Jixing University,Jixing 314001,Chin
Ordered Toroid Structures of Nanoparticles in Self-attractive Semiflexible Polymer/Nanoparticle Composites
Zhi-yong Yanga∗,Ai-hua Chaib,Ping Lia,Yong-fu Yanga
a. Department of Physics,Jiangxi Agricultural University,Nanchang 330045,China b. College of Mathematics Physics and Information Engineering,Jiaxing University,Jiaxing 314001,China
(Dated:Received on November 13,2015;Accepted on January 4,2016)
By employing dynamic Monte Carlo simulations,we investigate a coil-to-toroid transition of self-attractive semiflexible polymers and the spatial distributions of nanoparticles in selfattractive semiflexible polymer/nanoparticle composites. The conformation of self-attractive semiflexible polymers depends on bending energy and self-attractive interactions between monomers in polymer chains. A three-stage process of toroid formation for self-attractive semiflexible chains is shown:several isolated toroids,a loose toroid structure,and a compact toroid structure. Utilizing the compact toroid conformations of self-attractive semiflexible chains,we can control effectively the spatial distributions of nanoparticles in self-attractive semiflexible polymer nanocomposites,and an unconventional toroid structure of nanoparticles is observed.
Key words:Self-attractive semiflexible polymer,Nanoparticles,Toroidal structure
∗Author to whom correspondence should be addressed. E-mail:zhiyongyang2009@163.com
I. INTRODUCTION
In a poor solvent,the monomers try to exclude the solvent and effectively attract one another to form a compact globule of spherical shape to minimize the surface area between monomers and solvent for flexible polymers. As solvent quality changes from the good to the poor,the dynamics of the coil-globule transition for flexible polymers are relatively well known[1-4]. However,many polymers exhibit substantial bending stiffness,i.e.,they are semiflexible,and can collapse towards very different equilibrium states in poor solvent. There are lots of semiflexible polymers in living nature and industry field. Biopolymers(such as F-actin,DNA,and xanthan)and synthetic polymers(such as PPTA and PBO)are used for production of high-performance fibers. They can form open,extended structures in good solvents. However,in poor solvent,semiflexible polymers are collapsed due to the effective self-affinity of polymers,and they can form different equilibrium states and follow different kinetics from flexible polymers,driven by the interplay between two opposing forces:the bending force related to the chain stiffness and the attractive force due to the poor solvency of the environment.
The collapsed configurations of semiflexible polymers have been investigated experimentally[5,6]and theoretically[7-13]. The semiflexible polymers might undergo either a coil-to-toroid or a coil-to-bundle transformation as the interaction strength increases. Possible conformational transformations are sensitive to chain stiffness. For example,Seaton et al. have investigated the full conformation behavior of polymers classes from flexible to stiff,and it was found that the structural phase diagram can be clearly separated into three major regions:random coils and rods,liquid globules,and a variety of structured phases such as solid globular,rodlike bundles and toroids[13].
The dynamics of semiflexible polymers has received much attention because it is relevant for understanding DNA condensation. DNA frequently forms condensed structures in vivo[14]. Multivalent cations,in particular polyamines,have been used to induce DNA condensation in vitro,showing that the toroidal and rodlike structures exist in the condensed DNA. Polyamines are also believed to induce DNA condensation in vivo[15]. A better understanding of the dynamics of DNA condensation would lead to improvements in gene delivery technology,as it may help define the best conditions and protocols to obtain DNA condensation. Although the conformations of self-attractive semiflexible chains have been investigated,the collapse process of semiflexible chains has not been studied in detail.
The mixture of nanoparticles and polymers is very ubiquitous in nature. The incorporation of nanoparticles into polymers can drastically alter the properties of the host polymers[16]. Such polymer nanocomposites have attracted lots of attention[17],and these materials can offer unique mechanical,electrical[18],optical [18,19],and thermal properties[20]. A most concernedtopic on the polymer/nanoparticle composites is the spatial arrangement and distribution of nanoparticles in the nanocomposites,which is controlled by the competition between the entropic packing constraints related to the incompatibility between species with different size and geometry,and the enthalpic consequences of variety of polymer-nanoparticle interactions[21]. Spatial arrangement for small numbers of nanoparticles(from 1 to 100)may be helpful for deciphering the structure of matter at many length scales[22],controlling the crystallization behaviors of particles[23],and understanding the structure of chromatin[24]. With direct attractive interactions being absent,nanoparticles in the free state are nearly independent of each other when only small numbers of nanoparticles are present. A suitable medium should be provided to collect these independent nanoparticles together and to control their structures. Some existing experimental mediums used to study the packing of small numbers of nanoparticles include liquid emulsion droplets[22]and aqueous solutions containing small poly(N-isopropylacrylamide)(polyNIPAM)nanoparticles[25]. Meanwhile,long semi-flexible polymer chains can also serve as an effective soft elastic medium for manipulating the ordered structures of small numbers of nanoparticles,which can be easily controlled by the chain bending stiffness[21]. These ordered structures only consist of spherical dense packing and linear contact aggregation[21]. In order to obtain some new aggregation structures of nanoparticles such as toroid or bundle structures,the spatial distribution of nanoparticles in self-attractive semiflexible polymer-nanoparticle mixtures are investigated. By varying the chain bending stiffness,the ordered toroid structures of nanoparticles in self-attractive semiflexible polymer/nanoparticle composites can be controlled well.
II. MODEL AND METHODS
Dynamic Monte Carlo(DMC)method on three dimensional off-lattice model is employed to study the phase transition of self-attractive semiflexible polymer chains and the conformations of polymer/nanoparticle composites in the periodic box (200lmax×200lmax×200lmax)(lmaxis the maximal bond length). The chain contains N+1 effective monomers,and the neighboring monomers in polymers are connected by the finitely extendable nonlinear elastic (FENE)potential(UFNEN),

here liis the length of i-th effective bond,which can vary in the range of lmin=0.4 to lmax=1.0,and its preferred distance l0is 0.7(where lmaxis the unit of length). re=lmax-l0=l0-lmin,and the spring constant k is set to 20 in the units of kBT(where kBis the Boltzmann constant and T is the thermodynamic temperature). kBT is chosen to be the unit of energy.
The interactions between nonbonded monomers are governed by standard Lennard-Jones potential(ULJ)[26],

here r is the distance between nonbonded monomers. The monomer-monomer interaction parameter εmis used to control the attractive interaction strength of nonbonded monomers,and σmis set to 0.76.
The bending energy used to describe the stiffness of polymer chain is modeled by an angle potential between adjacent bonds[26]:

where θ is the angle between two consecutive bonds,and b is the bending energy. The chain rigidity can be adjusted by varying b. In addition,b is in the unit of kBT.
Any two nanoparticles interact via a purely repulsive truncated and shifted Lennard-Jones potential:for

here r is the distance between the center of two nanoparticles,σnis their diameter,and its value is σn=1.5σm. The energy parameter εnis set to 1.0.
The interaction between the nanoparticles and the monomers of polymer chain is also via Lennard-Jones potential[12]

where r is the distance between the centers of nanoparticle and monomer of polymer chain.σpnis the nanoparticle-monomer contact distance[27]. The energy parameter σpnis set to 1.0.
All results presented here are obtained by DMC simulations[28]. DMC simulations are performed according to the Metropolis algorithm. In more detail,a trial move is accepted if∆>η,∆=min(e-∆U/kBT,1)is the transition probability depending on the difference in energy∆U between the trial and old states,and η is the number uniformly distributed in the interval[0,1). For each simulation,6×107Monte Carlo steps(MCS)are performed to ensure the chain to reach equilibrium. The data are collected by averaging over 100 independent runs,and each independent run includes 100 measurements at intervals of 1×10⁶MCS after the chains havebeen in the equilibrium states. Therefore,the statistical quantities of polymer chains are averaged over 104samples. As the errors of ensemble averages are less than symbol,they are not shown in the figures. The number of nanoparticles Nnand N are set to Nn=18 and N=200 in all simulations,respectively.

FIG. 1 The typical simulation snapshots for the 200-bond self-attractive semiflexible chains with different chain rigidities
III. RESULTS AND DISCUSSION
A. A coil-to-toroid transition of self-attractive semiflexible polymers
As indicated by the typical simulation snapshots in Fig.1,the conformations of self-attractive semiflexible polymers are deeply affected by the chain bending energy b. For b=0,the polymer chain is very flexible,and can collapse into a compact structure. When the rigidity of polymer chain increases,the polymer chain folds into toroid for b=80,which is governed by the competition between the attractive interaction and the chain bending energy. For b=160,the conformation is still toroid,however,both the number of toroids and the size of toroids decrease. As the value of b increases to 400,the conformation of polymer chain is very extended and rod-like.
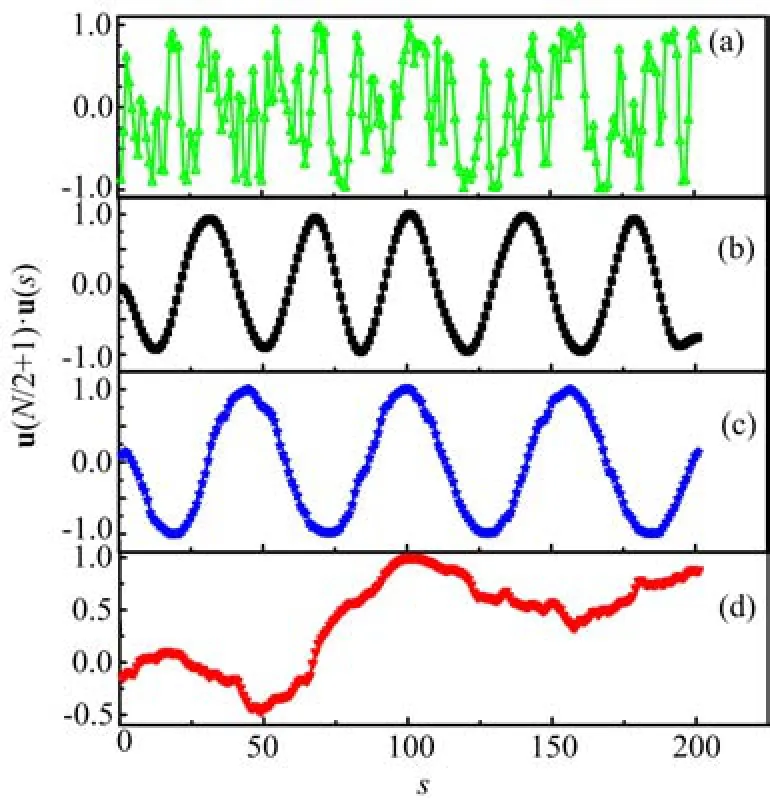
FIG. 2 The u(N/2+1)·u(s)as a function of s for these four conformations(a)b=0,(b)b=80,(c)b=160,(d)b=400. Here εm=1.25.

FIG. 3 The bending correlation function〈u(N/2+1)·u(s)〉as a function of s for different self-attractive energies εm. Here b=120.
In order to characterize the conformations in more detail,we calculate the correlation function u(N/2+1)·u(s)of these four typical conformations,and the results are shown in Fig.2. Here u(s)is the tangent unit vector at monomer s,and the value of u(N/2+1)·u(s)is calculated by only one conformation. For both b=80 and 160,the u(N/2 + 1)·u(s)oscillates periodically. The oscillating period becomes long and the number of periods decreases with the increase of b from 80 to 160. In addition,the number of periods is equal to the number of toroids,see Fig.1. However,the value of u(N/2+1)·u(s)is disordered for both b=0 and 400,and there are not any toroid structures for both self-attractive flexible and rigid polymers. As the values in Fig.2 are calculated from one sample,these results can't represent their statistical properties. Therefore,the bending correlation function〈u(N/2+1)·u(s)〉is employed to study the toroid conformations because the bending correlation functions are averaged over 104samples,and the results are shown in Fig.3. The bending correlation functions are usually used to study the conformations of interior monomers for semiflexible chains[28-30]. In Fig.3,the value of〈u(N/2+1)·u(s)〉oscilates periodically at the moderate attractive interactions for εm=0.75 and 3.50,and the number of peri-ods increases when εmincreases from 0.75 to 3.50. For other attractive interactions εmsuch as εm=0.5 or 3.75,〈u(N/2 + 1)·u(s)〉does not show periodicity. The selfattractive polymer chains can fold into toroid structures only in the regime of εm=0.75-3.50,and can collapse into the compact random coils at εm>3.75,or rod-like structures at εm<0.75.

FIG. 4 Average probability distribution P(ro)of monomers as a function of the relative distance roof monomers to the center of mass of chains for(a)different chain rigidities with εm=1.25 and(b)different self-attractive energies εmwith b=160.
In order to analyse the toroid conformation of selfattractive polymer chains,we calculate the average probability distribution P(ro)of monomers of polymer chains,where rois defined as:

where rmis the distance of monomer to the center of mass of polymer chains,and rmaxis the largest one. P(ro)means the average probability of finding a monomer in the global surface at a relative radius of ro. Firstly,we study the influence of bending energy b on the P(ro)at a fixed attractive interaction εm=1.25,as shown in Fig.4(a). P(ro)exhibits a Gaussian distribution with a long left-skewed tail for b=0,which indicates that the monomers of polymer chains distribute evenly around the center of mass. When the rigidity of polymer chain increases to b=160,P(ro)is 0 with ro≤0.6,which means that there aren't any monomers of polymer with ro≤0.6. Combining with the results of bending correlation function in Fig.3,we can confirm that the conformation of polymer chains with b=160 at εm=1.25 is indeed toroid. For b=400,P(ro)is very small for all robecause that the conformation is very extended and rodlike. The influence of attractive interaction εmon P(ro)is shown in Fig.4(b). At a weak attractive interaction of εm=0.5,P(ro)is similar to the Gaussian distribution with a long right-skewed tail,and is close to 0 around the center of mass,which indicates that the conformation of polymer chains is arc-like and extended. When εmincreases to 1.5,P(ro)is zero for ro≤0.6,whereas P(ro)increases quickly and then almost keeps the same in the range of 0.8<ro<0.9. Combining with the above analysis,we can infer that the conformation of polymer chains is also toroid at εm=1.5. As εmincreases further to 5.0,P(ro)exhibits a Gaussian distribution in the whole range of ro,and there are the compact conformations. The main reason is that the self-attractive energy takes the dominant role in competition with the bending energy and the self-attractive interaction.
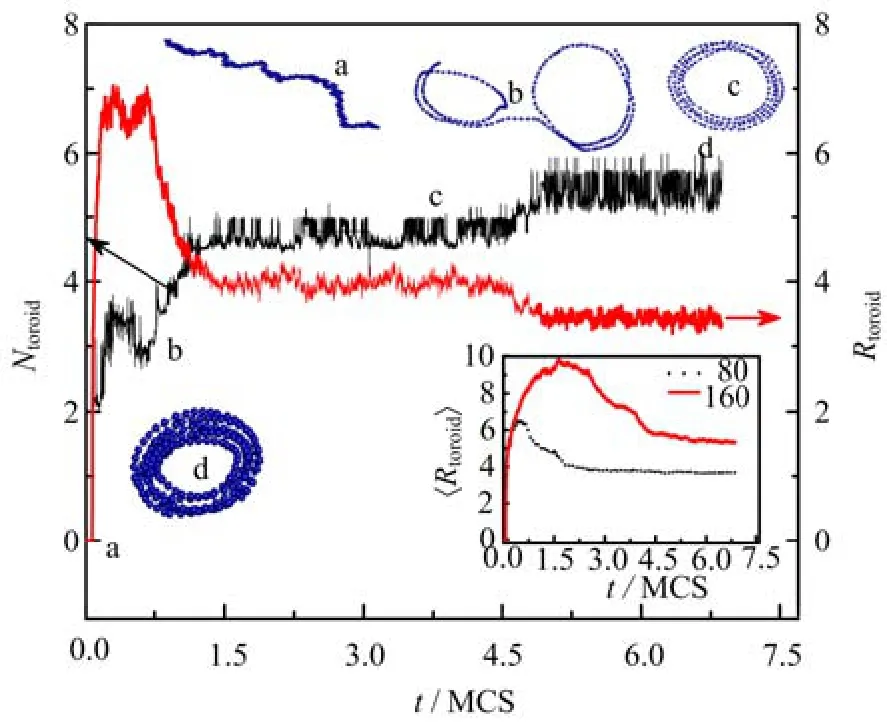
FIG. 5 The number of toroids Ntoroidand the radius of toroids Rtoroidas a function of time t in one typical simulation run with b=80. The inset figure showing the time evolution of the average radius of toroids〈Rtoroid〉with different chain rigidities. Here εm=1.25.
The dynamic behavior of self-attractive semiflexible chains is shown in Fig.5,and there are three plateaus for both number of toroids Ntoroidand radius of toroids Rtoroidas a function of time. It indicates that the chain experiences three structural adjustments. The initial conformation is an expanded chain,and there is no contact between monomers. Several separated toroids with the large size of toroids are formed at the first stage,and the number of toroids is about 3(Fig.5). In the second plateau,the loose toroids with the same center are formed,and at the last stage,the compact toroids with the smaller radius are formed and the number of toroidsincreases to 6. The inset figure shows the average radius of toroids〈Rtoroid〉of chains with two chain rigidities of b=80 and 160 at εm=1.25. Here〈Rtoroid〉is the average value over hundred runs at the same time,and represents the statistical property of the toroid size,which is different from the value of Rtoroidin Fig.5 because Rtoroidonly represents one random run. The〈Rtoroid〉increases at the beginning of simulation,then decreases and reaches a plateau for both b=80 and 160. It indicates that the toroid enlarges firstly,then the toroid structure becomes more and more compact.
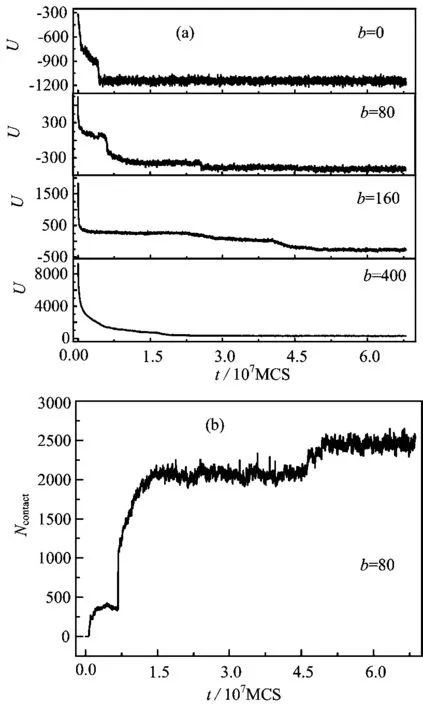
FIG. 6 (a)Time evolution of total energy U and(b)total number of contacts Ncontactwith different chain rigidities.
The folding process of toroid structure is studied further,and Fig.6(a)shows time evolution of the total energy U. Here the total energy U contains bond energy,Lennard-Jones potential and bending potential. The fact that the time evolution of U for b=80 and 160 is different from the case for b=0 and 400 can indicate that the folding process of self-attractive semiflexible chains with b=80 and 160 are slower than these for flexible chains(i.e.,b=0)and rigid chains(i.e.,b=400)because U decreases abruptly for the flexible chains and the rigid chains. For self-attractive semiflexible chains,the attractive interactions between monomers in polymer chains are more important. In the initial structures of the expanded chains,there are only a few contacts at t<7.5×10⁶MCS,see Fig.6(b). Here we define that a contact is formed when the space separation between i-th and j-th monomers is within 2.5σmfor |i-j|≥3. Figure 6(b)shows the time evolution of the number of contacts Ncontact for εm=1.25 and b=80,and three plateaus are observed. Ncontactexperiences a sharp increase from first plateau to second plateau. In fact,the second plateau corresponds to the loose toroid structure and the third plateau indicates the compact toroid structure.

FIG. 7 A series of snapshots for a semiflexible chain with b=80 in the contact map space. Here εm=1.25.(a)t=6.8×10⁵MCS,(b)t=1.0×10⁷MCS,(c)t=4.0×10⁷MCS,and(d)t=6.0×10⁸MCS.
In addition,we follow the monomer contact evolution over time to analyze the conformational dynamics of a chain. Contact maps represent intermonomer threedimensional connectivity profiles in a two-dimensional map(see Fig.7). The algorithm for generating a contact map for a given set of coordinates of all chain units is simple:for each consecutive monomer we list all other monomers that are within the chosen contact distance. Obviously,the choice of this distance(i.e.,2.5σm)is somewhat arbitrary. There are few contacts at t=6.8×10⁵MCS,which locates at i=140-149 and j=158-168. Using the contact map analysis,we can identify a very regular pattern that resembles several parallel lines. Further,the analysis reveals that each line represents a toroid,which is different from the antiparallel hairpin structure for a very weak chain rigidity (the chain persistence length is lp=10σm)[11]. The fact that the distance between two parallel lines decreases indicates that two parallel toroids move together gradually.
Based on the above results,the chain rigidity b and the attractive interactions εmhave great influence on the conformation of self-attractive polymer chains. The structural behaviors are summarized in the phase dia-gram shown in Fig.8. There are three kinds of conformations:rod-like structure,toroid structure,and coil structure. For semiflexible chains with the moderate values of b,semiflexible chains will experience three phase transitions:the first transition occurs from the extended conformation to the isolated toroids,and the second transition is from isolated toroids to loose ones,and the third transition occurs from loose toroids to compact ones. Of course,for the weak chain rigidity b,there are other conformations such as solid globular and random rodlike[13].
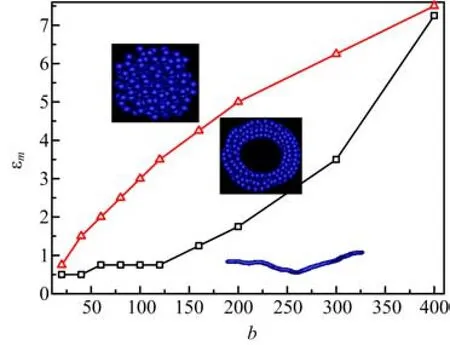
FIG. 8 Phase diagram as a function of bending energy b and self-attractive energy εm. The insets indicate the conformation of polymer in the regime of b and εm. The two lines indicate the phase transition point.
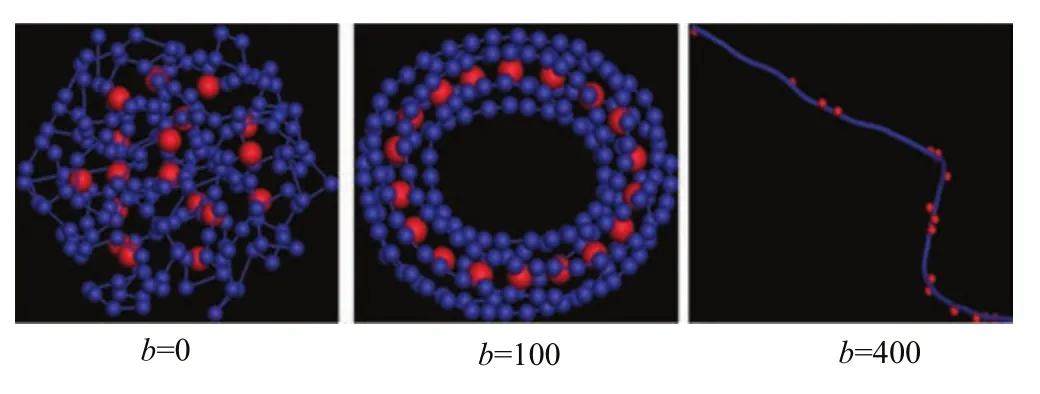
FIG. 9 The typical simulation snapshots of polymernanoparticle composites with different chain rigidities.
B. Controlling the spatial distribution of NPs in nanocomposites by chain rigidity
Here we focus on the ability of polymer chain stiffness to control the structures of small numbers of NPs in nanocomposites. For self-attractive flexible chains,NPs are aggregated uniformly within the self-attractive flexible chains. However,the results in Fig.9 show that the degree of dense spherical packing for NPs in selfattractive flexible chains is weaker than that in flexible chains without self-attractive interaction[21]. The reason may be that the self-attractive flexible chains are more compact than the flexible chains because there are strong intro-interactions between monomers of selfattractive polymer chains. The spatial distribution of NPs in flexible chains without self-attraction interactions is dense spherical packing to share the maximum number of bridging monomers between neighbors and to minimize the binding energy for the minimum entropy cost[21]. For a moderate polymer energy of b=100,the structure of NPs is the toroid aggregation,which is also different from the linear contact aggregation of NPs in semi-flexible chains without self-attractive interactions [21]. For a rigid chain with b=400,the arrangements of NPs are dispersed along the stretched polymer chain (see Fig.9),which is consistent with the structures in rigid chains without self-attractive interactions. Therefore,the spatial distribution of NPs in nanocomposites can be controlled well by polymer chains.
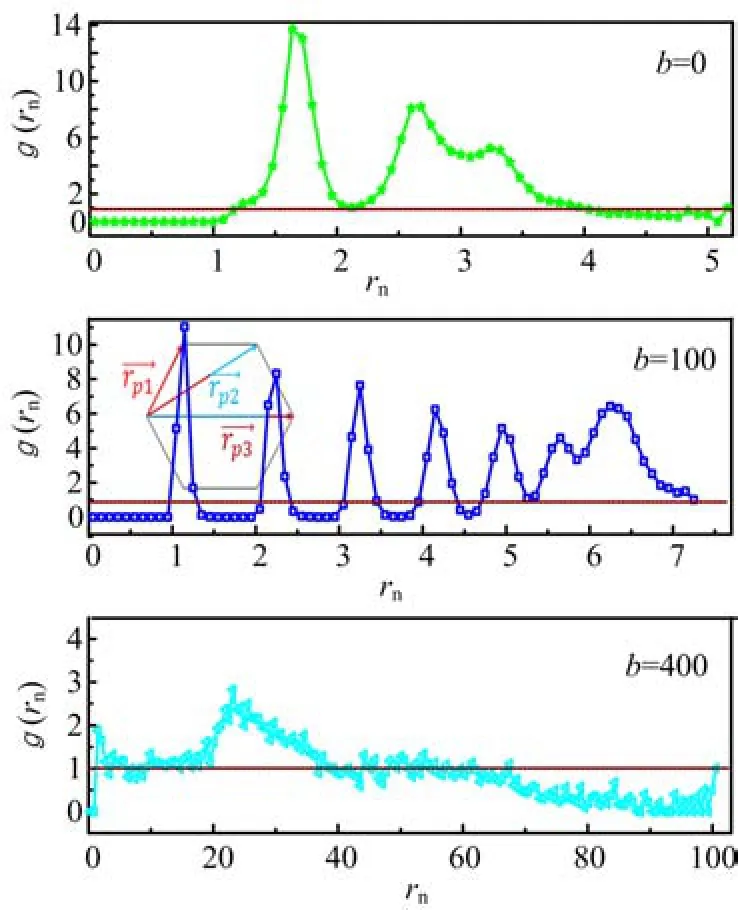
FIG. 10 The pair correlation function g(rn)as a function of the distance rnbetween two nanoparticles with different chain rigidites b=0,100,and 400.
To further identify that self-attractive semiflexible polymers can induce the NPs to form the ordered structures,we calculate the pair correlation function g(rn)as a function of the distance rnbetween two nanoparticles and the results are shown in Fig.10. If there are some peaks in the curves of g(rn),it shows that the structures of NPs are ordered. In Fig.10,the pair correlation function g(rn)for b=0 shows an obvious peak located at rn=1.64 as well as the second and third peaks located at rn=2.68 and 3.30. In fact,the second and third peaks almost merge together. The fact that the first peak is located at rn=1.64 means that the NPs aggregates together simply because the diameter of NPs is σn=1.5σm. For self-attractive semiflexible chains with b=100,there are 5 obvious peaks,which are located at σn=1.15,2.25,3.25,4.15,and 4.95. This means that the distributions of NPs in nanocomposites are very ordered. Based on the fact that the distance between two neigbouring peaks isn't the same,and the distance decreases from rn=1.1 between the first and second peaks to rn=0.8 between the fourth and fifth peaks,we canknow the spatial distributions of NPs are toroid. The inset figure shows the reason why the distance between neighbouring peaks decreases. Based on the statistical properties of pair correlation function g(rn)in Fig.8,we can know clearly that the spatial arrangements of NPs in nanocomposites are toroid,which is different from the NPs in semiflexible polymer chains without selfattractive interactions[21]. For b=400,there is only one peak with a very small value of 2.5,and most of them are close to unity. Therefore,we can know that the conformation of nanoparticles is wholly disordered.

FIG. 11 Average probability distribution P(r′)of nanoparticles as a function of the relative distance r′of nanoparticle to the center of mass of nanoparticles with different chain rigidites b=0,100,and 400.
To know the spatial arrangement of nanoparticles in nanocomposites further,the average probability distribution P(r′)of nanoparticles is calculated,and the results are shown in Fig.11.

where rpis the distance of nanoparticle to the center of mass of the nanoparticles,and the rmaxis the largest one. For b=0,the P(r′)exhibits a Gaussian distribution with a long left skewed tail,and the conformation of NPs in self-attractive flexible chains/nanoparticle nanocomposites is compact. For b=100,P(r′)is close to 0 for r′<0.85,and all nanoparticles are far away from their center of mass. Combining with the pair correlation function g(rn)and the average probability distribution P(r′),we can know clearly that the spatial distributions of NPs in nanocomposites indeed is toroid. For b=400,P(r′)is almost the same in the whole regime of r′,and this indicates that the nanoparticles are randomly distributed.
IV. CONCLUSION
By employing dynamic Monte Carlo simulations,we investigate the folding process of self-attractive semiflexible polymers as well as the conformations of NPs in self-attractive semiflexible chain/nanoparticle nanocomposites. A three-stage process of toroid formation for self-attractive semiflexible chains is shown:(i)isolated toroids,(ii)loose toroids,and(iii)compact toroids. The self-attractive semiflexible chains undergo one transition from several isolated toroids to loose toroids with the same mass center,and another transition from loose toroids with large size to compact toroids with small size. The conformations of selfattractive polymer chains depend on bending energy b and self-attractive energy εm. At the same time,the spatial distributions of NPs in nanocomposites can be controlled easily by varying the bending energy of selfattractive semiflexible chains. A special spatial distribution of toroid structure of NPs is obtained in selfattractive flexible chain/nanoparticle nanocomposites. This investigation can help to develop novel materials in the nanotechnology field.
V. ACKNOWLEDGMENTS
This work was supported by the National Natural Science Foundation of China(No.21304039,No.21374102,and No.21174131).
[1]A. Halperin and E. Zhulina,Europhys. Lett. 15,417 (1991).
[2]A. Buguin and F. BrochardWyart,Macromolecules 29,4937(1996).
[3]A. Alexander-Katz,M. F. Schneider,S. W. Schneider,A. Wixforth,and R. R. Netz,Phys. Rev. Lett. 97,138101(2006).
[4]A. Alexander-Katz and R. Netz,Macromolecules 41,3363(2008).
[5]I. Baeza,P. Gariglio,L. M. Rangel,P. Chavez,L. Cervantes,C. Arguello,C. Wong,and C. Montanez,Biochemistry 26,6387(1987).
[6]A. Martin,M. Davies,B. Rackstraw,C. Roberts,S. Stolnik,S. Tendler,and P. Williams,FEBS Lett. 480,106(2000).
[7]A. Montesi,M. Pasquali,and F. C. MacKintosh,Phys. Rev. E 69,021916(2004).
[8]B. Schnurr,F. MacKintosh,and D. Williams,Europhys. Lett. 51,279(2000).
[9]A. Lappala and E. M. Terentjev,Macromolecules 46,7125(2013).
[10]H. Noguchi,S. Saito,S. Kidoaki,and K. Yoshikawa,Chem. Phys. Lett. 261,527(1996).
[11]A. Lappala and E. M. Terentjev,Macromolecules 46,1239(2013).
[12]M. Q. Kong,I. S. Dalal,G. X. Li,and R. G. Larson,Macromolecules 47,1497(2014).
[13]D. T. Seaton,S. Schnabel,D. P. Landau,and M. Bachmann,Phys. Rev. Lett. 110,028103(2013).
[14]A. L. Martin,M. C. Davies,B. J. Rackstraw,C. J. Roberts,S. Stolnik,S. J. B. Tendler,and P. M. Willians,FEBS Lett. 480,106(2000).
[15]D. T. Hung,L. J. Marton,D. F. Deen,and R. H. Shafer,Science 221,368(1983).
[16]J. Jancar,J. F. Douglas,F. W. Starr,S. K. Kumar,P. Cassagnau,A. J. Lesser,S. S. Sternstein,and M. J. Buehler,Polymer 51,3321(2010).
[17]H. Zou,S. Wu,and J. Shen,Chem. Rev. 108,3893 (2008).
[18]R. Chapman and P. Mulvaney,Chem. Phys. Lett. 349,358(2001).
[19]O. Wilson,G. J. Wilson,and P. Mulvaney,Adv. Mater. 14,1000(2002).
[20]P. J. Yoon,T. D. Fornes,and D. R. Paul,Polymer 43,6727(2002).
[21]D. Zhang and L. X. Zhang,Soft Matter 10,7661(2014).
[22]V. N. Manoharan,M. T. Elsesser,and D. J. Pine,Science 301,283(2003).
[23]J. P. K. Doye,A. A. Louis,I. C. Lin,L. R. Allen,E. G. Noya,A. W. Wilber,H. C. Kok,and R. Lyus,Phys. Chem. Chem. Phys. 9,2197(2007).
[24]A. A. Zinchenko,T. Sakaue,S. Araki,K. Yoshikawa,and D. Baigl,J. Phys. Chem. B 111,3019(2007).
[25]G. Meng,N. Arkus,M. P. Brenner,and V. N. Manoharan,Science 327,560(2010).
[26]P. Cifra,J. Chem. Phys. 131,224903(2009).
[27]S. J. Srebnik,Polym. Sci. Part. B 46,2711(2008).
[28]Z. Y. Yang,D. Zhang,L. X. Zhang,C. H. Chen,A. U. Rehaman,and H. J. Liang,Soft Matter 7,6836(2011).
[29]Y. Liu and B. Chakraborty,Phys. Biol. 5,026004 (2008).
[30]G. Morrision and D. Thirumalai,Phys. Rev. E 79,011924(2009).
DOI:10.1063/1674-0068/29/cjcp1511231
杂志排行
CHINESE JOURNAL OF CHEMICAL PHYSICS的其它文章
- Impact of Eu3+Ions on Physical and Optical Properties of Li2O-Na2O-B2O3Glass
- Investigation of Ultrafast Electronic Transfer Process on Organic/Inorganic Heterojunction by Femtosecond Transient Absorption
- Virtual Screening of Human O-GlcNAc Transferase Inhibitors
- Morphology and Growth Process of Bat-like ZnO Crystals by Thermal Evaporation
- Epitaxial Growth and Thermoelectric Measurement of Bi2Te3/Sb Superlattice Nanowires
- Controlled Synthesis of PCL/PVP Copolymer by RAFT Method and Its Hydrophilic Block-Dependent Micellar Behaviors
