添加糖蜜对虾蟹混养系统水体细菌群落结构的影响❋
2016-06-16田相利董双林高明亮班文波张庆起
李 杰, 田相利, 董双林, 高明亮, 张 凯, 奉 杰, 班文波, 张庆起
(1.中国海洋大学海水养殖教育部重点实验室,山东 青岛 266003;2.连云港市赣榆区海洋渔业技术指导站,江苏 连云港 222100)
添加糖蜜对虾蟹混养系统水体细菌群落结构的影响❋
李杰1, 田相利1❋❋, 董双林1, 高明亮1, 张凯1, 奉杰1, 班文波1, 张庆起2
(1.中国海洋大学海水养殖教育部重点实验室,山东 青岛 266003;2.连云港市赣榆区海洋渔业技术指导站,江苏 连云港 222100)
摘要:为探讨养殖水体中细菌群落结构与不同环境因子的关系。本文通过添加糖蜜将外源添加物的(饵料和糖蜜)C/N调整为10、15、20和25四个不同水平(分别为C1、C2、C3和C4组),以投喂基础饲料作为对照组(C0)。利用PCR-DGGE技术和冗余分析方法(RDA),分析了添加糖蜜对虾蟹混养系统水体中细菌群落结构的影响。研究表明:虾蟹混养池塘水体中细菌菌群主要由放线菌纲、蓝藻纲、α-变形菌纲、β-变形菌纲、γ-变形菌纲、δ-变形菌纲、ε-变形菌纲、拟杆菌纲和芽孢杆菌纲组成。C1、C2、C3和C4四个处理组的细菌群落结构相似,与C0组差异显著。各处理组的优势菌群相似,其相对含量存在一定差异,放线菌纲在整个养殖过程中占据优势地位。与对照组相比,实验组细菌群落的多样性随养殖时间的延长明显增加,于8月检测到γ-变形菌纲,于9月检测到ε-变形菌纲和芽孢杆菌纲。各处理组相比较,Pielou均匀度指数变化不明显,Shannon-Winener指数随C/N水平的升高呈先上升后下降的趋势,在养殖后期,C2处理组的Shannon-Winener指数明显高于其它处理组,C4处理组最低。RDA分析表明,虾蟹混养系统水体中菌群结构的变化是多种环境因子综合作用的结果。影响细菌群落多样性的主要环境因子的重要性在7月为TOC>-N,在8月为P,在9月为-N>pH>TN>TOC。综合水质指标、菌群结构和多样性分析结果表明:调控外源添加物C/N为15时,水体细菌群落多样性高、组成差异小、结构稳定,有利于虾蟹混养系统的水质条件优化。
关键词:虾蟹混养;水体;环境因子;PCR-DGGE;C/N;冗余分析;细菌群落;多样性指数
引用格式:李杰,田相利,董双林,等. 添加糖蜜对虾蟹混养系统水体细菌群落结构的影响[J].中国海洋大学学报(自然科学版), 2016, 46(5): 38-49.
LI Jie, TIAN Xiang-Li, DONG Shuang-Lin, et al. Effect of molasses addition on microbial community structure in the polyculture system ofPortunustrituberculatusandLitopenaeusvannamei[J]. Periodical of Ocean University of China, 2016, 46(5): 38-49.
生物絮团是水体中的藻类、异养微生物、原生动物与残饵等形成的团絮状有机碎屑[1]。水体中的残饵及氨氮、亚硝氮等有毒物质可以通过生物絮团被异养微生物和藻类利用,从而有效改善水质[2]。同时,絮团可以被部分养殖动物摄食,实现饵料的多重利用,从而显著提高养殖生物的生长特性,节约生产成本[3-4]。另外,有研究表明生物絮团还能够在一定程度上抑制病原菌,提高动物的免疫力[5]。因此,生物絮团技术在养殖中的应用越来越受到人们的关注,其技术的核心是通过调节合适的水体碳氮比,从而人为控制生物絮团的形成[4]。Avnimelech通过计算得出当饲料中C/N=15.75时,可以促进微生物合成菌体蛋白,并有效去除养殖水体氨氮和亚硝酸盐氮[6]。当水体C/N水平为10~20时,有利于异养菌的繁殖,对絮团的形成起到促进作用[7-8]。
目前,生物絮团技术作为一种改善养殖水体环境的重要手段已在国内外水产养殖中得到广泛应用,但对该技术的研究多集中于凡纳滨对虾(Litopenaeusvannamei)、罗氏沼虾(Macrobrachiumrosenbergii)、日本囊对虾(Penaeusjaponicus)和罗非鱼(Tilapia)等水产动物的单一养殖模式中[1-2,9-10],对其在混养模式中的应用研究较为缺乏。三疣梭子蟹(Portunustrituberculatus)是中国大型的海产经济蟹类之一,其与凡纳滨对虾的混合养殖是中国沿海地区水产养殖的重要模式之一[11],迄今未见生物絮团技术对该养殖模式中细菌群落结构等的影响。
变性梯度凝胶电泳(DGGE)是在基因水平上,通过分析DNA分子的种类和数量来鉴定微生物种群结构特征的一种现代分子生物学技术[12],具有操作简单、重复性好和分析样品量大等优点。1993年Muyzer首次利用该技术分析了生态环境中细菌群落的多样性,目前该技术在对海洋微生物的研究中已得到广泛应用[13]。例如,傅莲英采用PCR-DGGE技术分析虾蟹养殖水体及沉积物中细菌群落多样性的变化[14]。Petri等应用该技术研究了西波罗的海海冰垂直成层结构中细菌群落的遗传多样性[15]。通过控制水体C/N水平调控水体细菌等微生物的组成和功能,是生物絮团技术的核心之一[2,6]。本研究利用PCR-DGGE技术和冗余分析(RDA)等方法,分析了通过添加糖蜜调控外源添加物不同C/N水平对虾蟹混养系统中水体细菌群落结构的变化,探讨了不同环境因子对细菌群落结构的影响,以期从微生物学角度为通过C/N调控养殖水体水质技术提供一定的理论依据。
1材料与方法
1.1实验池塘与围隔
本研究于2013年7—10月在江苏省赣榆县佳信水产开发有限公司海水养殖池塘中进行。实验池塘为泥沙质底。实验采用海水池塘陆基围隔实验法进行,其中围隔由支架和围隔幔构成,以木桩、竹竿等为支架,以高密度聚乙烯编织布为围隔幔,架设于池塘中,面积为5m×5m,围隔的初始条件一致,围隔与围隔之间是完全独立的,且无水的交流,其具体结构参见文献[16]。实验期间,养殖水体利用充气泵进行连续充气。
1.2 实验设计与管理
1.2.1 实验设计实验设置了5个不同处理组,每组3个平行。各处理组通过添加糖蜜调控其C/N水平,分别设置为10(C1)、15(C2)、20(C3)和25(C4),以不添加糖蜜组作为对照(C0,C/N在3.35~5.16之间),详见表1。本实验中的C/N指外源添加物(饵料和糖蜜)的碳元素与氮元素的质量比。
实验围隔中均放养三疣梭子蟹密度为6ind/m2,放养凡纳滨对虾密度为45ind/m2。实验用三疣梭子蟹苗及凡纳滨对虾皆购自连云港赣榆佳信水产开发有限公司。三疣梭子蟹放养时平均甲宽(1.71±0.21)cm,平均甲长(0.88±0.10)cm,平均体重(0.29±0.03) g。凡纳滨对虾放养时体长(1.76±0.44)cm,平均体重(0.12±0.03)g。三疣梭子蟹和凡纳滨对虾于2013年7月13日放养,于10月12日收获完毕。
根据Avnimelech总结的生物絮团养殖系统的C/N调控公式[6],并根据饵料投喂量调整不同实验组糖蜜的添加量。糖蜜添加计算公式为:
C/N=(ΔCH×C1%+Feed×C2%)/(Feed×N%)。
式中:ΔCH为糖蜜添加量;C1%为糖蜜中有机碳含量;Feed为投饵量;N%为饵料中N的含量。
三疣梭子蟹饵料选用鲜活蓝蛤(壳肉比为3.27,含水率为78.29%,含碳量32.78%,含氮量9.76%);凡纳滨对虾选用连云港正大农牧有限公司生产的对虾配合饲料(含水率7.00%,含碳量34.65%,含氮量6.72%)。添加碳源为购于山东寿光某公司的糖蜜(总有机碳含量28.91%)。
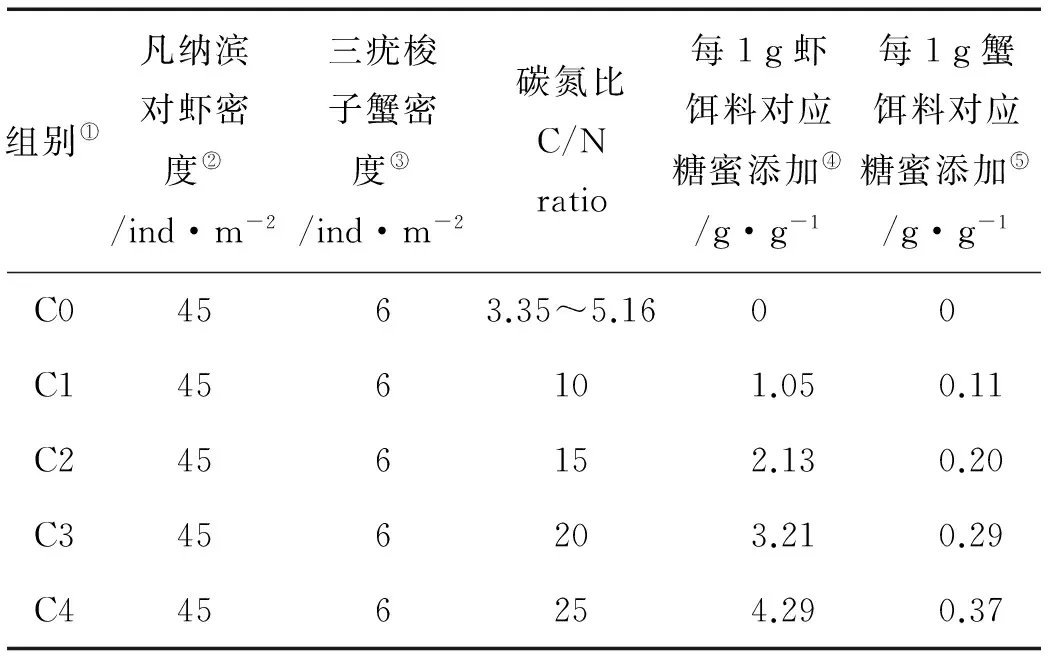
表1 实验设计及糖蜜添加
Note:①Treatments; ②Stocking density of Litopenaeus vannamei; ③Stocking density of Portunus trituberculatus; ④Molasses addition to shrimp feed; ⑤Molasses addition to creep feed
1.2.2 实验管理鲜活蓝蛤每日18:00—19:00投喂1次,投喂量参照周演根等[11]。对虾饲料每天投喂2次,投喂时间为7:00—8:00与18:00—19:00。每7d检查生长,根据虾蟹生长情况调整饵料投喂量。
养殖期间围隔不换水,仅补充因蒸发与渗漏造成的损失,水深保持在1.2~1.4m之间。7月底开始使用增氧机充氧。每晚10:00至次日清晨6:00充气,晴天下午2:00—4:00充气,并根据天气状况调整。随着饵料投喂量与糖蜜添加量的增加,生物絮团逐步形成后调整成全天24h连续充氧。
糖蜜根据投饵量随时调整,充分溶解后泼洒,每2h泼洒1次,天气状况不好不泼洒。
1.3 实验样品的采集与预处理
实验于2013年7—9月开展。每月下旬,用采水器在实验围隔的3个固定点、水深为0.5m左右处分别采集1000mL水样,置于无菌的聚乙烯瓶中。待静置30min后,经800目筛绢过滤,0.22μm抽滤后,滤膜置于无菌EP管中,于-80℃超低冰箱中保存待测,水样立即用于水质指标(总氨氮、亚硝酸盐、硝酸盐、总氮、活性磷、总磷和总有机碳)的测定。
1.4 日常水质指标测定

1.5 变形梯度凝胶电泳DGGE
1.5.1 DGGE凝胶电泳采用CTAB化学法提取水体总DNA,以总DNA为模板,对细菌16SrDNA的特异性片段V3区进行PCR扩增,特异性扩增引物为GC-341f和534r。PCR反应体系(50μL)为:2×Taq Master Mix25μL,DNA模板2μL,上下游引物各1μL,ddH2O 21μL。以DNA maker-2000为标准,检测PCR扩增片段在1%的琼脂糖凝胶的位置。将PCR扩增产物置于聚丙烯酰胺凝胶(变行剂梯度为40%~65%)的点样孔内,在1×TAE的缓冲液中进行电泳(时间为16h),然后将凝胶置于5μg/mL的溴化乙锭溶液中进行避光染色,蒸馏水漂洗后用凝胶成像系统对凝胶进行拍照分析。
1.5.2 DGGE条带的切割、回收、克隆、转化和测序在紫外灯照射下切割DGGE泳道上较亮的特征条带,置于50μL的ddH2O中,4℃过夜。选用Zymoclean凝胶回收试剂盒纯化回收优势条带的DNA。将回收纯化的DNA连接到pEASYT1载体上进行克隆,然后将连接产物导入Transl-T1感受态细胞中完成DNA的转化。在LB培养基上挑取白色的阳性克隆产物,通过载体通用引物M13F/R进行检测,然后在测序公司完成测序。
1.6 数据处理与统计分析
采用BIO-RAD公司的Quantity One4.6.1软件对DGGE电泳图谱进行数据处理和分析。采用BLAST软件找出与目的基因同源相似性高的序列。系统发育树的建立采用MEGA6.3软件。分别用香农维纳指数(H′)和Pielou指数(J)来评价细菌群落的多样性和均匀度。
计算公式为:H′=-∑PilnPi;
J=H′/lnS。
式中:Pi为第i条带的灰度占该样品总灰度的比率;S为样品所有条带的总数目。
采用SPSS17.0对实验数据进行统计分析。以P<0.05作为差异显著水平。运用生物统计学软件CANOCO4.5将数字化的DGGE指纹图谱和环境因子相结合,完成冗余分析(RDA)。
2结果
2.1 虾蟹混养系统水体中环境因子指标

2.2 水体细菌群落的结构特征
图1为水体细菌群落结构的DGGE指纹图谱。结果表明,7月各个处理组含有的共性条带数量最多,条带数目及停留位置均差异不大,表明7月水体细菌群落结构特征相似。而8、9月代表不同处理组的条带在电泳图谱组中数量、停留位置均出现差异,各处理组既含共性条带,也含特异性条带,而9月位于同一位置的条带亮度也出现不同程度的变化,说明细菌菌群在DNA分子水平上可能发生了变化。从整个养殖实验来看,C0和C4组含有的条带数目较少,C1~C3组含有条带数目较多,其中C3组8月最多,条带数目为30、29、29,C2组9月最多,条带数目为34、35、35,而C4组最少,条带数目为28、27、24。综合以上结果,各处理组间的细菌类型仍存在一定相似性,但随着养殖时间的推移,不同C/N水平下细菌群落结构特征差异越来越显著。
对水体DGGE指纹图谱中可辨认的条带进行切割、回收测序,获得阳性克隆序列为:7月21条,8月26条,9月25条,大小均在169~196bp之间。测序结果在GenBank数据库中进行检索并进行BLAST分析,结果表明切胶序列与已知物种序列具有极高的相似度(98%~100%)。根据测序结果构建的水体菌群系统发育树见图2。结果表明,7月水体细菌的优势菌群主要归属于7个纲:放线菌纲(Actinobacteria)、蓝藻纲(Cyanobacteria)、α-变形菌纲(Alphaproteobacteria)、β-变形菌纲(Betaproteobacteria)、γ-变形菌纲(Gammaproteobacteria)、δ-变形菌纲(Deltaproteobacteria)和拟杆菌纲(Bacteroidetes)。其中,放线菌纲条带数目在C1组分布最多,C3组条带数目最多为α-变形菌纲,而C4组的蓝藻纲条带数目最多。8月水体细菌优势菌群主要归属于5个纲:放线菌纲、蓝藻纲、α-变形菌纲、γ-变形菌纲(条带数目最少,仅为1条,且只在实验组出现)和拟杆菌纲,其中,放线菌纲条带数目在C1组分布最多,C4组的蓝藻纲条带数目最多,拟杆菌纲的条带数目在各个处理组中分布均匀。9月水体细菌的主要优势菌群归属于放线菌纲、蓝藻纲、α-变形菌纲、γ-变形菌纲、δ-变形菌纲、ε-变形菌纲(Epsilonproteobacteria)、芽孢杆菌纲(Bacilli)和拟杆菌纲等9个纲。其中C2组含有的放线菌群条带数目最多,拟杆菌纲在C0和C1数目较多,8月未检测到的δ-变形菌纲在9月重新出现。
2.3水体细菌群落的相对丰度
图3为水体细菌群落的相对丰度图。结果显示,随着养殖的进行,各处理组水体细菌群落的相对丰度出现差异,优势菌群发生变化。其中,7月各处理组的优势菌群为放线菌纲、α-变形菌纲和蓝藻纲,相对含量分别在13.11%~32.28%、10.22%~21.32%和10.02%~23.85%间,而β-变形菌纲、γ-变形菌纲、δ-变形菌纲和拟杆菌纲在各处理组中含量均较低,其中γ-变形菌纲仅在C4组出现。8月C0、C1、C2和C3中的优势菌群为放线菌纲,相对含量分别是30.55%、27.79%、27.89%和29.34%,其次是蓝藻纲,而C4组的优势菌群是蓝藻纲,相对含量是28.82%,其次是放线菌纲。γ-变形菌纲仅在C0~C4调控组被检测到,其他种类的细菌含量以C1最高,相对含量达到26.81%,说明C1组优势菌群相对含量较低。在9月,放线菌纲是各处理组优势菌群,相对含量分别为34.94%、40.87%、37.06%、36.73%和39.26%,其中,C0的相对含量最低,而C1与C2组不含δ-变形菌纲。总体上看,芽孢杆纲和ε-变形菌纲为9月新出现菌群,且只在各C/N调控组出现,而β-变形菌纲仅出现在7月。综合以上可以看出,不同C/N水平下水体细菌的优势菌群及其含量出现差异,表明细菌群落结构发生了变化。
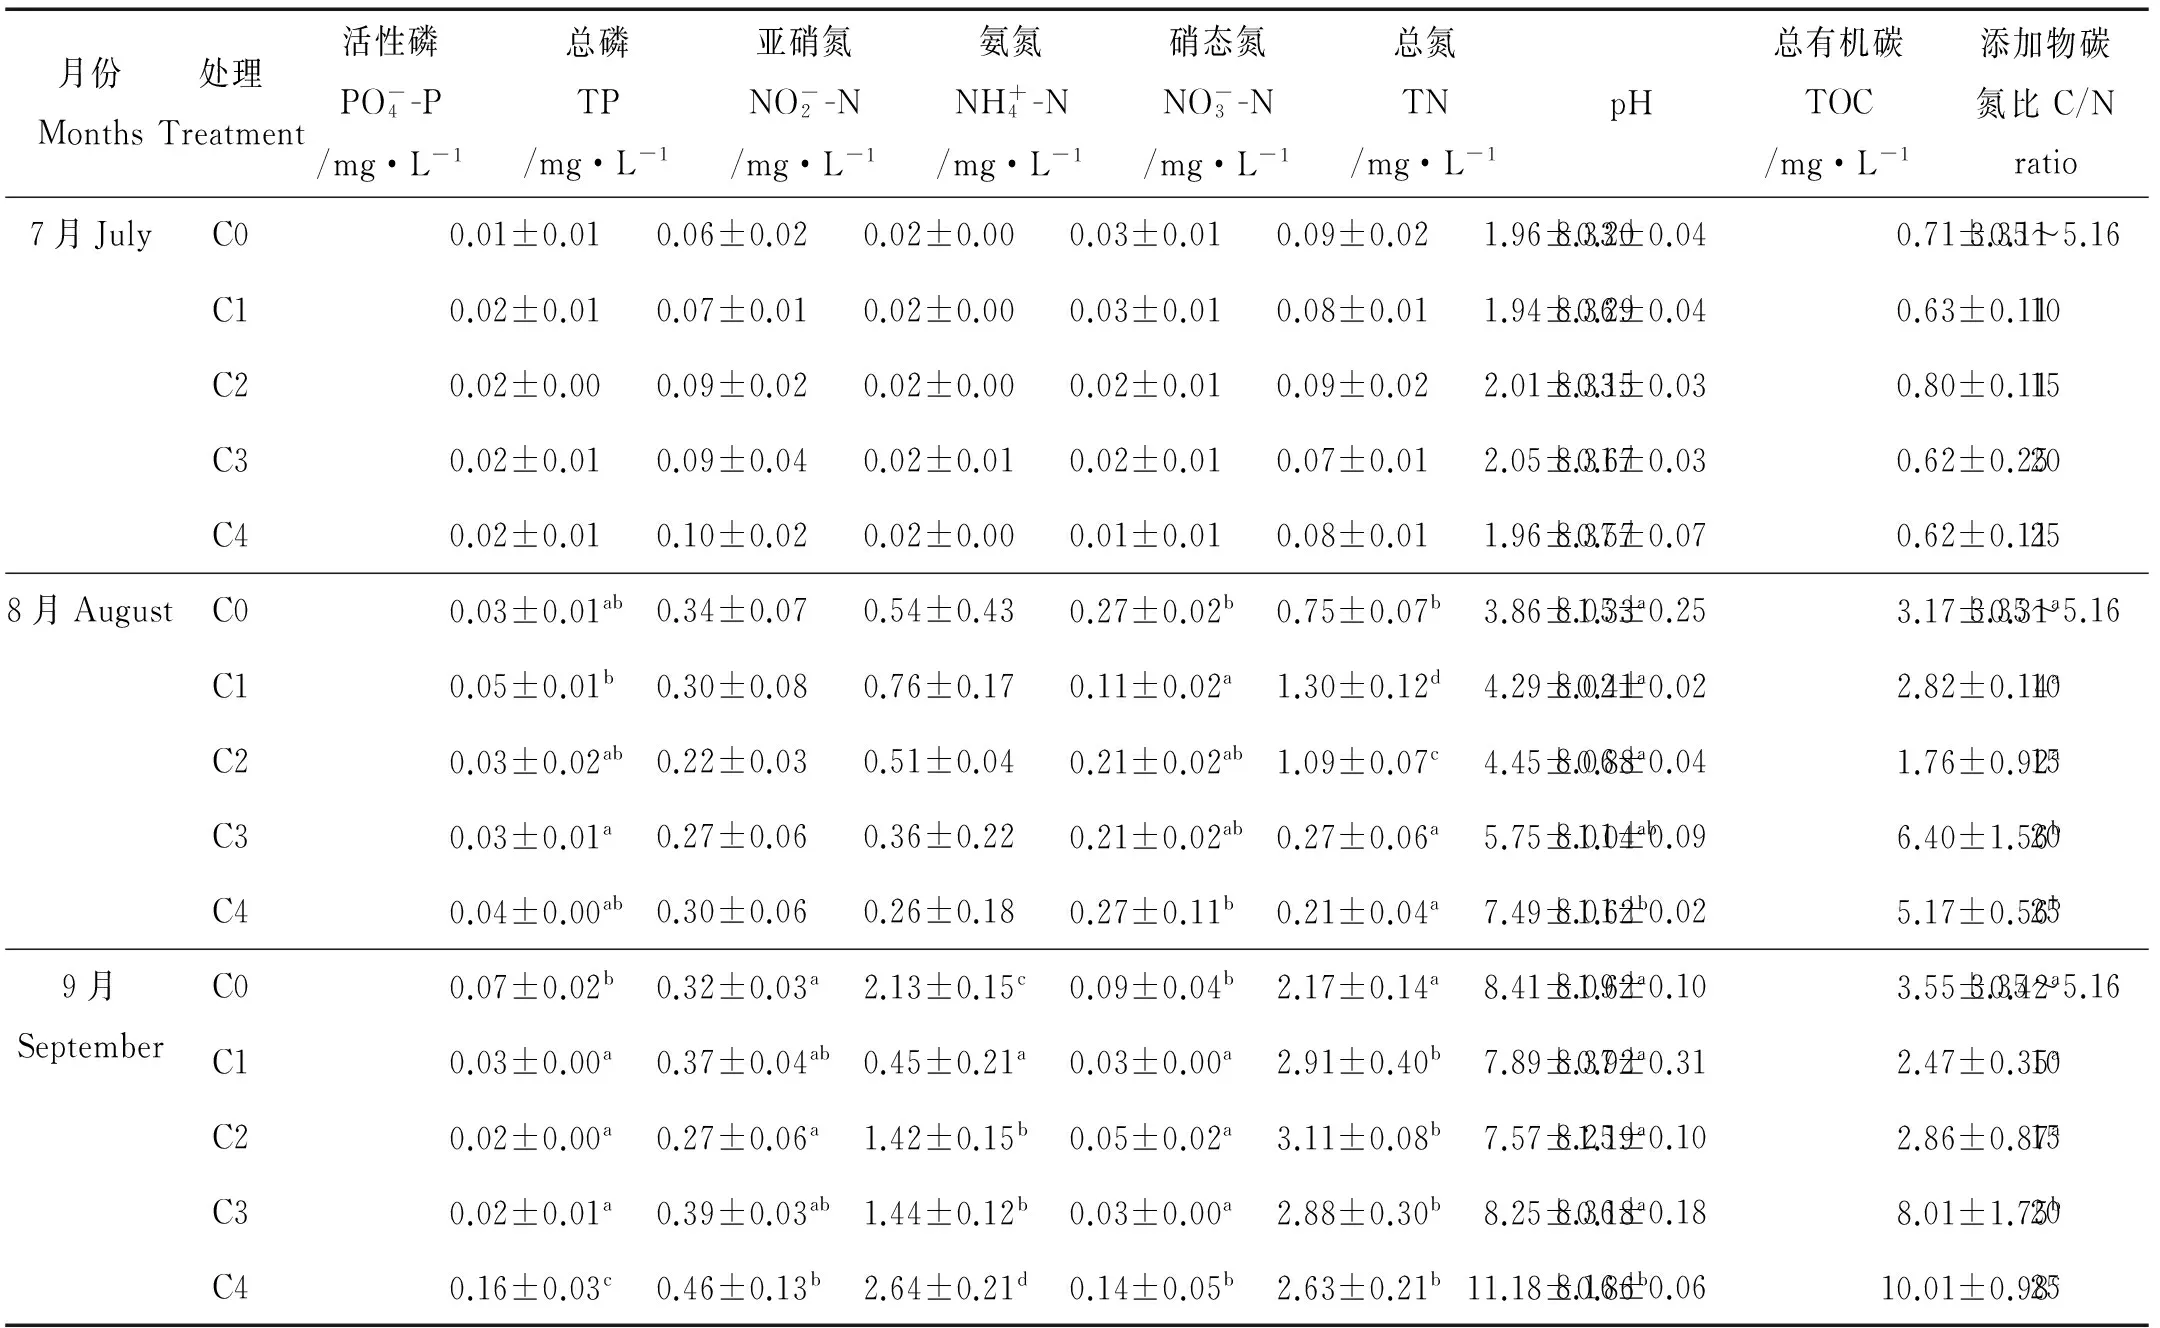
表2 不同C/N水平的水体环境因子指标
注:表中同一列中标注的不同字母表示每月各数据之间差异显著(P<0.05)。
Note:Data in the same column with different superscripts are significantly different in the same month (P<0.05).
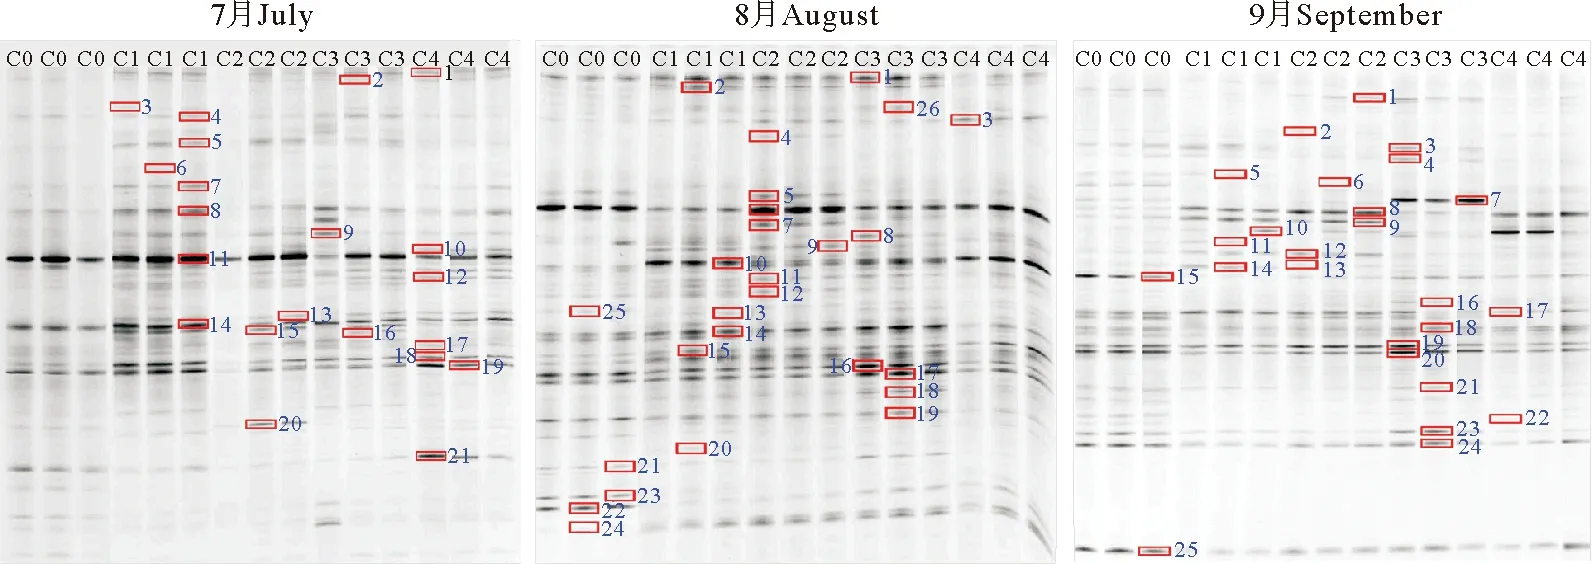
图1 水体细菌群落DGGE指纹图谱

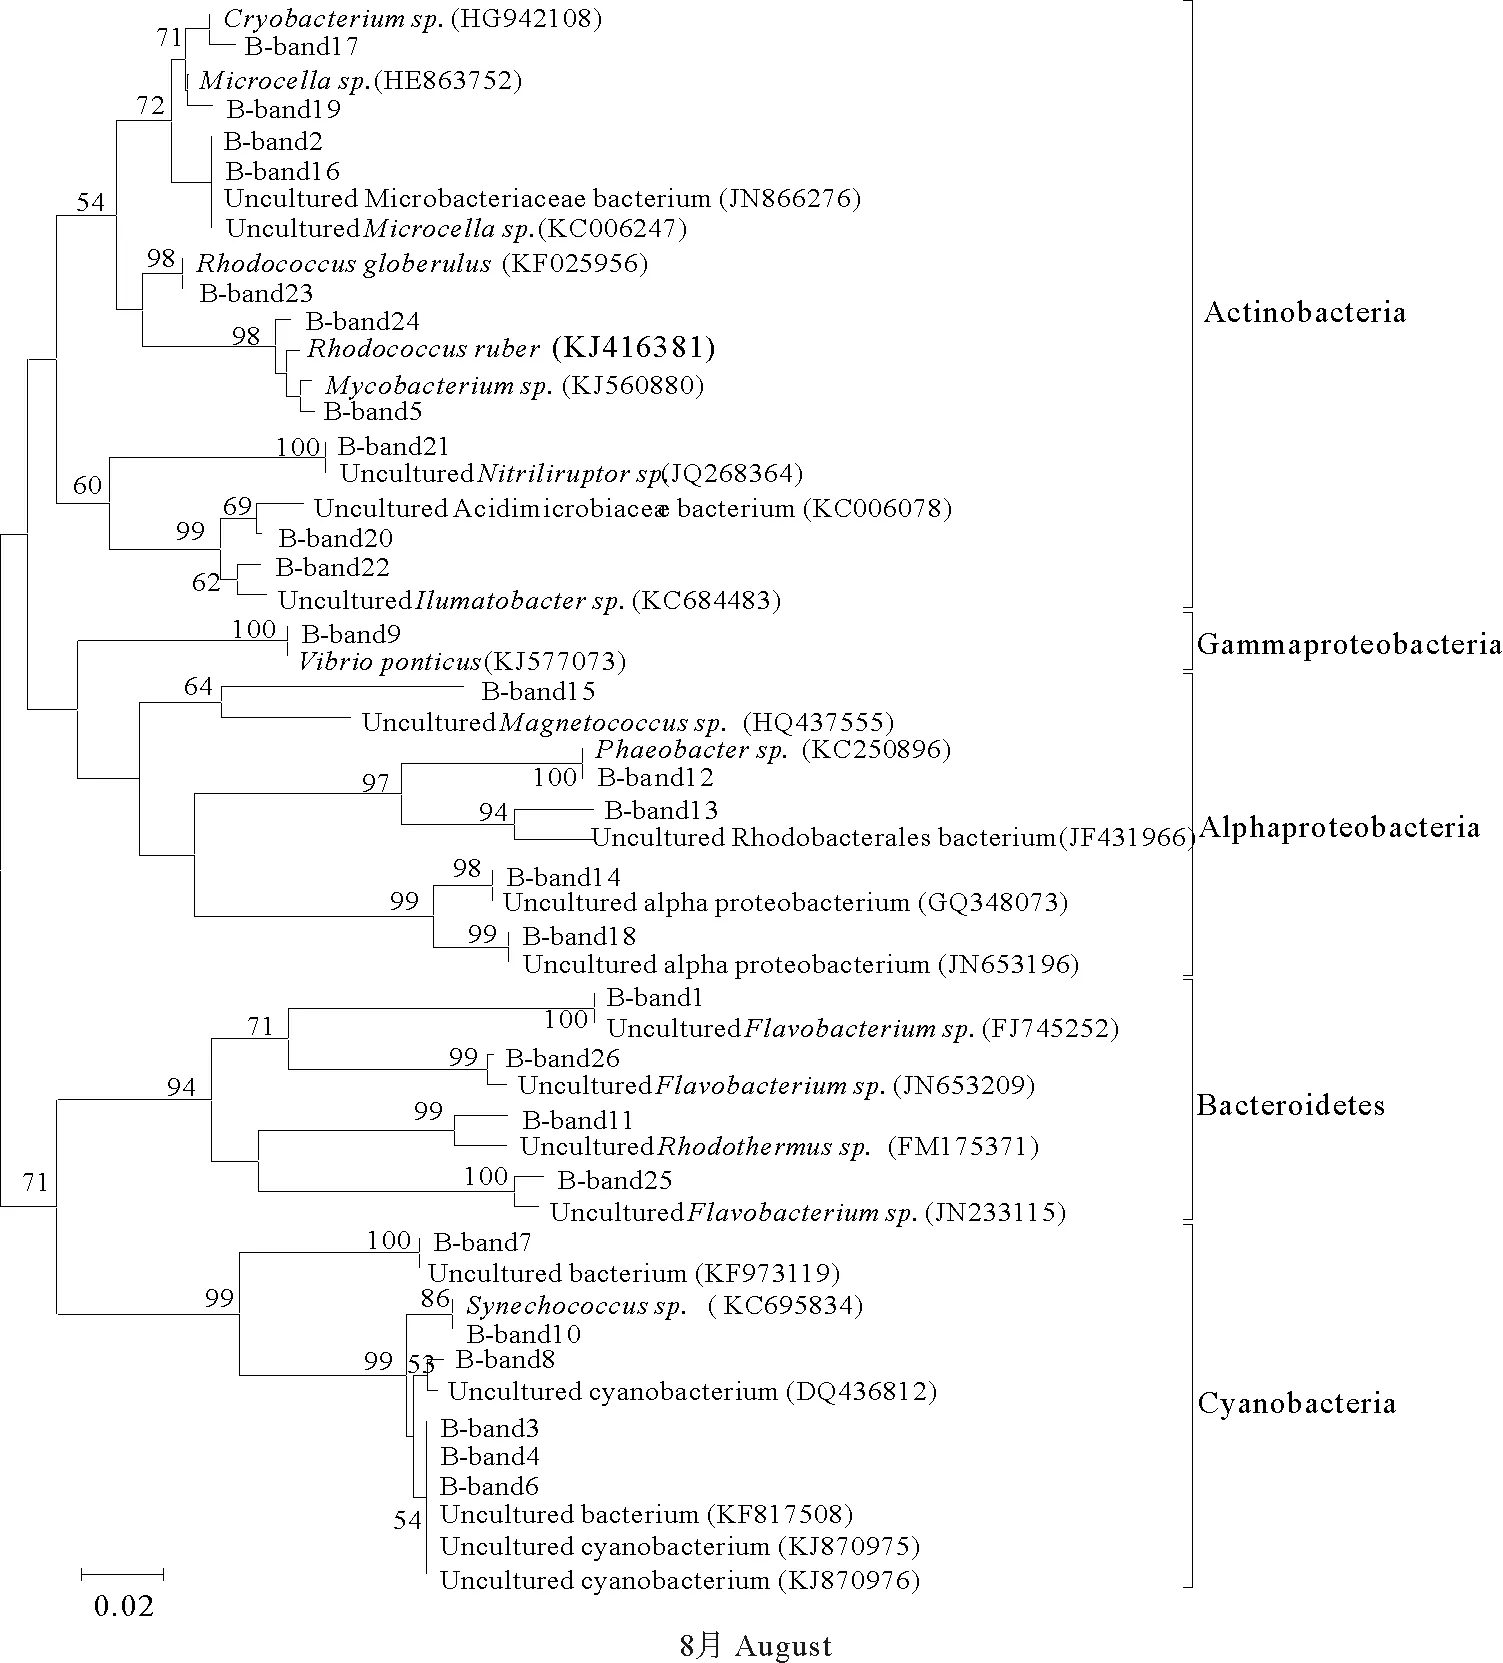
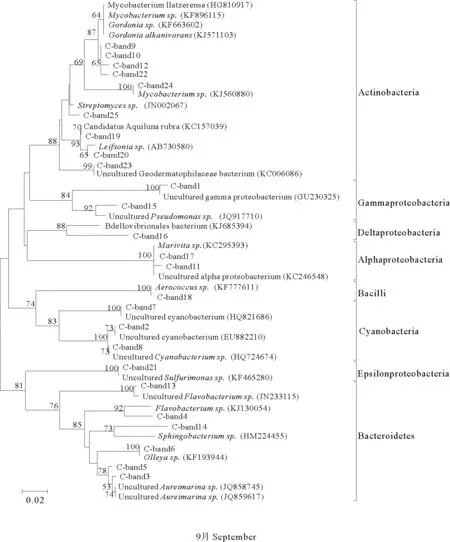
图2 水体菌群16S rDNA-V3序列系统发育树
2.4 水体细菌群落结构的CA分析
图4所示为不同处理组的CA分析。从图中的变量因子(C0、C1、C2、C3、C4分别由图4中的A、B、C、D、E表示)载荷和卡方距离可以看出,代表不同处理的点分布在排序图的不同空间。7月代表各处理组的点基本分布在排序图的中心附近;8月中C2和C3处理分布在排序轴的中心附近,C1和C4分布其两侧,都与对照组C0相距较远;而在9月,C2处理分布在排序轴的中心附近,与C1和C3处理差距不远,C0和C4处理靠近在排序图的边缘。综上表明,不同C/N水平条件下细菌群落的结构组成随着养殖实验的进行差异越来越明显。
2.5 水体各类细菌群落的相对丰度与环境因子的RDA分析
将不同C/N水平条件下细菌群落结构DGGE图谱数字化后与8种环境因子相结合进行RDA分析,两者之间的关系如图5所示。代表不同处理组的点分布在排序图的不同空间,表明不同C/N水平条件下水体中细菌群落结构存在差异。
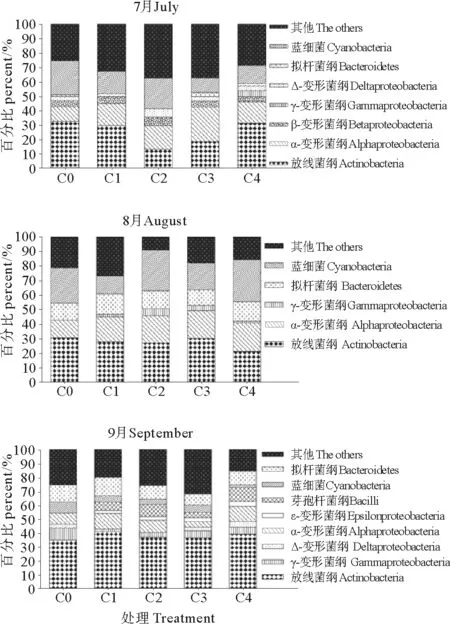
图3 水体中各种细菌群落的相对丰度

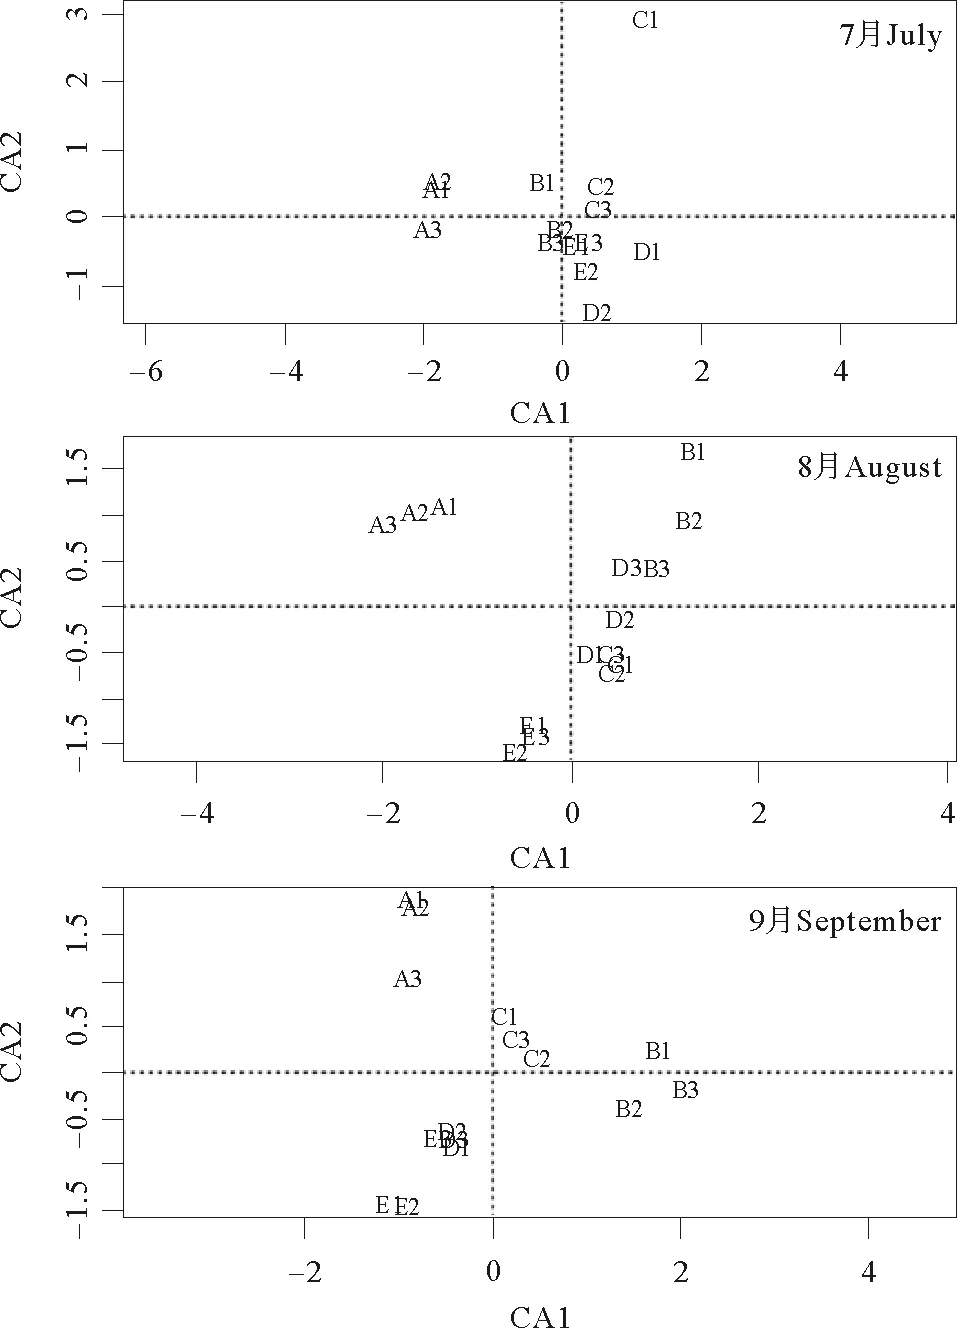
(图中大写英文字母A、B、C、D和E分别代表C0、C1、C2、C3、C4不同处理组,A1~A3、B1~B3、C1~C3、D1~D4和E1~E3分别代表相应处理的3个重复。A, B, C, D and E represents C0, C1, C2, C3 and C4, respectively and A1~A3,B1~B3,C1~C3,D1~D3 and E1~E3 represents three replicates for each treatments.)
图4不同处理组的CA分析
Fig.4The CA analysis of different treatment group


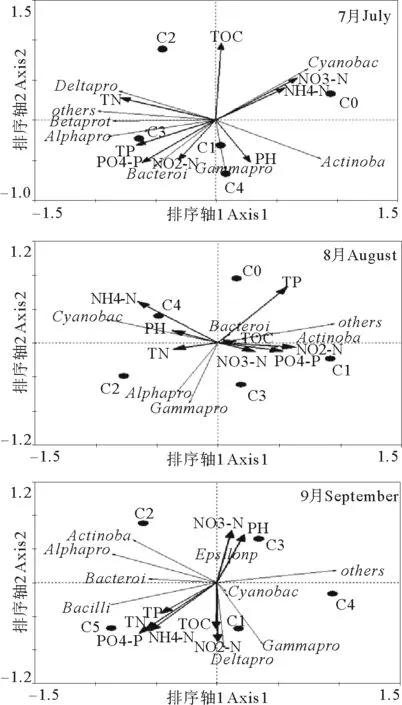
图5 不同C/N水平水体中各类细菌群落
2.6水体细菌群落多样性
本研究采用香农-维纳指数衡量细菌群落结构的多样性,采用Pielou指数来反映群落结构的的均匀度[17],从而对细菌群落结构进行相对准确的分析。从图6可以看出,从时间尺度看,香农维纳指数和均匀度指数在整体上均呈现先高后低的变化趋势,以8月最高,7月最低,9月略低于8月。从不同C/N水平来看,C2组香农维纳指数呈现上升趋势,较其他处理组要高;而均匀度最高值则出现在8月的C1组,与C2组相差不大。C4组香农维纳指数和均匀度指数均最低,其他处理组则介于两者之间。综合上述2个指数可以看出,C2组细菌群落的多样指数最高,C4组最低。
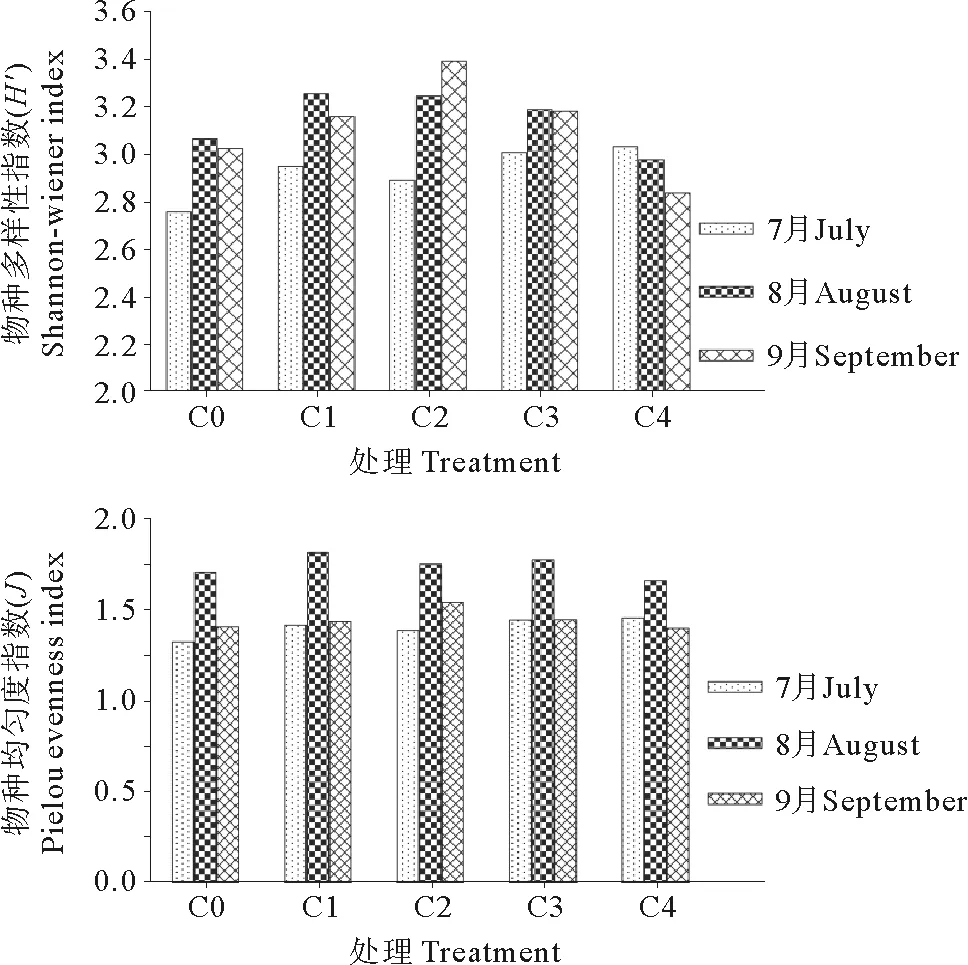
图6 基于DGGE图谱计算的Shannon-Winener
3讨论
3.1 虾蟹混养池塘水体中细菌的群落结构特征。
PCR-DGGE技术是现代分子生物学中用于鉴定并分析细菌群落多样性变化的一种重要分析手段[18],该方法消除了传统培养方法的限制,可在基因水平上更加全面、真实地反映细菌群落的结构信息[19]。本研究以该技术手段分析了不同糖蜜添加量虾蟹混养池塘7—9月水体中细菌群落结构的多样性。研究发现,各处理细菌的优势菌群为放线菌、α-变形菌、蓝细菌和一些未知不可培养细菌。这一结果与其它研究存在较大的差异。例如,罗鹏等研究发现,变形菌门(β纲细菌占1/5)和CFB(Cytophaga-Flexibacter-Bacteroides)是凡纳滨对虾养殖系统中的优势菌群[20];而夏耘等研究表明,在草鱼养殖系统中,絮团的主要细菌类型为变形菌、放线菌、拟杆菌及一些未知不可培养细菌[21]。这种差异可能与养殖种类、模式、养殖用水的类型以及添加的碳源和饵料的不同有关。本研究在养殖初期检测到β-变形菌,但这些细菌在养殖后期未被检测到,证实了Stevens等的研究结果[22];养殖后期,C/N调控组新出现了ε-变形菌纲和芽孢杆菌纲细菌,这与赵培[23]的研究结果相似。

3.2 虾蟹混养系统中水体细菌群落结构的多样性指数
群落多样性是衡量群落稳定性的重要指标,群落组成越复杂,其结构越稳定,得到的缓冲越大,可以很好地应对外界环境的变化和群落内部种群的波动。表征生物多样性指标的参数较多[29],本研究使用了香农维纳指数和均匀度指数。可以看出,细菌群落多样性指数变化趋势与DGGE指纹图谱的分析结果基本一致。其中,7月的香农维纳指数和均匀度指数最低,说明7月的细菌多样性最低,群落组成最简单,结构不稳定[30]。而8、9月的细菌群落的香农维纳指数相差不大,表明细菌群落结构较稳定,抗外界干扰能力比较强。群落多样性与养殖环境关系密切,当生态环境恶化时,微生物多样性则会明显下降[31],且在一定范围内,随营养物质的增加而增大,而过高则会受到抑制[32]。本研究发现处理组C1、C2和C3的香农维纳指数高于对照组,其中C2组的多样性指数数值在养殖后期明显高于其它处理组,而C4组则为最低。这表明C/N水平影响不同养殖模式水体细菌群落多样性,当C/N水平过高时,则可能会抑制环境敏感细菌的生长和繁殖,造成多样性的下降[24,31,33-34]。
3.3 虾蟹混养池塘水体中细菌群落结构与环境因子之间的关系

参考文献:
[1]Avnimelech Y, Kochba M. Evaluation of nitrogen uptake and excretion by tilapia in biofloc tanks using N-15 tracing [J]. Aquaculture, 2009, 287(1): 163-168.
[2]Avnimelech Y. Feeding with microbial flocs by tilapia in minimal discharge bioflocs technology ponds [J]. Aquaculture, 2007, 264(1): 140-147.
[3]Emerenciano M, Ballester E L C, Cavalli R O, et al. Biofloc technology application as a food source in a limited water exchange nursery system for pink shrimp Farfantepenaeus brasiliensis (Latreille, 1817)[J]. Aquaculture Research, 2012, 43(3): 447-457.
[4]Crab R, Defoirdt T, Bossier P, et al. Biofloc technology in aquaculture: beneficial effects and future challenges [J]. Aquaculture, 2012, 356: 351-356.
[5]Crab R, Lambert A, Defoirdt T, et al. The application of bioflocs technology to protect brine shrimp (Artemiafranciscana) from pathogenicVibrioharveyi[J]. Journal of Applied Microbiology, 2010, 109(5): 1643-1649.
[6]Avnimelech Y. Carbon/nitrogen ratio as a control element in aquaculture systems [J]. Aquaculture, 1999, 176(3): 227-235.
[7]Hargreaves J A. Photosynthetic suspended-growth systems in aquaculture [J]. Aquacultural Engineering, 2006, 34(3): 344-363.
[8]Asaduzzaman M, Wahab M A, Verdegem M C J, et al. C/N ratio control and substrate addition for periphyton development jointly enhance freshwater prawnMacrobrachiumrosenbergiiproduction in ponds [J]. Aquaculture, 2008, 280(1): 117-123.
[9]Azim M E, Little D C. The biofloc technology (BFT) in indoor tanks: water quality, biofloc composition, and growth and welfare of Nile tilapia (Oreochromisniloticus) [J]. Aquaculture, 2008, 283:29-35.
[10]卢炳国, 王海英, 谢骏, 等. 不同C/N水平对草鱼池生物絮团的形成及其水质的影响[J]. 水产学报, 2013(8): 1220-1228.
Lu B G, Wang H Y, Xie J, et al. Effect of C/N ratio on bioflocs formation and water quality in zero-water exchange grass crap tanks[J]. Journal of Fisheries of China, 2013(8): 1220-1228.
[11]周演根, 马甡, 苏跃朋, 等. 三疣梭子蟹与凡纳滨对虾混养实验研究[J]. 中国海洋大学学报(自然科学版), 2010, 40(3): 11-16.
Zhou Y G, Ma S, Su Y P, et al. Studies on the Effects of Polyculture of Litopenaeus vannamei with Portunus trituberculatus[J]. Periodical of Ocean University of China, 2010, 40(3): 11-16.
[12]车玉伶, 王慧,胡洪营,等. 微生物群落结构和多样性解析技术研究进展[J]. 生态环境, 2005, 14(1): 127-133.
Che Y L, Wang H, Hu H Y, et al. Research progresses on analytical technologies used in microbial community structure and diversity[J]. Ecology and Environment, 2005, 14(1): 127-133.
[13]张振冬, 王淑芬, 曹宇峰. DGGE技术及其在海洋环境微生物多样性研究中的应用[J]. 海洋环境科学, 2008, 27(3): 297-300.
Zhang Z D, Wang S F, Cao Y F. DGGE technique and its application in study on microbial diversity in marine environment[J]. Marine environmental science, 2008, 27(3): 297-300.
[14]傅莲英. 虾蟹混养池细菌多样性的研究[D]. 厦门: 厦门大学, 2006.
Fu L Y. Study of Bacterial diversity in Shrimp and Crab Mixed-Cultured ponds[D].Xiamen: Xiamen University, 2006.
[15]Petr I R, Mhoff J F. Genetic analysis of sea-ice bacterial communities of the western Baltic sea using an improved double gradient method[J]. Polar Biology, 2001, 24(4): 252-257.
[16]李德尚, 杨红生, 王吉桥, 等. 一种池塘陆基实验围隔[J]. 青岛海洋大学学报, 1998, 28(2) : 199-204.
Li D S, Yang H S, Wang J Q, et al. A device of land-based experimental enclosure used in ponds[J]. Journal of Ocean University of Qingdao, 1998, 28(2) : 199-204.
[17]Sun J, Liu D Y. The application of diversity indices in marine phytoplankton studiesActaOceanologicaSinica, 2002, 26(1): 62-75.
[18]梁英娟, 罗湘南, 付红霞. PCR-DGGE技术在微生物生态学中的应用[J]. 生物学杂志, 2007, 24(6): 58-60.
Liang Y J, Luo X N, Fu H X. Application of PCR-DGGE in microbial ecology[J]. Journal of Biology, 2007, 24(6): 58-60.
[19]Fu D Y, Yu X T, Wang F. The effects of compound microorganisms on the growth and water quality in carps[J]. Feed Res, 2005(8): 43-45.
[20]罗鹏, 胡超群, 张吕平, 等. 凡纳滨对虾海水养殖系统内细菌群落的PCR-DGGE分析[J]. 中国水产科学, 2009, 16(1): 31-38.
Luo P, Hu C Q, Zhang L P, et al PCR-DGGE analysis of bacterial communities in marine Litopenaeus vannamei culture system[J]. Journal of Fishery Sciences of China, 2009, 16(1): 21-38.
[21]夏耘, 邱立疆, 郁二蒙, 等. 生物絮团培养过程中养殖水体水质因子及原核与真核微生物的动态变化[J]. 中国水产科学, 2014, 21(1): 75-83.
Xia Y, Qiu L J, Yu E M, et al. Dynamic changes of water quality factors and composition of pro- karyotic and eukaryotic microorganisms during culturing of bio-floc[J]. Journal of Fishery Sciences of China, 2014, 21(1): 75-83.
[22]Stevens H, Stobner M, Simon M, et al. Phylogeny of Proteobacteria and Bacteroidetes from oxic habitats of a tidal flat ecosystem [J]. FEMS Microbiol Eco1, 2005, 54: 351-365.
[23]赵培. 生物絮团在海水养殖中的研究与应用[D]. 上海: 上海海洋大学, 2011.
Zhao P. The study and application of bioflocs technology in seawater aquaculture[D]. Shanghai: Shanghai Ocean University, 2011.
[24]Goldman J C, Caron D A, Dennett M R, et al. Regulation of gross growth efficiency and ammonium regeneration in bacteria by substrate C: N ratio[J]. Limnology and Oceanograply, 1987, 32(6): 1239-1252.
[25]刘瑞娟. 蟹虾贝混养系统细菌群落结构与功能多样性初步研究[D]. 青岛: 中国海洋大学, 2014.
Liu R J. Preliminary study on variation of microbe quantity and community composition in polyculture ecosystem of crab, shrimp and clam[D]. Qingdao: Ocean University of China, 2014.
[26]邓吉朋, 黄建华, 江世贵, 等. 生物絮团在斑节对虾养殖系统中的形成条件及作用效果[J]. 南方水产科学, 2014, 10(3): 29-37.
Deng J P, Huang J H, Jiang S G, et al. Conditions for bio-floc formation and its effects onPenaeusmonodonculture system[J]. South China Fisheries Science, 2014, 10(3): 29-37.
[27]Rosenberry B. Meet the Flockers: What Is Bio-loc Shrimp Farming and How Does It Work? [EB/OL]. [2011-04-11]. http: //www. shrimpnews. com/FreeReports Folder/MeetFlnekers. html.
[28]Hari B, Madhusoodana Kurup B, Varghese J T, et al. The effect of carbohydrate addition on water quality and the nitrogen budget in extensive shrimp culture systems[J]. Aquaculture, 2006, 252(2-4): 248-263.
[29]Yang Y H, Yao J. Effect of pesticide pollution against functional microbial diversity in soil [J]. Journal of Microbiology, 2000, 20(2): 23-25.
[30]刘东艳, 孙军, 张利永. 胶州湾浮游植物水华期群落结构特征[J]. 应用生态学报, 2003, 14(11): 1963 -1966.
Liu D Y, Sun J, Zhang L Y. Structural characteristics of phytoplankton community during harmful algae bloom in Jiaozhou Bay[J]. Journal of Applied Ecology, 2003, 14(11): 1963-1966.
[31]冯胜, 秦伯强, 高光. 细菌群落结构对水体富营养化的响应[J]. 环境科学学报, 2007, 27 (11): 1823-1829.
Feng S, Qin B Q, Gao G. Response of bacterial communities to eutrophic water in Lake Taihu[J]. Acta Scientiae Circum stantiae, 2007, 27(11): 1823-1829.
[32]有小娟, 李秋芬, 张艳,等. 象山港内西沪港海域沉积环境细菌群落结构的时空变化及其主要环境影响因子[J]. 应用与环境生物学报, 2013, 19(5): 742-749.
You X J, Li Q F, Zhang Y, et al. Spatial and temporal variation of bacterial community structures and their main environmental influencing factors in sediment environment of Xihu Area in Xiangshan Bay[J]. Chinese Journal of Applied & Environmental Biology, 2013, 19(5): 742-749.
[33]Schneider J, Sereti V, Machiels M A M, et al. The potential of producing heterotrophic bacteria biomass on aquaculture waste[J]. Water Research, 2006, 40(14): 2684-2694.
[34]罗佳, 韩士群, 罗海荣, 等. 外加碳源对富营养化水体生物脱氮效果及细菌群落结构的影响[J]. 江苏农业学报, 2012, 28(6): 1312-1317.
Luo J, Han S Q, Luo H R, et al. Effect of exogenus carbon resource on biological denitrification and bacte-rial community structure of eutrophic waters[J]. Jiangsu Journal of Agriculture Sciences, 2012, 28(6): 1312-1317.
[35]Gast R J, Dennett M R, Caron D A, et al. Charaterization of protistan assemblages in the Ross Sea,Antarctic by denaturing gradient gel electrophoresis[J]. Applied and Environmental Microbiology, 2004, 4: 2028-2037.
[36]Kent A D, Smith D J, Benson B J, et al. Web-based phylogenetic assignment in tool for analysis of terminal restriction fragment length polymorphism profiles of microbial communities[J]. Applied and Environmental Microbiology, 2003, 69(11): 6768-6776.
[37]冯胜, 李定龙, 秦伯强. 太湖水华过程中微生物群落的动态变化[D]. 宁波:宁波大学学报, 2010.
Feng S, Li D L, Qi B Q. Dynamic Changes of Bacteria Community in Algale Blooming in Taihu Lake[D].Ningbo: Journal of Ningbo University, 2010.
[38]Melissa A R, Laura G L. Nutrients and other abiothic factors affecting bacterial communities in an Ohi River(USA)[J]. Microbial Ecology, 2007, 54(2): 374-383.
责任编辑朱宝象
Effect of Molasses Addition on Microbial Community Structure in the Polyculture System ofPortunustrituberculatusandLitopenaeusvannamei
LI Jie1, TIAN Xiang-Li1, DONG Shuang-Lin1, GAO Ming-Liang1, ZHANG Kai1,FENG Jie1, BAN Wen-Bo1, ZHANG Qing-Qi2
(1.The Key Laboratory of Mariculture, Ministry of Education, Ocean University of China, Qingdao 266003, China; 2.Marine Fishery Technology Guiding Office, Ganyu, Lianyungang 222100, China)
Abstract:Bacteria are producers and decomposers of the microbial ecosystem, playing a very important role there in the material circulation, energy flow, environmental improvement and prevention of diseases, and being closely related to the diseases outbreaking frequently among the farming and breeding ani-mals. Accordingly, it is very significant to study microbial community composition, structure and function. In the present study, the PCR-DGGE (denaturing gradient gel electrophoresis) technology, redundancy analysis (RDA) and the diversity index were employed to characterize the bacterial community structure in the polyculture system of Portunus tritiberculatus and Litopenaeus vannamei to investigate the effect of abiotic factors. In terms of microbiology, the regulation of C/N could be a useful mean of improving aquatic environments; it can promote the growth of P. trituberculatus and L. vannamei in the polyculture system. The group treated with basic feed was used as control(C0). Four other C/N levels (i. e. 10, 15, 20 and 25) were set in this experiment by adding molasses into artificial feed, and the four treatments were represented by C1, C2, C3 and C4 group, respectively. Results from this study demonstrated that the major bacteria included Actinobacteria, Cyanobacteria, Proteobacteria (α, β, γ, δ and ε), Bacteroidetes and Bacillibacteria in seawater of this polyculture system. In this study, the results had significant difference from those of other researches, which may be cause by the different culture of species, breeding patterns, type of aquaculture water and the addition of carbon and feed. Change in community structure of bacteria in water is related to the content and proportion of C and N. A similar bacterial community structure was obtained between treatments of C1, C2, C3 and C4, all being significantly different from C0 group. All treatments had a similar dominant bacterial community and Actinobacteria dominated all aquaculture experiment, while there was a significant difference between treatments in the relative amount of dominant bacterial community. In comparison with the control, the microbial community diversity increased with the aquaculture time. Rather than control group, γ-Proteobacteria was detected in August in other treatments and ε-Proteobacteria and Bacillibacteria in September. These findings illustrated that adding carbon into the aquaculture water appropriately may make contribution to the growth of aquaculture probiotic. CA analysis showed that the difference between the bacterial community compositions is more significant in the later stage of the experiment. When compared with other groups, C2 group has a better bacterial community composition and more stable structure. The diversity index showed a variation trend of increasing firstly and reached the maximum in August and then decreased. No significant change of Pielou index was observed among all treatments, while Shannon-Winener index increased firstly and then decreased, being the highest in C2 group and the lowest in C4 group in September. From the results, it was showed that C/N ratio affected aquatic microbial community diversity. It might inhibit the growth and reproduction of the environmentally sensitive bacteria when C/N level was too high, which will decrease the diversity of the microorganisms. According to RDA analysis, the change in microbial community structure was the synergistic result of multi-abiotic factors, of them TOC > TN > -N > TP > -P > -N in July, TP > -N> P in August and -N > -N> -P > -N > pH > TN > TOC in September. It showed that TOC was an important factor in early experiment. Besides, despite the different specific forms, N and P are the important elements, which could affect the microbial community structure during the entire breeding process. The preliminary experimental results showed that the C/N level of 15 was better for the polyculture system of P. trituberculatus and L. vannamei in seawater purification and in the maintenance of microbial community structure.
Key words:polyculture; water quality; environmental factor; PCR-DGGE; C/N; redundancy analysis; bacterial community; diversity index
基金项目:❋ 国家“十二五”科技支撑计划项目(2011BAD13B03);山东省杰出青年基金项目(JQ201009)资助
收稿日期:2015-02-04;
修订日期:2015-12-13
作者简介:李杰(1985-),女,硕士生,从事水产养殖生态学研究。E-mail:lijiexiaomai@163.com ❋❋通讯作者: E-mail:xianglitian@ouc.edu.cn
中图法分类号:S917.1
文献标志码:A
文章编号:1672-5174(2016)05-038-12
DOI:10.16441/j.cnki.hdxb.20150040
Supported by National Great Project of Scientific and Technical Supporting Programs(2011BAD13B03);Program for Excellent Youth Foundation of Shandong Province(JQ201009)
