ARTICLE High-Resolution Experimental Study on Photodissocaition of N2O†
2016-04-08ShengruiYuDofuYunWentoChenTingXieSiwenWngXuemingYngXingWngCenterforAdvncedChemiclPhysicsndDeprtmentofChemiclPhysicsSchoolofChemistryndMterilsScienceUniversityofSciencendTechnologyofChinHefei230026ChinbSttekeyL
Sheng-rui Yu‡,Do-fu Yun‡,Wen-to Chen,Ting Xie,Si-wen Wng,Xue-ming Yng∗, Xing-n Wng,c∗.Center for Advnced Chemicl Physics nd Deprtment of Chemicl Physics,School of Chemistrynd Mterils Science,University of Science nd Technology of Chin,Hefei 230026,Chinb.Stte key Lbortory of Moleculr Rection Dynmics,Dlin Institute of Chemicl Physics,ChineseAcdemy of Sciences,Dlin 116023,Chinc.iChEM,Collbortive Innovtion Center of Chemistry for Energy Mterils,Hefei 230026,Chin(Dted:Received on December 19,2015;Accepted on Jnury 4,2016)
ARTICLE High-Resolution Experimental Study on Photodissocaition of N2O†
Sheng-rui Yua,b‡,Dao-fu Yuana‡,Wen-tao Chena,Ting Xiea,Si-wen Wanga,Xue-ming Yanga,b∗, Xing-an Wanga,c∗
a.Center for Advanced Chemical Physics and Department of Chemical Physics,School of Chemistry
and Materials Science,University of Science and Technology of China,Hefei 230026,China
b.State key Laboratory of Molecular Reaction Dynamics,Dalian Institute of Chemical Physics,Chinese
Academy of Sciences,Dalian 116023,China
c.iChEM,Collaborative Innovation Center of Chemistry for Energy Materials,Hefei 230026,China
(Dated:Received on December 19,2015;Accepted on January 4,2016)
We study the photodissociation dynamics of nitrous oxide using the time-sliced ion velocity imaging technique at three photolysis wavelengths of 134.20,135.30,and 136.43 nm. The Oproduct channels were investigated by measuring images of theproducts.Vibrational states ofproducts were fully resolved in the images.Product total kinetic energy releases(TKER)and the branching ratios of vibrational states of N2products were determined.It is found that the most populated vibrational states of N2products are v=2 and v=3.The angular anisotropy parameters(β values)were also derived.The β values are very close to 2 at low vibrational states of the correlatedproducts at all three photolysis wavelengths,and gradually decrease to about 1.4 at v=7.This indicates the dissociation is mainly through a parallel transition state to form products at lower vibrational states,and the highly vibrational exited products are from a more bent con fi guration.This is consistent with the observed shift of the most intense rotational structure in the TKER as the vibrational quantum number increases.
Key words:N2O,Ion imaging,Vacuum ultraviolet,Photodissociation.
†Part of the special issue for“the Chinese Chemical Society’s 14th National Chemical Dynamics Symposium”.
‡They contributed equally to this work.
∗Authors to whom correspondence should be addressed.E-mail: xmyang@dicp.ac.cn,xawang@ustc.edu.cn.
I.INTRODUCTION
Nitrous oxide(N2O)plays a very important role in atmospheric chemistry[1].It is one of the key molecules in the ozone depletion processes in earth’s atmosphere [2,3].N2O also has an even higher global warming potential than CO2on a per molecule basis.Through an atmospheric window in the UV range,N2O molecules strongly interact with the sunlight.The NO and O products formed from N2O photodissociation are actively involved in various atmospheric chemical reactions.In experimental work,photodissociation processes of N2O are often employed to produce atomic oxygen and nitrogen beams.Hence,there have been much theoretical[4−7]and experimental studies carried out on the photodissociation dynamics of N2O especially in the UV range[8−12].
In the vacuum ultraviolet(VUV)range,there are two main peaks centered at 128 and 145 nm in the absorption spectra,which correspond to the D(X1Σ+g)and C(1Π)states of N2O molecules,respectively[13−15].In 1970s,by measuring the relative quantum yield of the product channels,Black et al.found that,for the O elimination dissociation,N2O photodissociation in the VUV range is mainly via the following three channels [16]:,, and O;thechannel is the primary product channel.Time-off l ight spectra of dissociation products were measured by Gilpin et al.[17]and Stone et al.[18],using a conventional fl ash lamp as the light source.They identi fi ed several metastable reaction products.The limited resolution precludes further energy analysis.
With the fast progress of laser techniques employed in reaction dynamics,experimental studies are readily possible to be performed in the VUV range using laser light.In 2005,Witinski et al.carried out experiments on the photodisscociation of NO near 130 nm[19].They studied O and Oproduct channels with the oxygen Rydberg time-of- fl ight method.Also at photolysis wavelengths near 130 nm,Lambert et al.investigated the photodissociation dynamics of N2O using the ion imaging detection technique[20].They obtained the branching ratios of fi ve product channels,and thechannel is found to be the dominant one.Recently,using the time-sliced ion imaging technique,Yu et al.studied the photodissocation dynamics of N2O at nine of photoly-sis wavelengths from 124.44 nm to 133.20 nm[21], corresponding to the excitation to theelectronic state.It id that the nonadiabatic coupling between theand3Π states plays a role in the dissociation process.The branching ratios of thechannel through this coupling get relatively larger when the photolysis wavelength increases.Furthermore,one marked feature of photodissociation dynamics for Ochannel is that the vibrational distribution becomes more hotter as the photolysis wavelength increases.
Such remarkable observations encourages us to examine thevibrational distribution as the photolysis wavelength further increases.Hence,here we focused on the primary channelof the photodissociation of N2O at 134.20,135.30,and 136.43 nm.The resolution of the measured images was su ffi ciently high to fully resolve the vibrational structures in the Ochannels.The minor shifts of the peak position in the total kinetic energy releases (TKER)were observed.A more quantitative picture of photodissociation of this molecule in thestate was discovered based on the high resolution results.Tunable VUV light source,generated by the nonlinear optic process in rare gas,was employed in this work.The results provide detailed information on the dissociation process of the Oproduct channel.
II.EXPERIMENTS
The experiments were carried out using a new molecular beam apparatus that has been described previously[21].In brief,a N2O molecular beam was generated by a supersonic expansion of the gas mixture (5%N2O in Ar)in a source chamber,using a general valve(Parker Series 9)with a 1 mm ori fi ce.The repetition rate of the pulsed valve was 20 Hz.And the stagnation pressure behind the nozzle was 1 bar.The typical operating pressure in the source chamber was 1×10⁻⁵mbar.The ion imaging detector is mounted in the detection chamber[22−24].In this work,the background pressures in the source chamber and the detection chamber were 9×10⁻⁹mbar and 1.5×10⁻⁸mbar, respectively.The axis of the general valve is perpendicular to the plane of the imaging detector.18 mm downstream from the nozzle,there was a skimmer with 1.5 mm diameter.The N2O beam passed through the skimmer,and entered the detection chamber with a typical operating pressure of 5×10⁻⁸mbar.75 mm downstream from the nozzle,the collimated beam passed through a 2 mm hole in the fi rst electrode plate and propagated further along the axis of the 650 mm long time-of- fl ight tube of the ion imaging detector.
The VUV photodissociation laser in this work was generated using the nonlinear four wave mixing method. A 212.55 nm(ω1)laser beam was generated by the doubled output of a tunable dye laser(Corbra-Stretch, Sirah).And a second tunable laser(ω2)was generated by the fundamental output of another tunable dye laser. The two dye lasers were pumped by a Nd:YAG laser. The two laser beams were spatially and temporally overlapped and focused collimated through a stainless steel krypton gas cell with an MgF2collimating lens.The generated VUV(2ω1−ω2)radiation and the residual incident laser light entered the detection chamber.The polarization of the resulting VUV laser is determined by the second laser(ω2).A third pulsed dye laser(labeled as ω3)pumped by a second Nd:YAG laser was employed for the detection,enabling the study of photodissociation dynamics at various wavelengths.
The detection for the O(1S0)products was done by a(1+1′)VUV+UV ionization scheme.The intermediatestateforthisionizationprocessis O3s]).A second VUV radiationwas produced in the same gas cell as the photolysis VUV laser.During the experiment,the polarization of the photolysis laser is parallel with the plane of the imaging detector.And the polarization of the detection laser is perpendicular to the plane of the imaging detector.The N2O molecular beam crossed with the photolysis laser inside the 23-plate time sliced ion optics[25].The atomic oxygen photofragments fromed in the dissociation were then detected by the detection laser.The oxygen ions images were collected by a 70 mm micro-channel plate (MCP)coupled to a phosphor screen(P43).The transient images on the phosphor screen were captured by a charge-coupled device camera(Imager pro plus 2M, LaVision).Every image was evaluated by the event counting scheme.The timing of the pulsed valve,dissociation and ionization lasers,and the gate pulse applied to the MCP were controlled by two delay generators (DG 645 Stanford Research System).The speed of the product was calibrated using the O+signal from the photodissociation of O2at about 225 nm.
III.RESULTS AND DISCUSSION
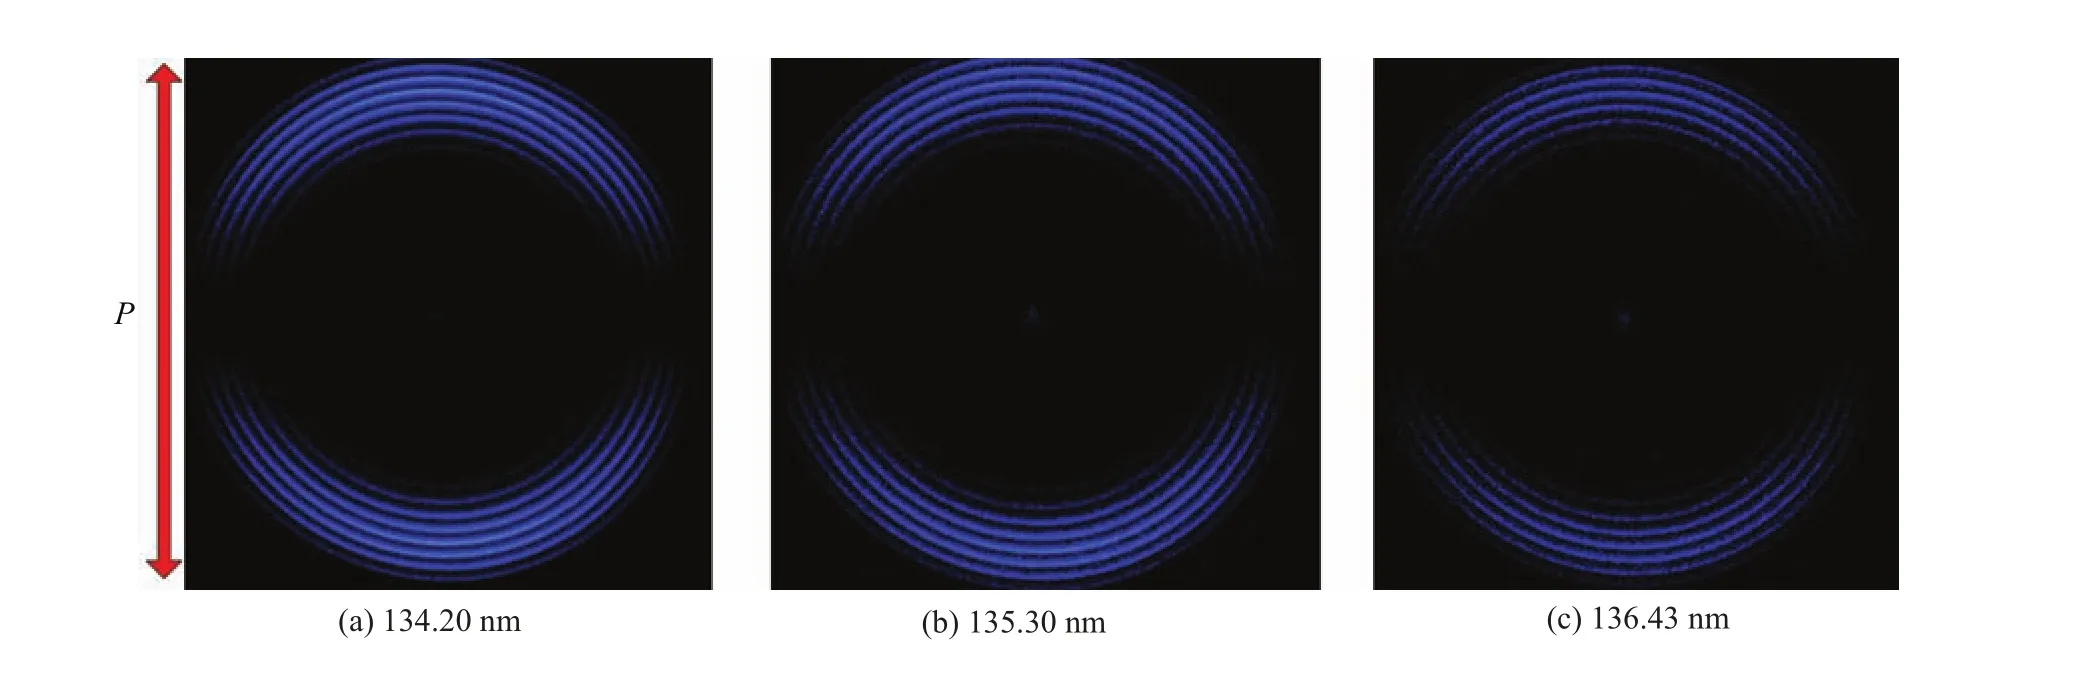
FIG.1 Raw ion images of O(1SJ=0)products from the photodissociation of N2O at 134.20,135.30,and 136.43 nm,respectively.The rings in the images correspond to the vibrational state of the coincident N2products.The red arrow shows the polarization direction of the photolysis lase.
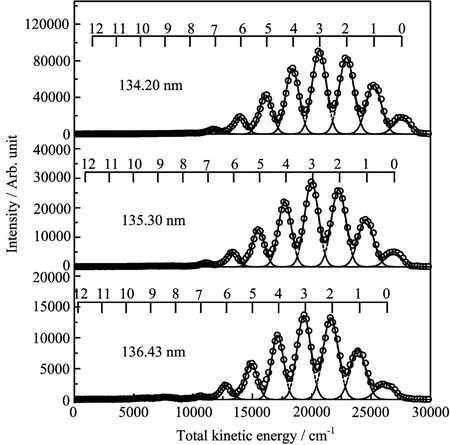
FIG.2The TKER distribution for O(1S0)+N2(X1Σ+g) channels from the photodissociation of N2O at 134.20, 135.30,and 136.43 nm.Results for all J levels of the oxygen atom products are shown.In each plot,peaks are assigned to the vibrational states of the coincident N2product.
The speed distributions of the O(1S0)products were extracted from the measured raw ion images.The product speed distributions were then converted to the product TKER.The energy of the whole system in photodissociation can be described by the equation below:

where Ehνis the energy of the photolysis laser, D0(N2−O)is the bond energy of N−O bond which was determined by previous work[27],Evibronic(N2)is the internal electronic and vibrational energy of N2products,and Eint(O)is the energy di ff erence between the oxygen atom products and the ground state O(3P2). Because a separate detection laser was employed,the detection process was independent of the photolysis process,all parameters in Eq.(1)are therefore independent of others.The TKER of O(1S0)products at 134.20, 135.30,and 136.43 nm are displayed in Fig.2 where the vibrational anharmonic e ff ects are included.The vibrational states of the correlated N2(X1Σ+g)products are clearly resolved in the TKER.The very well separated vibrational peaks indicate that the rotational state distributions of the correlated N2(X1Σ+g)products are quite cold.No signi fi cant signal from the N2O vibrational states was observed in the O(1S0)channel showing that cooling of the molecular beam was quite e ffi cient.In Fig.2,the red solid line in each graph is the results of a multi-peak fi tting of the total kinetic energy.The vibrational state branching ratios were derived base on this mulit-peak analysis.
The product angular distribution for a dissociation process could be described by the following equation:

where θ is the angle between the polarization direction of the photolysis laser and the velocity vector of therecoil product,P2(cosθ)is the second Legendre polynomial,β is the anisotropy parameter which is the key factor to characterize a photodissociation process.With the well resolved vibrational structures in the raw ion images,the anisotropy parameter for each vibrational state could be derived by fi tting the angular distributions in these images with Eq.(2).The β values at di ff erent photolysis wavelengths are plotted as a function of the vibrational quantum number and displayed in Fig.3 for the O(1S0).We found that,at all three photolysis wavelengths,the β values of thefor ground vibrational states(v=0)inare very close to 2,and the high β values keep up to v=3.As the vibrational quantum number further increases,the β value gradually decreases and eventually reaches the lowest value of 1.4.This behavior indicates that the photodissociation process is governed by a parallel photodissociation mechanism from a linear con fi guration for products in lower vibrational states,and becomes less anisotropic for the N2product in vibrationally excited states.

FIG.3 Anisotropy parameters for individual vibrational states in O
Using the multi-peak fi tting for the TKER mentioned above,we obtained the branching ratios of di ff erent vibrational states forproducts(Fig.4). Seven vibrational states were clearly identi fi ed for thechannel.Due to the low absorption coe ffi cient at the studied photolysis wavelengths, signals from high vibration states were too small to be acquired.The population of vibrational states in thechannel is inverted:the most populated states are v=2 or v=3 at the studied photolysis laser wavelengths.
Detailed photodissociation dynamics clearly rely on the knowledge of the fi ne structures on the potential energy surface.Theoreticians have paid much attention to the photodissociation of N2O in UV region. Schinke et al.performed a series of studies on various topics of the N2O photodissociation in UV region,including the potential energy surface and absorption spectrum[28,29],isotope dependence[30],andthe contribution of triplet states[31].In 1980s,Hopper performed an extensive theoretical calculation on the potential energy surfaces of N2O in a wide energy range of 0−13 eV.The ground electronic state of N2O has a linear NNO structure and was labeled asin the C∝vsymmetry and 11A′in the Cssymmetry. Theoretical calculation in Ref.[4]performed by Hopper suggests that thechannel is correlated with thestate of N2O.While thetransition is optically allowed.The upper D(1Σ+g)state can be e ff ectively populated by the VUV light source.The primary)products are populated at lower vibrational states which are mainly formed via a parallel dissociation in a linear geometry.The corresponding β values are very high(close to 2.0).On the other hand,theproducts at higher excited vibrational states have smaller β values.This is consistent with the previous observation [26]at other wavelengths near 128 nm.It is remarkable that for thechannel,the quantum number of the most populated vibrational state gets larger as the photolysis wavelength increases:the most populated vibrational state changed from v=1 at 125.55 nm[21]to v=3 at 135.30 nm.When the wavelength increases to 136.43 nm,the v=3 and v=2 states become comparable, suggesting that the dissociation dynamics of N2O varies considerably across the electronic absorption band.In addition,we carefully checked the peak position of each vibration states in the TKER.It is found that as the vibrational quantum number increases,the peak position shift more towards a hotter rotational distribution.For instance,at the photolysis wavelength of 134.20 nm,the energy shift for the v=7 state is about 100 cm−1compared to the situation when the rotational structure is supposed to be the same as the v=0 state.Therefore, this shift clearly demonstrates that the highly excited vibrational states are formed via a more bent transition state.

FIG.4 Relative population for individual vibrational states in the
IV.CONCLUSION
Photodissociation dynamics of N2O have been studied by the time-sliced ion velocity imaging technique with the tunable VUV laser light.The total kinetic release distributions and the angular distributions of the O(1S0)product channels were acquired at three photodissciation wavelengths of 134.20,135.30,and 136.43 nm.Photolysis wavelength dependent product anisotropy parameters as well as product branching ratios have been determined.It is found that the most populated vibrational states are mainly at v=2 and v=3 when the wavelength increases to 136.43 nm,suggesting that the dissociation dynamics of N2O vary considerably across the electronic absorption band.The anisotropy parameters change quite dramatically with the vibrational quantum number.The results show that the photodissociation processes are primarily governed by a parallel dissociation in a linear geometry, while the N2products in excited vibrational states are clearly formed via a more bent transition state.This is consistent with the shift of the most intense rotational distributions in the TKER as the vibrational quantum number increases.The results shown here provide a quantitative picture of vibrational state speci fi c photodissociation dynamics for the N2O molecule in the VUV region.
V.ACKNOWLEDGMENTS
This work was supported by the National Natural Science Foundation of China(No.21403207 and No.21473173),the China Postdoctoral Science Foundation(No.2014M551810 and No.2015T80659),and the University of Science and Technology of China.We thank Jia-yue Yang,Tian-gang Yang and Wei-qing Zhang for stimulated discussions.
[1]R.P.Wayne,Chemistry of Atmospheres,2nd ed,New York:Oxford University Press.(1991).
[2]P.J.Crutzen,Q.J.R.Met.Soc.96,320(1970).
[3]P.J.Crutzen,J.Geophys.Res.76,7311(1971).
[4]D.G.Hopper,J.Chem.Phys.80,4290(1984).
[5]A.Chutjian and G.A.Segal,J.Chem.Phys.57,3069 (1972).
[6]M.N.Daud,G.G.Balint-Kurti,and A.Brown,J. Chem.Phys.122,054305(2005).
[7]J.Li and A.J.C.Varandas,J.Chem.Phys.141, 084307(2014).
[8]T.Nishide and T.Suzuki,J.Phys.Chem.A 108,7863 (2004).
[9]D.J.Harding,J.Neugebohren,M.Grutter,A.F. Schmidt-May,D.J.Auerbach,T.N.Kitsopoulos,and A.M.Wodtke,J.Chem.Phys.141,054201(2014).
[10]T.F.Hanisco and A.C.Kummel,J.Phys.Chem.97, 7242(1993).
[11]M.S.Johnson,B.D.Billing,A.Gruodis,and M.H.M. Janssen,J.Phys.Chem.A 105,8672(2001).
[12]D.W.Neyer,A.J.R.Heck,and D.W.Chandler,J. Chem.Phys.110,3411(1999).
[13]J.B.Nee,J.C.Yang,P.C.Lee,X.Y.Wang,and C. T.Kuo,J.Phys.B 31,5175(1998).
[14]M.Zeliko ff,K.Watanabe,and E.C.Y.Inn,J.Chem. Phys.21,1643(1953).
[15]L.C.Lee and M.Suto,J.Chem.Phys.80,4718(1984).
[16]G.Black,R.L.Sharpless,T.G.Slanger,and D.C. Lorents,J.Chem.Phys.62,4266(1975).
[17]R.Gilpin and K.H.Welge,J.Chem.Phys.55,975 (1971).
[18]E.J.Stone,G.M.Lawrence,and C.E.Fairchild,J. Chem.Phys.65,5083(1976).
[19]M.F.Witinski,M.Ortiz-Su´arez,and H.F.Davis,J. Chem.Phys.122,174303(2005).
[20]H.M.Lambert,E.W.Davis,O.Tokel,A.A.Dixit, and P.L.Houston,J.Chem.Phys.122,174304(2005).
[21]S.R.Yu,D.F.Yuan,W.T.Chen,X.M.Yang,and X. A.Wang,J.Phys.Chem.A 119,8090(2015).
[22]D.W.Chandler and P.L.Houston,J.Chem.Phys.87, 1445(1987).
[23]A.T.J.B.Eppink and D.H.Park,Rev.Sci.Instrum. 68,3477(1997).
[24]J.J.Lin,W.Shiu,and K.Liu,Rev.Sci.Instrum.74, 2495(2003).
[25]A.G.Smolin,O.S.Vasyutinskii,E.R.Wouters,and A.G.Suits,J.Chem.Phys.121,6759(2004).
[26]M.Brouard,A.P.Clark,C.Vallance,and O.S. Vasyutinskii,J.Chem.Phys.119,771(2003).
[27]V.H.Dibeler,J.Chem.Phys.47,2191(1967).
[28]R.Schinke,J.Suarez,and S.C.Farantos,J.Chem. Phys.133,091103(2010).
[29]R.Schinke,J.Chem.Phys.134,064313(2011).
[30]J.A.Schmidt,M.S.Johnson,and R.Schinke,Atmos. Chem.Phys.11,8965(2011).
[31]R.Schinke,J.A.Schmidt,and M.S.Johnson,J.Chem. Phys.135,194303(2011).
杂志排行

CHINESE JOURNAL OF CHEMICAL PHYSICS的其它文章
- ARTICLE E ffi cient Separation of Ar and Kr from Environmental Samples for Trace Radioactive Noble Gas Detection†
- ARTICLE Spectrum Correction in Study of Solvation Dynamics by Fluorescence Non-collinear Optical Parametric Ampli fi cation Spectroscopy†
- I.INTRODUCTION
- ARTICLE In situ Detection of Amide A Bands of Proteins in Water by Raman Ratio Spectrum†
- ARTICLE Photoelectron Spectroscopy and Density Functional Calculations of TiGen−(n=7−12)Clusters†
- ARTICLE Hermiticity of Hamiltonian Matrix using the Fourier Basis Sets in Bond-Bond-Angle and Radau Coordinates†