ARTICLE Spectrum Correction in Study of Solvation Dynamics by Fluorescence Non-collinear Optical Parametric Ampli fi cation Spectroscopy†
2016-04-08WeiDngJingjingBiLinshuiZhngYuxingWengHeeiKeyofOpticelectronicInformtionndMterilsCollegeofPhysicsSciencendTechnologyHeeiUniversityBoding071002ChinKeyLortoryofSoftMtterPhysicsInstituteofPhysicsChineseAcdemyofScience
Wei Dng,Jing-jing Bi,Lin-shui Zhng∗,Yu-xing Weng∗.Heei Key L of Optic-electronic Informtion nd Mterils,College of Physics Science nd Technology,Heei University,Boding 071002,Chin.Key Lortory of Soft Mtter Physics,Institute of Physics,Chinese Acdemy of Sciences,Beijing 100190,Chin(Dted:Received on July 25,2015;Accepted on Octoer 10,2015)
ARTICLE Spectrum Correction in Study of Solvation Dynamics by Fluorescence Non-collinear Optical Parametric Ampli fi cation Spectroscopy†
Wei Danga,b,Jing-jing Baia,Lian-shui Zhanga∗,Yu-xiang Wengb∗
a.Hebei Key Lab of Optic-electronic Information and Materials,College of Physics Science and Technology,Hebei University,Baoding 071002,China
b.Key Laboratory of Soft Matter Physics,Institute of Physics,Chinese Academy of Sciences,Beijing 100190,China
(Dated:Received on July 25,2015;Accepted on October 10,2015)
Femtosecond time-resolved fl uorescence non-collinear optical parametric ampli fi cation spectroscopy can extract the curve of spectral gain from its parametric super fl uorescence.This unique spectrum correction method enables fl uorescence non-collinear optical parametric ampli fi cation spectroscopy acquiring the genuine transient fl uorescence spectrum of the studied system.In this work we employ fl uorescence non-collinear optical parametric ampli fi cation spectroscopy technique to study the solvation dynamics of DCM dye in ethanol solution,and con fi rm that genuine solvation correlation function and shift of peak frequency can be derived from transient fl uorescence spectra after the spectral gain correction.It demonstrates that fl uorescence non-collinear optical parametric ampli fi cation spectroscopy can bene fi t the research fi elds,which focuses on both fl uorescence intensity dynamics and fl uorescence spectral shape evolution.
Key words:Transient fl uorescence spectrum,Solvation dynamics,Non-collinear optical parametric ampli fi cation,Spectrum correction
†Part of the special issue for“the Chinese Chemical Society’s 14th National Chemical Dynamics Symposium”.
∗Authors to whom correspondence should be addressed.E-mail: zhangls@hbu.edu.cn,yuxiangweng@iphy.ac.cn
I.INTRODUCTION
Time-resolved fl uorescence spectroscopy is one of most popular tools in the fi elds of chemistry,biology,and physics.The time resolution of fl uorescence spectroscopy is determined by its gate duration.To achieve a subpicosecond time resolution,the gate of spectroscopy should be implemented by nonlinear optical processes,including optical kerr e ff ect, sum-frequency generation,and optical parametric ampli fi cation.The corresponding time-resolved fl uorescence spectroscopy are fl uorescence kerr-gating technique[1], fl uorescence up conversion technique[2]and fl uorescence non-collinear optical parametric ampli fication spectroscopy(FNOPAS)[3],respectively.The main advantage of fl uorescence kerr-gating technique is broadband operation,but the time resolution is usually beyond one picosecond due to its slow response of kerr medium[4].The time resolution of fl uorescence up conversion technique is determined by the laser pulse duration,and can usually reach up to 100 fs,even higher. The spectrum coverage of this technique is limited by the acceptance bandwidth of sum-frequency mixing between fl uorescence beam and gate pulse.Typically,the value of spectrum coverage is 10−20 nm in the condition of collinear sum-frequency[5].Thus broadband operation of fl uorescence up conversion technique resorts to the continuous rotation of nonlinear optical crystal[6], which makes the procedure of measurement very complex.FNOPAS can obtain a comparable time resolution with that of fl uorescence up conversion technique. It gates fl uorescence photons and ampli fi es them in energy by a non-collinear optical parametric ampli fi cation process,which can support a broadband phase match [7].The gain bandwidth of 2500 cm−1has been reported by means of a β-barium borate(BBO)crystal of 2 mm thickness[8].Another advantage of FNOPAS is its intrinsic curve of spectral gain,which can be calculated from the spectrum of parametric super fl uorescence.These outstanding properties of FNOPAS are favorable to the research fi elds,where spectral shape evolution is required,i.e.solvation dynamics[9].
In this work,FNOPAS was employed to study the solvation dynamics of DCM dye in ethanol solution.Transient fl uorescence spectra of high quality were acquired for further analyses of solvation dynamics.The shift of peak frequency and solvation correlation function,derived from transient fl uorescence spectra after spectral gain correction,were compared with those from uncorrected transient fl uorescence spectra.Results show that the intrinsic curve of spectral gain can assist FNOPAS to probe genuine information of solvation dynamics.
II.EXPERIMENTS
The DCM ethanol solution(0.3 mmol/L)was excited by the second harmonic generation of the fundamental beam from a Ti:sapphire femtosecond laser.The fl uorescence photons from the DCM solution were gated and ampli fi ed in energy by another second harmonic beam in a BBO crystal of 2 mm thickness.Transient fl uorescence spectra of DCM solution were recorded by a CCD spectrograph.The setup of FNOPAS is schematically presented in Fig.S1(in supplementary materials).
For the FNOPAS technique,its curve of spectral gain can be expressed as a function of wavelength G(λ;α,θ), where α is the angle between the second harmonic gate beam and the fl uorescence beam in the BBO crystal, and θ is the angle between the second harmonic gate beam and the optical axis direction of the BBO crystal[8].During the measurement,the θ should be adjusted carefully by rotating the BBO crystal till obtaining an optimum parametric super fl uorescence generation.Here the optimum parametric super fl uorescence satis fi es two preconditions.First,its spectrum should be broad enough to cover the steady fl uorescence spectrum of DCM.Second,its spectral peak should be close to that of steady fl uorescence spectrum of DCM. The parametric super fl uorescence can be regarded as the stimulated parametric ampli fi cation seeded by the quantum noise[10].
III.RESULTS AND DISCUSSION
It is well known that the parametric super fl uorescence always accompanies the ampli fi cation of fl uorescence photons.When they undergo the same angle α, i.e.,the same exiting direction with respect to the second harmonic gate beam,they would share the same curve of spectral gain G(λ;α,θ).

The spectrum of parametric super fl uorescence can be written in the form where φzp(λ)is the equivalent noise spectrum due to the zero-point fl uctuations,and its power can be treated as hνdν in the bandwidth dν,or(hc2/λ3)dλ in the bandwidth dλ.According to the Eq.(1),the curve of spectral gain G(λ;α,θ)can be calculated with known spectrum of parametric super fl uorescence.We measured the spectrum of the parametric super fl uorescence (Fig.1(a)),which shares the same curve of spectral gain G(λ;α,θ)with that of DCM fl uorescence,and calculated the curve of G(λ;α,θ)−1(Fig.1(a)).From the curve of G(λ;α,θ)−1,we can know that the setup of FNOPAS provides the max gain at about 16782 cm−1 and bandwidth(full width half maximum)2700 cm−1.
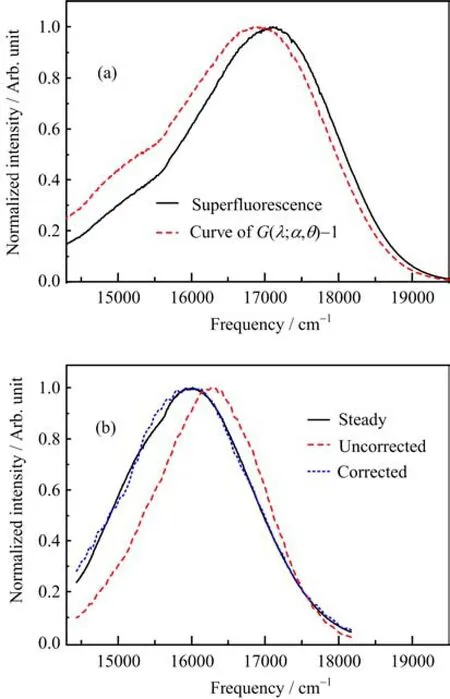
FIG.1(a)Normalized spectrum of parametric super fl uorescence and normalized curve of(G(λ;α,θ)−1).(b)Comparisons between the DCM molecule steady fl uorescence spectrum,corrected and uncorrected transient fl uorescence spectrum at time delay of 36 ps.
Using the curve G(λ;α,θ)−1,we corrected transient fl uorescence spectra of DCM ethanol solution.The validity of this spectrum correction is con fi rmed by the comparability of transient fl uorescence spectrum at the time delay of 36 ps with the steady fl uorescence spectrum(Fig.1(b)).The solvation lifetime of DCM ethanol solution has been reported as about 10 ps[11].It is reasonable to believe that transient fl uorescence spectrum at 36 ps does not su ff er from the solvation process, and generally resembles the steady fl uorescence spectrum of DCM.As shown in Fig.1(b),after the spectral gain correction,transient fl uorescence spectrum at 36 ps displays good agreements with the steady spectrum in both spectral shape and peak frequency.This proves that our spectrum correction is valid.For the uncorrected transient fl uorescence spectrum,its spectral shape is also similar to that of steady fl uorescence spectrum,while the peak frequency has an about 340 cm−1 blue shift.
Solvation is de fi ned as the response of surrounding solvent molecules to an instantaneous perturbation on the solute molecule.After the solute molecule is excited,a dynamic stokes shift occurs to its transient fl uorescence spectra.The magnitude and rate of stokes shift are related with characteristics of the solvent,and can be described by a solvation correlation function
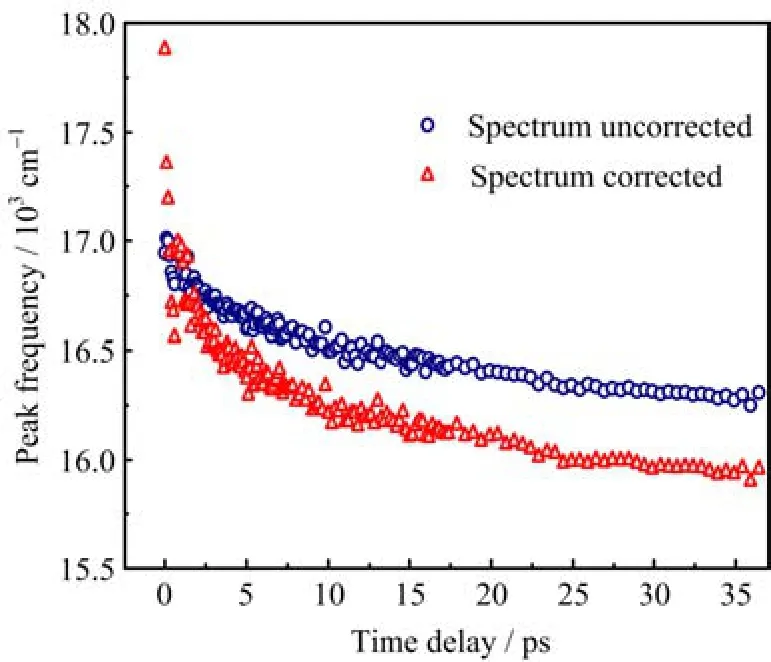
FIG.2 Solvation induced dynamic Stokes shift obtained from transient fl uorescence spectra with spectrum correction and without spectrum correction,respectively.

where ν(t)is the peak frequency(cm−1)of transient fl uorescence spectrum at time delay t.The ν(t)is available from time-resolved fl uorescence spectra,then C(t)can be constructed.
After spectral gain correction,the transient fl uorescence spectra do not display standard Gaussian line shapes,but asymmetric.In order to quantify their peak frequencies ν(t),a log-normal function is used to fi t the transient fl uorescence spectra after spectral gain correction[13],as shown in Fig.S2(in supplementary materials).The shifts of peak frequency ν(t),being derived from the corrected and uncorrected transient fl uorescence spectra,respectively,are compared in Fig.2.In the case of spectral gain correction,the shift of peak frequency is more notable,which starts from about 17880 cm−1,and reaches 15960 cm−1.Whereas for the uncorrected transient fl uorescence spectra,their peak fo rbevqiuo eu ns cmi es is a m raeticnh t b heet rwaene gn e tohfe 1s 7e 0 t 0w0 o− c1a6s2e5s0 r ecsmu −lt 1s . frT o hme spectral gain correction.After the excitation of DCM, transient fl uorescence spectra overlap with the higher frequency part of the curve G(λ;α,θ)−1(Fig.1(a))at fi rst,and move to the lower frequency part of the curve G(λ;α,θ)−1 in the end.Consequently,the scope of peak frequency shift is enlarged by the spectral gain correction.The decay of peak frequency is faster in the fi rst 10 ps(Fig.2)for the corrected transient fl uorescence spectra.Afterwards,decay rates of peak frequency are nearly the same for the transient fl uorescence spectra in both cases.According to the Eq.(2),we calculated the solvation correlation function C(t)for both cases,and fi t them with a double exponential decay model.The fi tting parameters are listed in Table I.
According to the parameters in Table I,we can conclude that solvation correlation function,calculated

TABLE I Fitting parameters of solvation correlation function C(t).
aThe total shift is calculated by the di ff erence between ν(0)and ν(∞).In the case of corrected spectra,the ν(∞) is 15975 cm−1,calculated from the fi tting of steady-state fl uorescence spectrum by the log-normal function.In the cc aa s lce u ol a ft ue nd cfor ro rme c tt eh de sfi p tet c intr g ao,ft ht h ee ν t( r∞an)siisen 1t6 2fl 5u0or cemsc −e 1n , ce spectrum(36 ps)by the log-normal function. from the transient fl uorescence spectra without spectral gain correction,has a slower decay.For the corrected transient fl uorescence spectra,lifetime constants of solvation correlation function are generally consistent with the reported values(0.47 and 10.2 ps)in Ding’s work[11].In Ding’s work,transient fl uorescence spectra of DCM were also acquired by FNOPAS technique, but without spectral gain correction.For their setup of FNOPAS,the curve of spectral gain might be relatively fl at in the range of DCM fl uorescence spectrum,which gives rise to a genuine solvation correlation function. Herein,we calculated the total shift of peak frequency, which is about 1900 cm−1and larger than their reported value(1050 cm−1)[11].This discrepancy is probably induced by di ff erent methods of data processing.
IV.CONCLUSION
Solvation dynamics of DCM ethanol solution was studied by fl uorescence non-collinear optical parametric ampli fi cation spectroscopy technique.Transient fl uorescence spectra of DCM were corrected with the intrinsic curve of spectral gain.Furthermore,the genuine shift of peak frequency and solvation correlation function were extracted from the transient fl uorescence spectra after spectral gain correction.For FNOPAS, the curve of spectral gain can be derived from the spectrum of parametric super fl uorescence.This intrinsic curve of spectral gain is favorable to obtain the genuine transient fl uorescence spectrum of the studied system, and bene fi ts the study of solvation dynamics.
Supplementary materials:Spectrum correction in the study of solvation dynamics by fl uorescence noncollinear optical parametric ampli fi cation spectroscopy is given.
V.ACKNOWLEDGMENTS
This work was supported by the Postdoctoral Project of Hebei University.
[1]D.Kosumi,K.Yanagi,R.Fujii,H.Hashimoto,and M. Yoshizawa,Chem.Phys.Lett.425,66(2006).
[2]A.Cannizzo,O.Br¨am,G.Zgrablic,A.Tortschano ff,A. Ajdarzadeh Oskouei,F.van Mourik,and M.Chergui, Opt.Lett.32,3555(2007).
[3]X.H.Chen,X.F.Han,Y.X.Weng,and J.Y.Zhang, Appl.Phys.Lett.89,061127(2006).
[4]S.Arzhantsev and M.Maroncelli,Appl.Spectrosc.59, 206(2005).
[5]R.Schanz,S.A.Kovalenko,V.Kharlanov,and N.P. Ernsting,Appl.Phys.Lett.79,566(2001).
[6]G.Zgrablic,K.Voitchovsky,M.Kindermann,S. Haacke,and M.Chergui,Biophys.J.88,2779(2005).
[7]G.M.Gale,M.Cavallari,T.J.Driscoll,and F.Hache, Opt.Lett.20,1562(1995).
[8]H.L.Chen,Y.X.Weng,and J.Y.Zhang,J.Opt.Soc. Am.B 26,1627(2009).
[9]M.Sajadi,M.Weinberger,H.A.Wagenknecht,and N.P.Ernsting,Phys.Chem.Chem.Phys.13,17768 (2011).
[10]D.A.Kleinman,Phys.Rev.174,1027(1968).
[11]Q.Ding,K.Meng,H.Yang,S.F.Wang,and Q.H. Gong,Opt.Commun.284,3110(2011).
[12]M.Maroncelli and G.R.Fleming,J.Chem.Phys.86, 6221(1987).
[13]D.B.Siano and D.E.Metzler,J.Chem.Phys.51,1856 (1969).
杂志排行
CHINESE JOURNAL OF CHEMICAL PHYSICS的其它文章
- ARTICLE E ffi cient Separation of Ar and Kr from Environmental Samples for Trace Radioactive Noble Gas Detection†
- REVIEW Polarization Dependent Time-Resolved Infrared Spectroscopy and Its Applications†
- ARTICLE Reactions of Group V Metal Atoms with Hydrogen Sul fi de:Argon Matrix Infrared Spectra and Theoretical Calculations†
- ARTICLE Structural Dynamics of Phenyl Azide in Light-Absorbing Excited States: Resonance Raman and Quantum Mechanical Calculation Study†
- ARTICLE Structural and Infrared Spectroscopic Study on Solvation of Acetylene by Protonated Water Molecules†
- ARTICLE Excited-State Proton Transfer and Decay in Hydrogen-Bonded Oxazole System:MS-CASPT2//CASSCF Study†