The Correlation between Different Fruiting Branch Diameters of Actinidia chinensis and Fruit Quality Change in Post-ripening Period
2016-01-12,,,,
, , , ,
Guizhou Institute of Sericulture Pepper, Zunyi 563006, China
1 Introduction
Actinidiachinensisbelongs to Actinidiaceae, has more than 54 species, and is originally from Wuduhe Town, Yiling District, Yichang City, Hubei Province. It distributes to East Asia and Southeast Asia, and China is main production area ofA.chinensis, which has more than 52 species.A.chinensisin China distributes from Northeast to Hainan Island and from Tibet to Taiwan, and mainly distributes in the south of Qinling and the east of Hengduan Mountain. The fruit could be eaten, and has unique flavor and abundant vitamine C. In Guizhou, fruit garden area in 2011 reached 112680 hm2, and fruit yield reached 1.2803 million tons, in whichA.chinensisyield reached 1700 thousand tons, which increased by 30.7% than 2010[1].A.chinensisindustry developed fast and has become one pillar industry of agricultural economy in Guizhou fruit tree main production region, which made active contribution to promoting farmer income increase and enlarging employment of urban and rural residents, and improving eco-environment. Guizhou Plateau is in the south of Yangtze River and is a beautiful and magical place, with green mountain, clean water, white cloud, moderate latitude and height[2]. Such eco-environment advantage and natural resource advantage provide good condition for deciduous fruit tree growth, includingA.chinensistree. In latter period of the 1990s, with optimization and adjustment of agricultural industry structure,A.chinensisindustry of Guizhou developed fast. But GuizhouA.chinensisindustry had many problems, such as unreasonable variety structure, uneven fruit quality, low management level, and low fruit yield and quality, which seriously inhibited the development ofA.chinensisproduction in Guizhou Province[3]. Although Jin Fanglunetal. reported introduction cultivation test and cultivation technology ofA.chinensis[4-8], and Zeng Rongetal. studied fruit quality change ofA.chinensisduring storage period[9-14], there was no report about the correlation between different fruit branch diameters ofA.chinensisand its fruit quality change during post-ripening period. Hence, we studied the correlation between different fruit branch diameters of "GuichangA.chinensis" and its fruit quality change during post-ripening period during 2013-2015, which aimed to understand the influence factors ofA.chinensisfruit quality change during post-ripening period and mechanism. The research could provide accurate theoretic basis for improving management level ofA.chinensisfruit in post-ripening period andA.chinensisfruit quality, and reference for making scientific management technology and measure ofA.chinensisfruit during post-ripening period.
2 Test materials and methods
2.1TestvarietyTestA.chinensisvariety was "GuichangA.chinensis", which was introduced by original Guizhou Fruit Tree Research Institute.
2.2BasicsituationoftestgardenTest site was in fruit garden of Guizhou Institute of Sericulture Pepper, and test variety was "GuichangA.chinensis". The altitude is 880 m, and annual average temperature is 14.9 ℃. Summer maximum temperature is 38.4 ℃, and average temperature in the hottest month (July) is 25.8 ℃. Winter minimum temperature is -3.0 ℃, and average temperature in the coldest month (January) is 3.0 ℃, and ≥10 ℃ of effective accumulative temperature is 4938 ℃. Annual rainfall is 1040 mm, which mainly distributes in summer. Test site is south typical yellow soil, with insufficient fertility, deep soil layer (generally more than 1.0 m) and pH of 5.5-6.5. Irrigation mainly depends on rainwater. Test variety was planted in spring of 2001, with plant spacing of 3.0 m×3.0 m. There were 75 plants in 667 m2, and the ratio of male and female plants was 8-9∶ 1. High-standard garden construction method was used to rationally plant seedlings, that is, digging planting ditch and fertilizing base fertilizer. In 1-2 months before plantation, planting ditch was dug, with 0.8 m deep and 0.8 m wide. The dug surface and deep-layer soils are stacked respectively. When backfilling, surface soil was firstly filled at bottom layer, then the mixed middle-layer soil and base fertilizer, finally deep-layer soil was filled on the surface, which was 25 cm higher than ground surface. All varieties were managed according to high-level cultivation management technology ofA.chinensistree, and the key was enhancing soil, fertilizer and water management, using sector tree shape, and rational flower and fruit thinning management.A.chinensistree started to fruit in 2003, and was just at full bearing period now.
2.3TestmethodTest design and data investigation: representative tree was selected, and there were three repeats. Fruiting branch of each tree was selected according to test requirement, which was marked. According to test requirement, top fruit was left. During 2013-2015, fruiting branch diameter was investigated when picking fruit. During 15-20 days of fruit post-ripening, single fruit weight, longitudinal diameter of fruit, wide transverse diameter of fruit, thick transverse diameter of fruit, fruit core width and sugar content of fruit juice were investigated.
2.4StatisticalanalysismethodMicrosoft Office software was used for statistics and analysis of the measured data, mainly containing correlation analysis, regression analysis and the establishment of regression equation.
3 Results and analyses
3.1Correlationcoefficientanalysis
3.1.1Correlation level. When pickingA.chinensisfruit, fruiting branch diameter was highly positive correlation with number of fruit ventricle, significantly positive correlation with single fruit weight when picking fruit and the indexes after fruit post-ripening (single fruit weight, loss rate of single fruit weight, longitudinal diameter of fruit and fruit core width), lowly positive correlation with sugar content of fruit juice, and positive correlation with thick transverse diameter of fruit after fruit post-ripening. When picking fruit, single fruit weight was highly positive correlation with the indexes after fruit post-ripening(single fruit weight, longitudinal diameter of fruit, wide transverse diameter of fruit and fruit core width), and significantly positive correlation with loss rate of single fruit weight, thick transverse diameter of fruit, fruit core width, number of fruit ventricle and sugar content of fruit juice after fruit post-ripening. Single fruit weight after fruit post-ripening was highly positive correlation with other indexes. Loss rate of single fruit weight after fruit post-ripening was significantly positive correlation with longitudinal diameter of fruit, thick transverse diameter of fruit, fruit core length and number of fruit ventricle fruit post-ripening, lowly positive correlation with fruit core width, and significantly positive correlation with sugar content of fruit juice. Longitudinal diameter of fruit after fruit post-ripening was highly positive correlation with thick transverse diameter of fruit after fruit post-ripening, significantly positive correlation with thick transverse diameter of fruit, fruit core length, fruit core width and number of fruit ventricle after fruit post-ripening, and lowly positive correlation with sugar content of fruit juice. Wide transverse diameter of fruit after post-ripening was significantly positive correlation with fruit core length, fruit core width and number of fruit ventricle, and lowly positive correlation with thick transverse diameter of fruit and sugar content of fruit juice. Thick transverse diameter of fruit after fruit post-ripening was significantly positive correlated with fruit core length, lowly positive correlation with number of fruit ventricle and sugar content of fruit juice, and positive correlation with fruit core width. Fruit core length was significantly positive correlation with fruit core width and number of fruit ventricle, and lowly positive correlation with sugar content of fruit juice. Fruit core width was highly positive correlation with number of fruit ventricle and sugar content of fruit juice. Number of fruit ventricle was significantly positive correlation with sugar content of fruit juice (Table 1).
3.1.2Significant difference level. When pickingA.chinensisfruit, fruiting branch diameter had extremely significant difference with number of fruit ventricle, significant difference with width of fruit core and insignificant difference with other indexes.
3.2RegressionanalysisRegression analysis between fruiting branch diameter when picking fruit and single fruit weight, longitudinal diameter of fruit, wide transverse diameter of fruit, thick transverse diameter of fruit, fruit core length and sugar content of fruit juice after fruit post-ripening was conducted.
3.2.1The relationship between fruiting branch diameter and single fruit weight after fruit post-ripening.
(i) Regression statistics:standard error was 12.4248.
(ii)Variance analysis:residual of SS was 1543.7510, residual of MS was 154.3751,SignificanceFvalue was 0.0743 (Table 2).
Table1Thecorrelationcoefficient

ContentFruitingbranchdiameterSinglefruitweightwhenpickingFruitafterpost-ripeningSinglefruitweigthLossrateofsinglefruitLongitudinaldiameterWidetransversediameterThicktransversediameterFruitcoreLengthWidthVentriclenumberSugarcontentoffruifjuiceFruitingbranchdiameter10.5563**0.5332**0.5492**0.5468**0.4021*0.18110.3532*0.7294**0.8137**0.4406*Singlefruitweightwhenpicking0.5563**10.9936***0.7196**0.8924***0.8604***0.5979**0.9267***0.7203**0.7907**0.5634**Singlefruitweight0.5332**0.9936***10.6385**0.8985***0.8736***0.5449**0.9237***0.7307**0.7876**0.5784**Lossrateofsinglefruit0.5492**0.7196**0.6385**10.5875**0.5006**0.7323**0.6368**0.4110*0.5647**0.2506Longitudinaldiameteroffruit0.5468**0.8924***0.8985***0.5875**10.8824***0.5841**0.8753***0.6311**0.7783**0.3556*Widetransversediameteroffruit0.4021*0.8604***0.8736***0.5006**0.8824***10.4382*0.7771**0.5440**0.7157**0.3173*Thicktransversediameteroffruit0.18110.5979**0.5449**0.7323**0.5841**0.4382*10.5764**0.27320.4848*0.3173*Lengthoffruitcore0.3532*0.9267***0.9237***0.6368**0.8753**0.7771**0.5764**10.5663**0.5786**0.3966*Widthoffruitcore0.7294**0.7203**0.7307**0.4110*0.6311**0.5440**0.27320.5663**10.8843***0.8167***Ventriclenumber0.8137***0.7907**0.7876**0.5647**0.7783**0.7157**0.4848*0.5786**0.8843***10.6700**Sugarcontentoffruitjuice0.4406*0.5634**0.5784**0.25060.3556*0.3172*0.3173*0.3966*0.8167***0.6700**1
Note:***,**and*respectively showed the high, significant and low correlation levels.
Table2Varianceanalysisbetweenfruitingbranchdiameterandsinglefruitweightafterfruitpost-ripening

ItemdfSSMSFvalueSignificanceFRegressionanalysis1613.1177613.11773.97160.0743Residual101543.7510154.3751Total112156.8690
(iii)Analysis on residual curve, curve of observed value, curve of predicted value and normal probability chart.
Residual curve, observed value curve, predicted value curve and normal probability chart between fruiting branch diameter and single fruit weight were shown as Fig.1-Fig.3. Quadratic curve regression equation and linear regression equation were used for comparative analysis. R of quadratic curve regression equation was bigger than that of linear regression equation, and its results all corresponded with quadratic curve rule. Correlation coefficients of residual curve, observed value curve, predicted value curve and normal probability chart respectively showed significantly positive correlation, significantly positive correlation, highly significant positive correlation and highly positive correlation, and significant difference levels were respectively insignificant difference, significant difference, significant difference and significant difference(Table 3).

Fig.1Residual

Fig.2Curvesofobservationandpredictivevalues

Fig.3Normalprobabilityplot
Table3Straightlineandquadraticcurveanalysis

ItemFittingwayRegressionequationDeterminationcoefficientCorrelationindex(R)ResidualStraightliney=-0.1563x+1.01570.00230.4780Quadraticcurvey=-0.559x2+7.111x-15.9410.27240.5219**ObservedvalueStraightliney=-2.2129x+81.8920.32470.5696Quadraticcurvey=-0.4985x2+4.2679x+66.770.47850.6917**PredictivevalueStraightliney=-2.0567x+80.8770.98660.9933Quadraticcurvey=0.0605x2-2.843x+82.7120.99450.9972***NormalprobabilityplotStraightliney=3.836x+42.5740.97560.9877Quadraticcurvey=0.1265x2+2.1915+46.4110.98550.9927***
Note:***,**and*respectively showed the high, significant and low correlation levels.
3.2.2The relationship between fruiting branch diameter and longitudinal diameter of fruit after fruit post-ripening.
(i)Regression statistics:standard error was 4.2731.
(ii)Variance analysis:residual of SS was 182.5941,residual of MS was 18.2594,SignificanceFvalue was 0.0658 (Table 4).
Table4Varianceanalysisbetweenfruitingbranchdiameterandlongitudinaldiameteroffruitafterfruitpost-ripening

ItemdfSSMSFvalueSignificanceFRegressionanalysis177.892677.89264.26590.0658Residual10182.594118.2594Total11260.4867
(iii)Analysis on residual curve, curve of observed value, curve of predicted value and normal probability chart.
Residual curve, observed value curve, predicted value curve and normal probability chart between fruiting branch diameter and longitudinal diameter of fruit were shown as Fig.4-Fig.6. Quadratic curve regression equation and linear regression equation were used for comparative analysis. R of quadratic curve regression equation was bigger than that of linear regression equation, and its results all corresponded with quadratic curve rule. Correlation coefficients of residual curve, observed value curve, predicted value curve and normal probability chart respectively showed significantly positive correlation, significantly positive correlation, highly positive correlation and highly positive correlation, and significant difference levels were all significant difference, significant difference, significant difference and significant difference(Table 5).
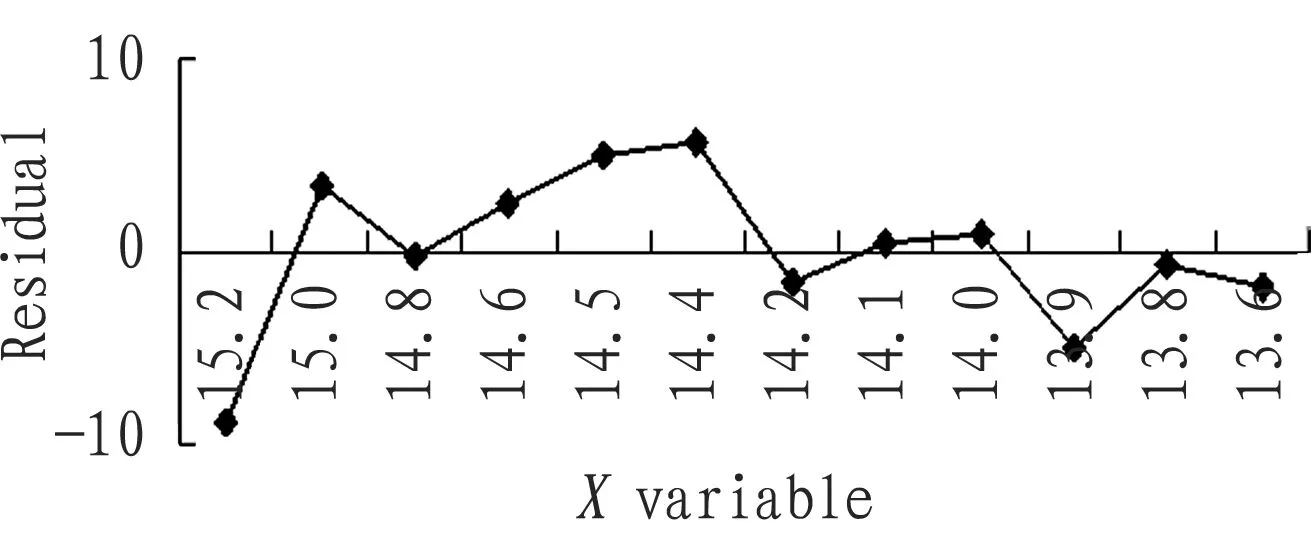
Fig.4Residual
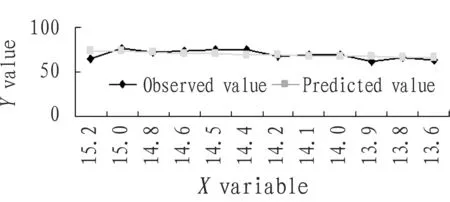
Fig.5Observationandpredictivevalues
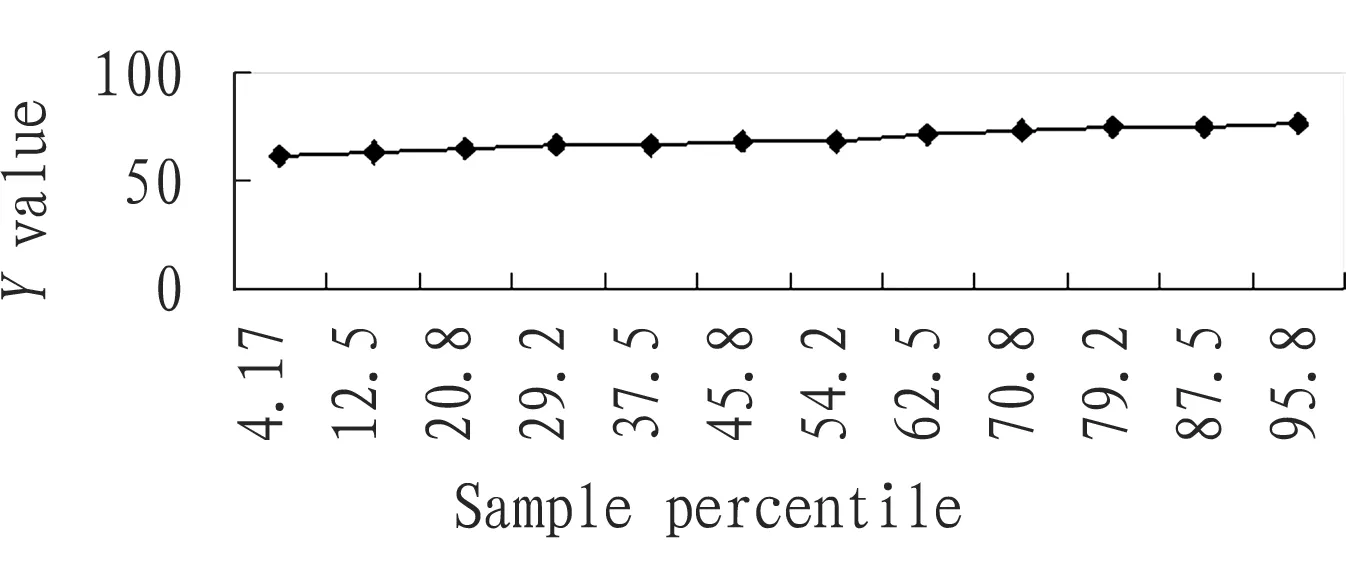
Fig.6Normalprobabilityplot
Table5Straightlineandquadraticcurveanalysis

ItemFittingwayRegressionequationDeterminationcoefficientCorrelationindex(R)ResidualStraightliney=-0.0732x+0.4760.00420.06481Quadraticcurvey=-0.2193x2+2.7778x-6.17650.35580.5965**ObservationvalueStraightliney=-0.8063x+74.7080.35690.5074Quadraticcurvey=-0.1978x2+1.7645x+68.7090.55730.7465**PredictivevalueStraightliney=-0.7331x+74.2320.98660.9933Quadraticcurvey=-0.0215x2-1.0134x+74.8860.99450.9972***NormalprobabilityplotStraightliney=1.3364x+60.780.98040.9902Quadraticcurvey=0.0098x2+1.2091x+61.0770.98090.9904***
Note:***,**and * respectively showed the high, significant and low correlation levels.
3.2.3The relationship between fruiting branch diameter and wide transverse diameter of fruit after fruit post-ripening.
(i)Regression statistics:standard error was 2.6452.
(ii)Variance analysis:residual of SS was 69.9709, residual of MS was 6.9971, SignificanceFvalue was 0.1950 (Table 6).
Table6Varianceanalysisbetweenfruitingbranchdiameterandwidetransversediameteroffruitafterfruitpost-ripening

ItemdfSSMSFvalueSignificanceFRegressionanalysis113.495713.49571.92880.1950Residual1069.97096.9971Total1183.4667
(iii)Analysis on residual curve, curve of observed value, curve of predicted value and normal probability chart.
Residual curve, observed value curve, predicted value curve and normal probability chart between fruiting branch diameter and wide transverse diameter of fruit were shown as Fig.7-Fig.9. Quadratic curve regression equation and linear regression
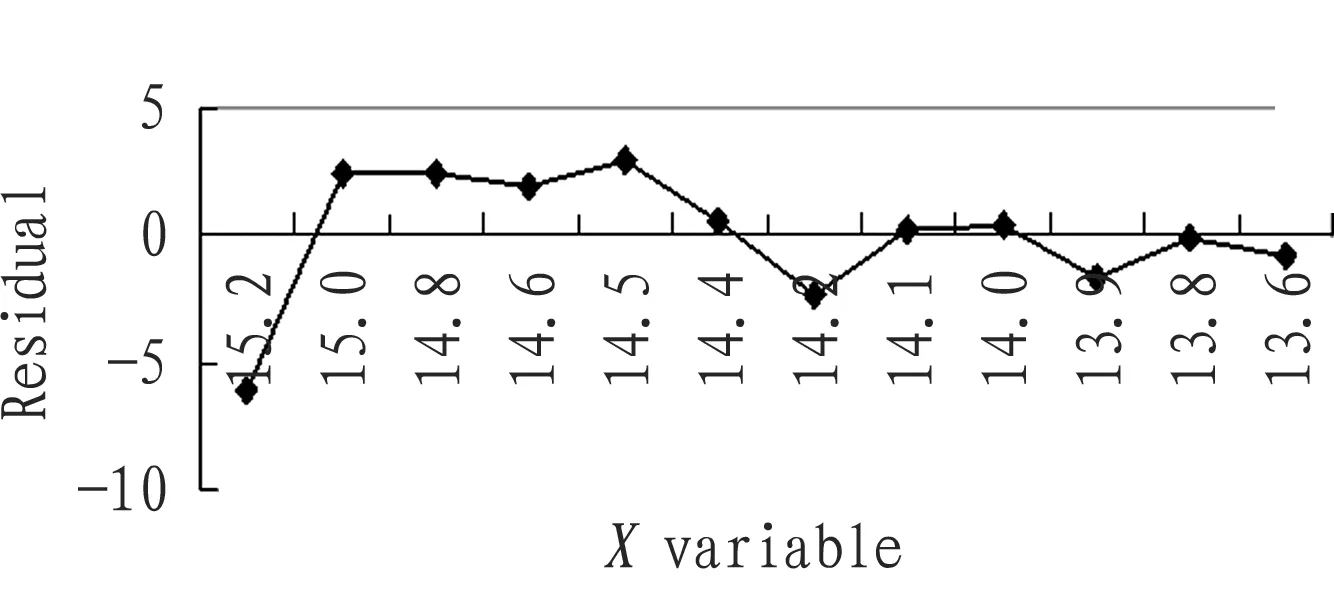
Fig.7Residual

Fig.8Observationandpredictivevalues
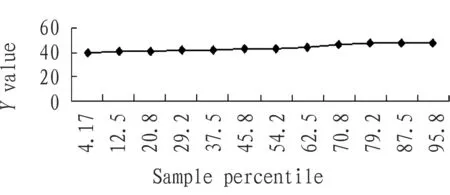
Fig.9Normalprobabilityplot
equation were used for comparative analysis. R of quadratic curve regression equation was bigger than that of linear regression equation, and its results all corresponded with quadratic curve rule. Correlation coefficients of residual curve, observed value curve, predicted value curve and normal probability chart respectively showed lowly positive correlation, significantly positive correlation, highly positive correlation and highly positive correlation, and significant difference levels were respectively insignificant difference, significant difference, significant difference and significant difference(Table 7).
Table7Straightlineandquadraticcurveanalysis

ItemFittingwayRegressionequationDeterminationcoefficientCorrelationindex(R)ResidualStraightliney=0.0417x+0.27120.00360.0600Quadraticcurvey=-0.0964x2+1.212x-2.65410.18100.4254*ObservationvalueStraightliney=-0.3469x+46.0210.20610.4540Quadraticcurvey=-0.0875x2+0.7902x+43.3680.32840.5731**PredictivevalueStraightliney=-0.3051x+45.750.98660.9933Quadraticcurvey=0.009x2-0.4218x+46.0220.99450.9972***NormalprobabilityplotStraightliney=0.7531x+38.8710.97180.9856Quadraticcurvey=-0.012x2+0.5967x+39.2360.97410.9870***
Note:***,**and * respectively showed the high, significant and low correlation levels.
3.2.4The relationship between fruiting branch diameter and thick transverse diameter of fruit after fruit post-ripening
(i)Regression statistics:standard error was 2.0260.
(ii)Variance analysis:residual of SS was 41.0451,residual of MS was 4.1045,SignificanceFvalue was 0.5733 (Table 8).
Table8Varianceanalysisbetweenfruitingbranchdiameterandthicktransversediameteroffruitafterfruitpost-ripening

ItemdfSSMSFvalueSignificanceFRegressionanalysis11.39161.39160.33900.5733Residual1041.04514.1045Total1142.4367
(iii)Analysis on residual curve, curve of observed value, curve of predicted value and normal probability chart.
Residual curve, observed value curve, predicted value curve and normal probability chart between fruiting branch diameter and thick transverse diameter of fruit were shown as Fig.10-Fig.12. Quadratic curve regression equation and linear regression equation were used for comparative analysis. R of quadratic curve regression equation was bigger than that of linear regression equation, and its results all corresponded with quadratic curve rule. Correlation coefficients of residual curve, observed value curve, predicted value curve and normal probability chart respectively showed positive correlation, positive correlation, highly positive correlation and highly positive correlation, and significant difference levels were respectively insignificant difference, insignificant difference, significant difference and significant difference(Table 9).
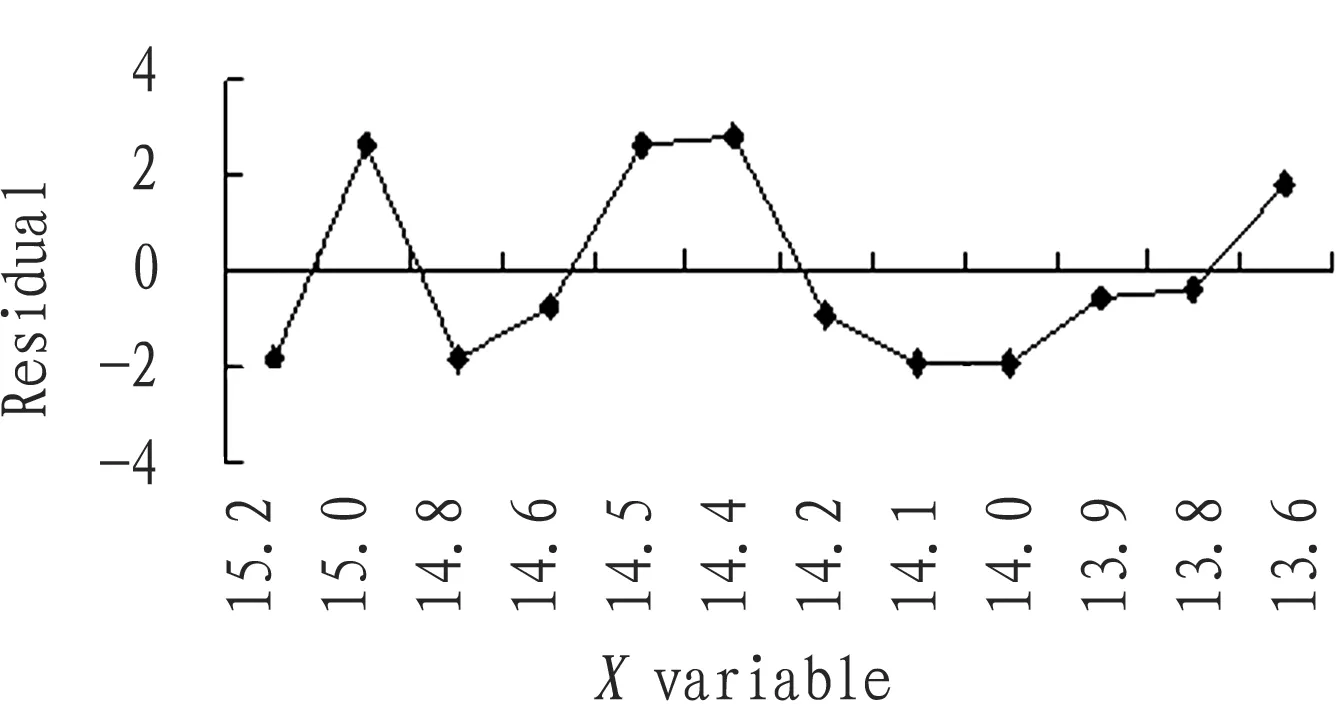
Fig.10Residual
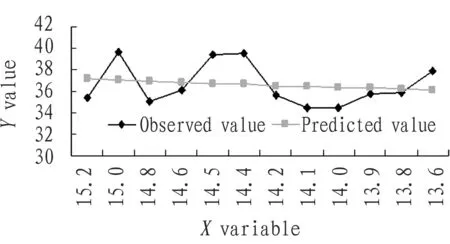
Fig.11Observationandpredictivevalues
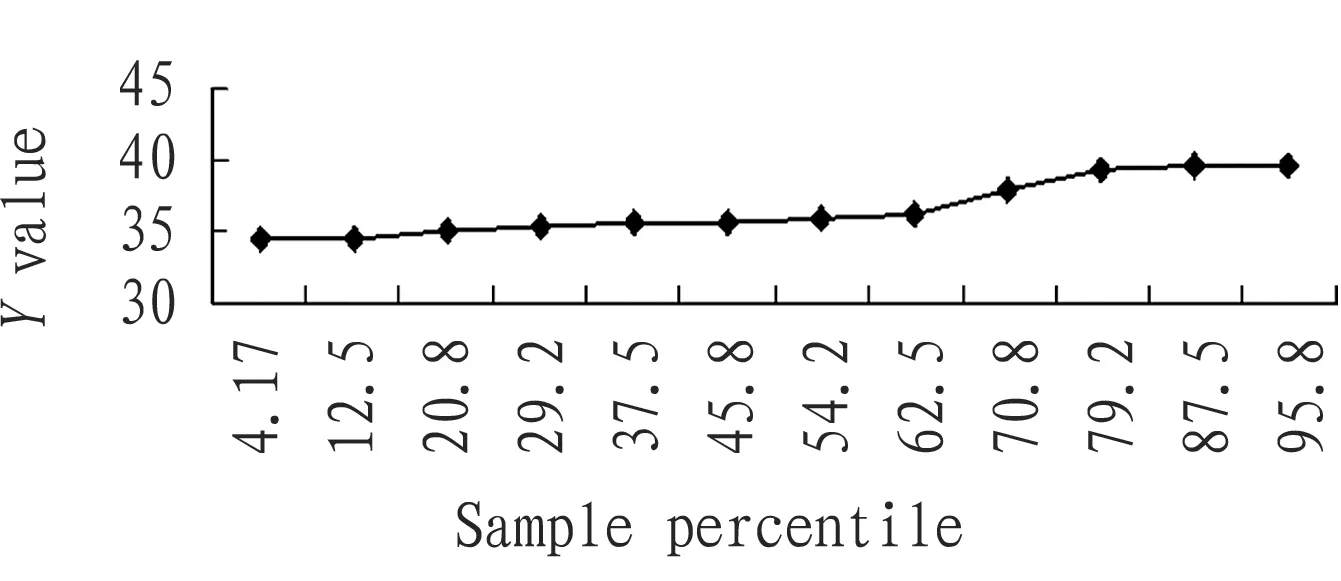
Fig.12Normalprobabilityplot
Table9Straightlineandquadraticcurveanalysis

ItemFittingwayRegressionequationDeterminationcoefficientCorrelationindex(R)ResidualStraightliney=0.0013x+0.00860.00010.0100Quadraticcurvey=0.0023x2+0.0307x+0.07720.00020.0141ObservationvalueStraightliney=-0.0983x+37.2620.03320.1822Quadraticcurvey=-0.0051x2-0.1662x+37.4180.03410.1847PredictivevalueStraightliney=-0.098x+37.2540.98660.9933Quadraticcurvey=0.0029x2-0.1354x+37.3410.99450.9972***NormalprobabilityplotStraightliney=0.5119x+33.2890.88300.9397Quadraticcurvey=-0.0426x2-0.042x+34.5820.94010.9696***
Note:***,**and*respectively showed the high, significant and low correlation levels.
3.2.5The relationship between fruiting branch diameter and fruit core length after fruit post-ripening.
(i)Regression statistics:standard error was 0.1337.
(ii)Variance analysis:residual of SS was 0.1789,residual of MS was 0.0179,SignificanceFvalue was 0.2600 (Table 10).
Table10Varianceanalysisbetweenfruitingbranchdiameterandfruitcorelengthafterfruitpost-ripening

ItemdfSSMSFvalueSignificanceFRegressionanalysis10.02550.02551.42560.2600Residual100.17890.0179Total110.2044
(iii)Analysis on residual curve, curve of observed value, curve of predicted value and normal probability chart.
Residual curve, observed value curve, predicted value curve and normal probability chart between fruiting branch diameter and fruit core length were shown as Fig.13-Fig.15. Quadratic curve regression equation and linear regression equation were used for comparative analysis. R of quadratic curve regression equation was bigger than that of linear regression equation, and its results all corresponded with quadratic curve rule. Correlation coefficients of residual curve, observed value curve, predicted value curve and normal probability chart respectively showed lowly positive correlation, significantly positive correlation, highly positive correlation and highly positive correlation, and significant difference levels were respectively insignificant difference, significant difference, significant difference and significant difference(Table 11).
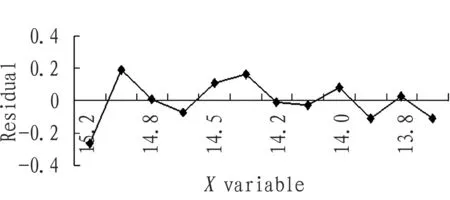
Fig.13Residual

Fig.14Observationandpredictivevalues
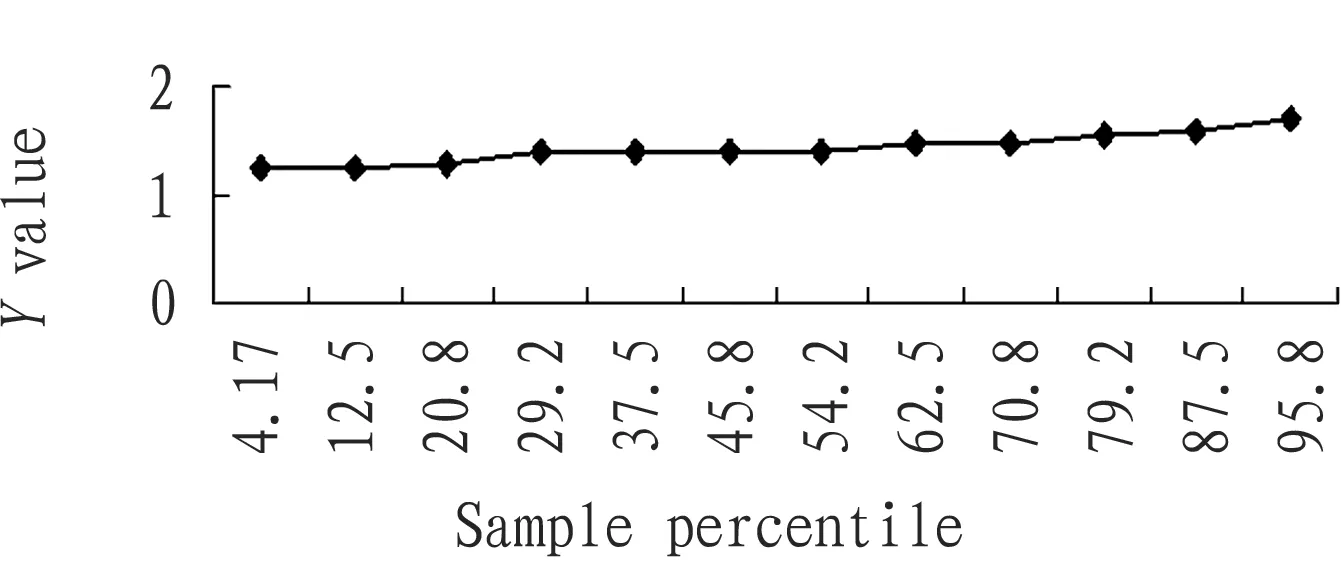
Fig.15Normalprobabilityplot
Table11Straightlineandquadraticcurveanalysis

ItemFittingwayRegressionequationDeterminationcoefficientCorrelationindex(R)ResidualStraightliney=-0.0011+0.00740.00100.0316Quadraticcurvey=-0.0085x2+0.0743x-0.16870.25250.5025**ObservationvalueStraightliney=-0.0144x+1.5220.14520.3811Quadraticcurvey=-0.0054x2+0.056x+1.35770.33670.5803**PredictivevalueStraightliney=-0.0133x+1.51450.98660.9933Quadraticcurvey=0.0004x2-0.0183x+1.52640.99450.9972***NormalprobabilityplotStraightliney=0.037x+1.18790.95760.9786Quadraticcurvey=0.0013x2+0.0197x+1.22820.96910.9844***
Note:***,**and*respectively showed the high, significant and low correlation levels.
3.2.6The relationship between fruiting branch diameter and sugar content of fruit juice after fruit post-ripening.
(i)Regression statistics:standard error was 1.0035.
(ii)Variance analysis:residual of SS was 10.0695,residual of MS was 1.0070,SignificanceFvalue was 0.1517 (Table 12).
Table12Varianceanalysisbetweenfruitingbranchdiameterandsugarcontentoffruitjuiceafterfruitpost-ripening

ItemdfSSMSFvalueSignificanceFRegressionanalysis12.42612.42612.40940.1517Residual1010.06951.0070Total1112.4956
(iii)Analysis on residual curve, curve of observed value, curve of predicted value and normal probability chart.
Residual curve, observed value curve, predicted value curve and normal probability chart between fruiting branch diameter and sugar content of fruit juice were shown as Fig.16-Fig.18. Quadratic curve regression equation and linear regression equation were used for comparative analysis. R of quadratic curve regression equation was bigger than that of linear regression equation, and its results all corresponded with quadratic curve rule. Correlation coefficients of residual curve, observed value curve, predicted value curve and normal probability chart respectively showed lowly positive correlation, significantly positive correlation, highly positive correlation and highly positive correlation, and significant difference levels were respectively insignificant difference, significant difference, significant difference and significant difference(Table 13).
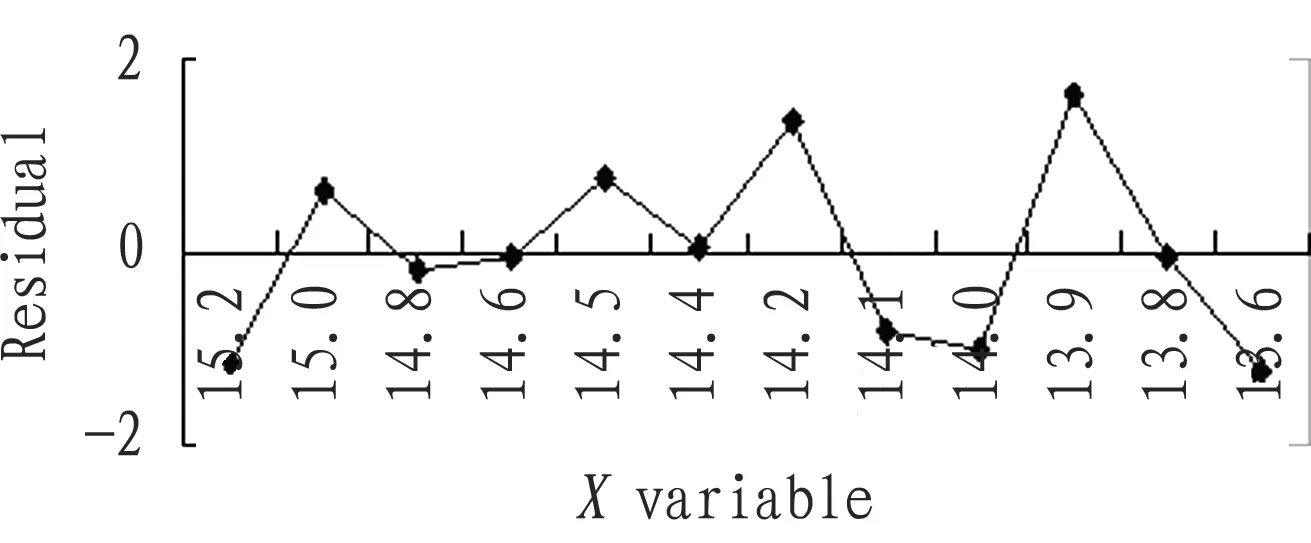
Fig.16Residual

Fig.17Observationandpredictivevalues
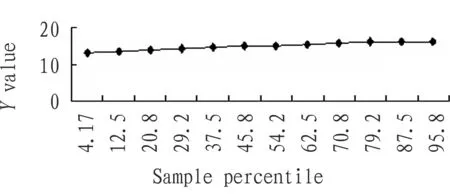
Fig.18Normalprobabilityplot
Table13Straightlineandquadraticcurveanalysis

ItemFittingwayRegressionequationDeterminationcoefficientCorrelationindex(R)ResidualStraightliney=-0.0075x+0.04880.00080.0283Quadraticcurvey=-0.0357x2+0.4564x-1.03360.16960.4118*ObservationvalueStraightliney=-0.1369x+15.9520.21440.4630Quadraticcurvey=-0.0319x2+0.2776x+14.9850.32300.5683**PredictivevalueStraightliney=-0.1294x+15.9030.98660.9933Quadraticcurvey=0.0038x2-0.1788x+16.0190.99450.9972***NormalprobabilityplotStraightliney=0.29x+13.1770.96270.9812Quadraticcurvey=-0.0131x2+0.461x+12.7780.98110.9905***
Note:***,**and*respectively showed the high, significant and low correlation levels.
4 Conclusions and discussions
4.1Analysisoncorrelationcoefficient(i)Correlation level. Fruiting branch diameter ofA.chinensisshowed highly positive correlation with number of fruit ventricle, significantly positive correlation with single fruit weight when picking and the indexes after fruit post-ripening(single fruit weight, loss rate of single fruit weight, longitudinal diameter of fruit and fruit core width), lowly positive correlation with sugar content of fruit juice after fruit post-ripening, and positive correlation with thick transverse diameter of fruit after fruit post-ripening.(ii) Significant difference level. Fruiting branch diameter ofA.chinensishad extremely significant difference with number of fruit ventricle, significant difference with fruit core width, and insignificant difference with other indexes. It illustrated that the larger the fruiting branch diameter, the bigger the indexes after fruit post-ripening, such as single fruit weight, longitudinal diameter of fruit and fruit core width and number of fruit ventricle. That is to say, fruiting branch diameter had the maximum influence on fruit core width and number of fruit ventricle, followed by single fruit weight and longitudinal diameter of fruit, and then sugar content of fruit juice.
4.2RegressionanalysisRegression analysis between fruiting branch diameter ofA.chinensisand single fruit weight, longitudinal diameter of fruit, wide transverse diameter of fruit, thick transverse diameter of fruit, fruit core length and sugar content of fruit juice after fruit post-ripening was conduced, and results were as below. (i)Standard errors were respectively 12.4248, 4.2731, 2.6452, 2.0260, 0.1337 and 1.0035.(ii)Difference levels were 0.0743, 0.0658, 0.1950, 0.5733, 0.2600 and 0.1517, that is, fruiting branch diameter ofA.chinensishad significant difference with thick transverse diameter of fruit, and insignificant difference with other indexes.(iii)Quadratic curve regression equation and linear regression equation of residual curve, curve of observed value, curve of predicted value and normal probability chart were analyzed, and the results all corresponded with the rule of quadratic curve. It illustrated that fruiting branch diameter had the maximum influence on fruit core width and number of fruit ventricle after fruit post-ripening, followed by single fruit weight and longitudinal diameter of fruit, and then fruit core length, wide transverse diameter of fruit and sugar content of fruit juice.
The influence of fruiting branch diameter ofA.chinensison its fruit quality change in post-ripening period by other analysis methods also needed further research. When pickingA.chinensisfruit, fruiting branch diameter directly affected single fruit weight, loss rate of single fruit weight, longitudinal and transverse diameters of fruit, fruit core length, fruit core width, number of fruit ventricle and sugar content of fruit juice after fruit post-ripening. It further illustrated that the larger the fruiting branch diameter, the bigger the indexes, such as single fruit weight, longitudinal and transverse diameters of fruit, fruit core length, fruit core width, number of fruit ventricle and sugar content of fruit juice after post-ripening. That is to say, fruiting branch diameter had the maximum influence on fruit core width and number of fruit ventricle, followed by single fruit weight and longitudinal diameter of fruit, and then sugar content of fruit juice, which may be related to internal factors of fruiting branch ofA.chinensis. Fruiting branch with different diameters had different nutrient conditions, which inevitably caused difference of the indexes after post-ripening, such as single fruit weight, longitudinal diameter of fruit, wide transverse diameter of fruit, thick transverse diameter of fruit, fruit core length, fruit core width, number of fruit ventricle, and sugar content of fruit juice. The research of Chen Kunsongetal. showed that post-ripening and softening ofA.chinensisafter picking was divided into two stages: softening starting stage and latter fast softening stage. The correlation between storage condition and fruit quality change in post-ripening period, physiological change and fruit quality change in post-ripening period, ethylene and fruit quality change in post-ripening period[9-12]. Jia Decuietal. studied the influences of pre-cooling treatment, picking period and storage temperature onA.chinensisfruit quality change in post-ripening period[13-15]. Jin Fanglunetal. thought that different fruit retention amounts ofA.chinensisat fruiting branch and different fruiting parts directly affected fruit quality change rule in post-ripening period, and was one of key factors for fruit softening and senescence[16-17]. When applying the research result into production, it is suggested that fruiting branch diameter could be as one of important bases ofA.chinensisfruit quality change in post-ripening period. It also could predict the indexes after fruit post-ripening by investigating fruiting branch diameter and regression equation, such as single fruit weight, longitudinal and transverse diameters of fruit, fruit core and sugar content of fruit juice, and provide the reference for making scientific management measures ofA.chinensis.
[1] Guizhou Statistical Yearbook. China agricultural commodity yearbook, 2011,13-9 tea leaf, fruit area and yield:207[Z].(in Chinese).
[2] This Newspaper Commentator. Massive health opens the future[N]. Guizhou Daily, 2015-3-3.2. (in Chinese).
[3] YAO CC, ZHANG LS, LIU XF. The research status of kiwi fruit industry in the world[J]. Northwest Horticulture, 2003(2): 54-55. (in Chinese).
[4] YANG J, HU BC, WU DJ. Analysis on the development and market of kiwi fruit in Guizhou[J]. Southwest Horticulture,1998(4): 20-21. (in Chinese).
[5] HE YP, QIN JQ. A comparison on the biological characteristics of cultivars of actinidia[J]. China Forestry Science and Technology, 2005(3): 38-40. (in Chinese).
[6] WANG YA, XUE Y. On the main varieties and high-quality high-yield cultivation technology of kiwi fruit in China[J].Shanxi Fruits,2001(1): 22-23. (in Chinese).
[7] JIN FL. Biological characteristic of Chinese gooseberry and its planting techniques in Northern Guizhou[J]. Guizhou Agricultural Sciences,2003(3): 13-16. (in Chinese).
[8] JIN FL, LI M, HAN CM. Biological characteristic of Guichang Chinese gooseberry and its cultivation technique with high yield and quality in Qianbei Areas[J]. Guizhou Agricultural Sciences,2009(10): 175-178. (in Chinese).
[9] ZENG R, CHEN JY, LI P. Changes in the indexes of the quality ofActinidiadeliciosaduring ripening[J]. Acta Agriculturae Universitis Jiangxiensis, 2002(5): 587-590. (in Chinese).
[10] CAI JS, WANG ZY, ZENG B. On the change of the quality of kiwifruit fruit during storage period [J]. Deciduous Fruits, 2007(5): 13-15. (in Chinese).
[11] ZHANG HX, NING JL, JI H. Research advances on quality and physiological changes of postharvest fruit[J]. Journal of Hebei Agricultural Sciences,2010(2): 54-56. (in Chinese).
[12] CHEN KS, ZHENG LT, ZHANG SL. On the ripening and softening of ethylene and kiwifruit fruit[J]. Journal of Zhejiang University(Agriculture & Life Sciences),1999(3): 251-254. (in Chinese).
[13] JIA DC, WANG RC, TU HQ,etal. Effects of different pre-cooling treatment on kiwifruit cool storage[J]. Journal of Hunan Agricultural University(Natural Sciences), 2008,34(3): 314-316. (in Chinese).
[14] WU BB, RAO JP, LI BY,etal. Effect of harvest date on fruit quality and storage duration of kiwifruit[J]. Acta Botanica Boreali-Occidentalia Sinica, 2008,28(4): 0788-0792. (in Chinese).
[15] QIAN ZJ, LIU T, WANG H,etal. Effects of harvest stage and storage temperature on quality of ‘Jin Yan’ kiwifruit (Actinidiachinensisx A, eriantha)[J]. Journal of Tropical and Subtropical Botany, 2011,19(2): 127-134. (in Chinese).
[16] JIN FL, FENG SH, ZHANG FW,etal. Effect of different fruit retaining on fruit quality of kiwi at maturation period[J]. Northern Horticulture, 2014(10): 26-30. (in Chinese).
[17] JIN FL, LI M, HAN CM,etal. Effect of different fruit parts on fruit quality of the kiwi at maturation period [J]. Tianjin Agricultural Sciences, 2015,21(6): 99-104,115. (in Chinese).
杂志排行
Asian Agricultural Research的其它文章
- Feasibility Analysis of Agricultural Product Price Index Insurance Based on Pilot Cases
- Forecast on Price of Agricultural Futures in China Based on ARIMA Model
- Model Building for Community Participating in Rural Tourism and Game Analysis of Core Stakeholders
- Embedded Programmable Single Point Multiple Output Intelligent Data Acquisition and Transmission System
- A Study of the Factors that Affect Farmers’ Willingness to Transfer Land in the Central Regions Based on a Survey of 180 Farmers in Suizhou City
- Comparative Study of Cotton Plant Height Difference in the Arid Areas Based on LandSat8 OLI Data
