Comparative Study of Cotton Plant Height Difference in the Arid Areas Based on LandSat8 OLI Data
2016-01-12,*,
, *,
1. College of Earth Sciences and Resources, China University of Geosciences, Beijing 100083, China; 2. College of Information Science and Technology, Shihezi University, Shihezi 832003, China
1 Introduction
Plant height is one of the main characters of cotton, related to cotton growth and yield to a certain extent[1]. Reasonable plant height is an important basis for assessing growth, regulating growth and estimating yield. However, the traditional manual method is still used to measure the cotton plant height currently, lacking timeliness, and it is especially not conducive to large-scale monitoring. As a powerful tool to monitor crop growth or pest and disease, the remote sensing technology has been widely studied and applied, and there are scholars using remote sensing technology for crop plant height monitoring. Sui Xueyanetal.[2]use Modis1-7 band spectral reflectance and vegetation index to estimate the plant height of wheat, and use the plant height of wheat before and after lodging for verification. Li Junlingetal.[3]set up the sample points in the field to obtain the average plant height, leaf area index and population density of maize crop, and employ Modis remote sensing data and NDVI for relational analysis, and results show that NDVI is significantly positively correlated with the average plant height, and the relationship between leaf area index and NDVI can be established to determine the remote sensing indicators for maize growth, thus providing a scientific basis for large-scale remote sensing monitoring of maize plant height. Based on the measured cotton plant height data, this paper makes a quantitative relationship between cotton plant height and spectrum parameters of remote sensing image, studies the correlation between a variety of spectral parameters and cotton plant height, and analyzes the changes in spectral signature of sample points under different plant height, in order to provide theoretical basis and technical support for the application of remote sensing technology in the monitoring of cotton plant height.
2 Overview of the study area and data sources
2.1OverviewofthestudyareaRegiment 105, Division 6 of Production and Construction Corps of Xinjiang is on the edge of China’s second largest desert Gurbantunggut featuring an arid continental climate (Fig. 1). There are rich mineral resources, the average annual precipitation is 120-180 mm and the average annual surface evaporation is 1800-2300 mm[4]. It is Xinjiang’s special early-maturing cotton area, and the cotton planting area accounts for about 50% of annual cotton planting area of Production and Construction Corps of Xinjiang. The cultivar is Xinluzao 62, and 1.25m or 2.05m is commonly used as the spacing.

Fig.1Spatialdistributionofsamplepointsinthestudyarea
2.2Datasourcesanddataprocessing
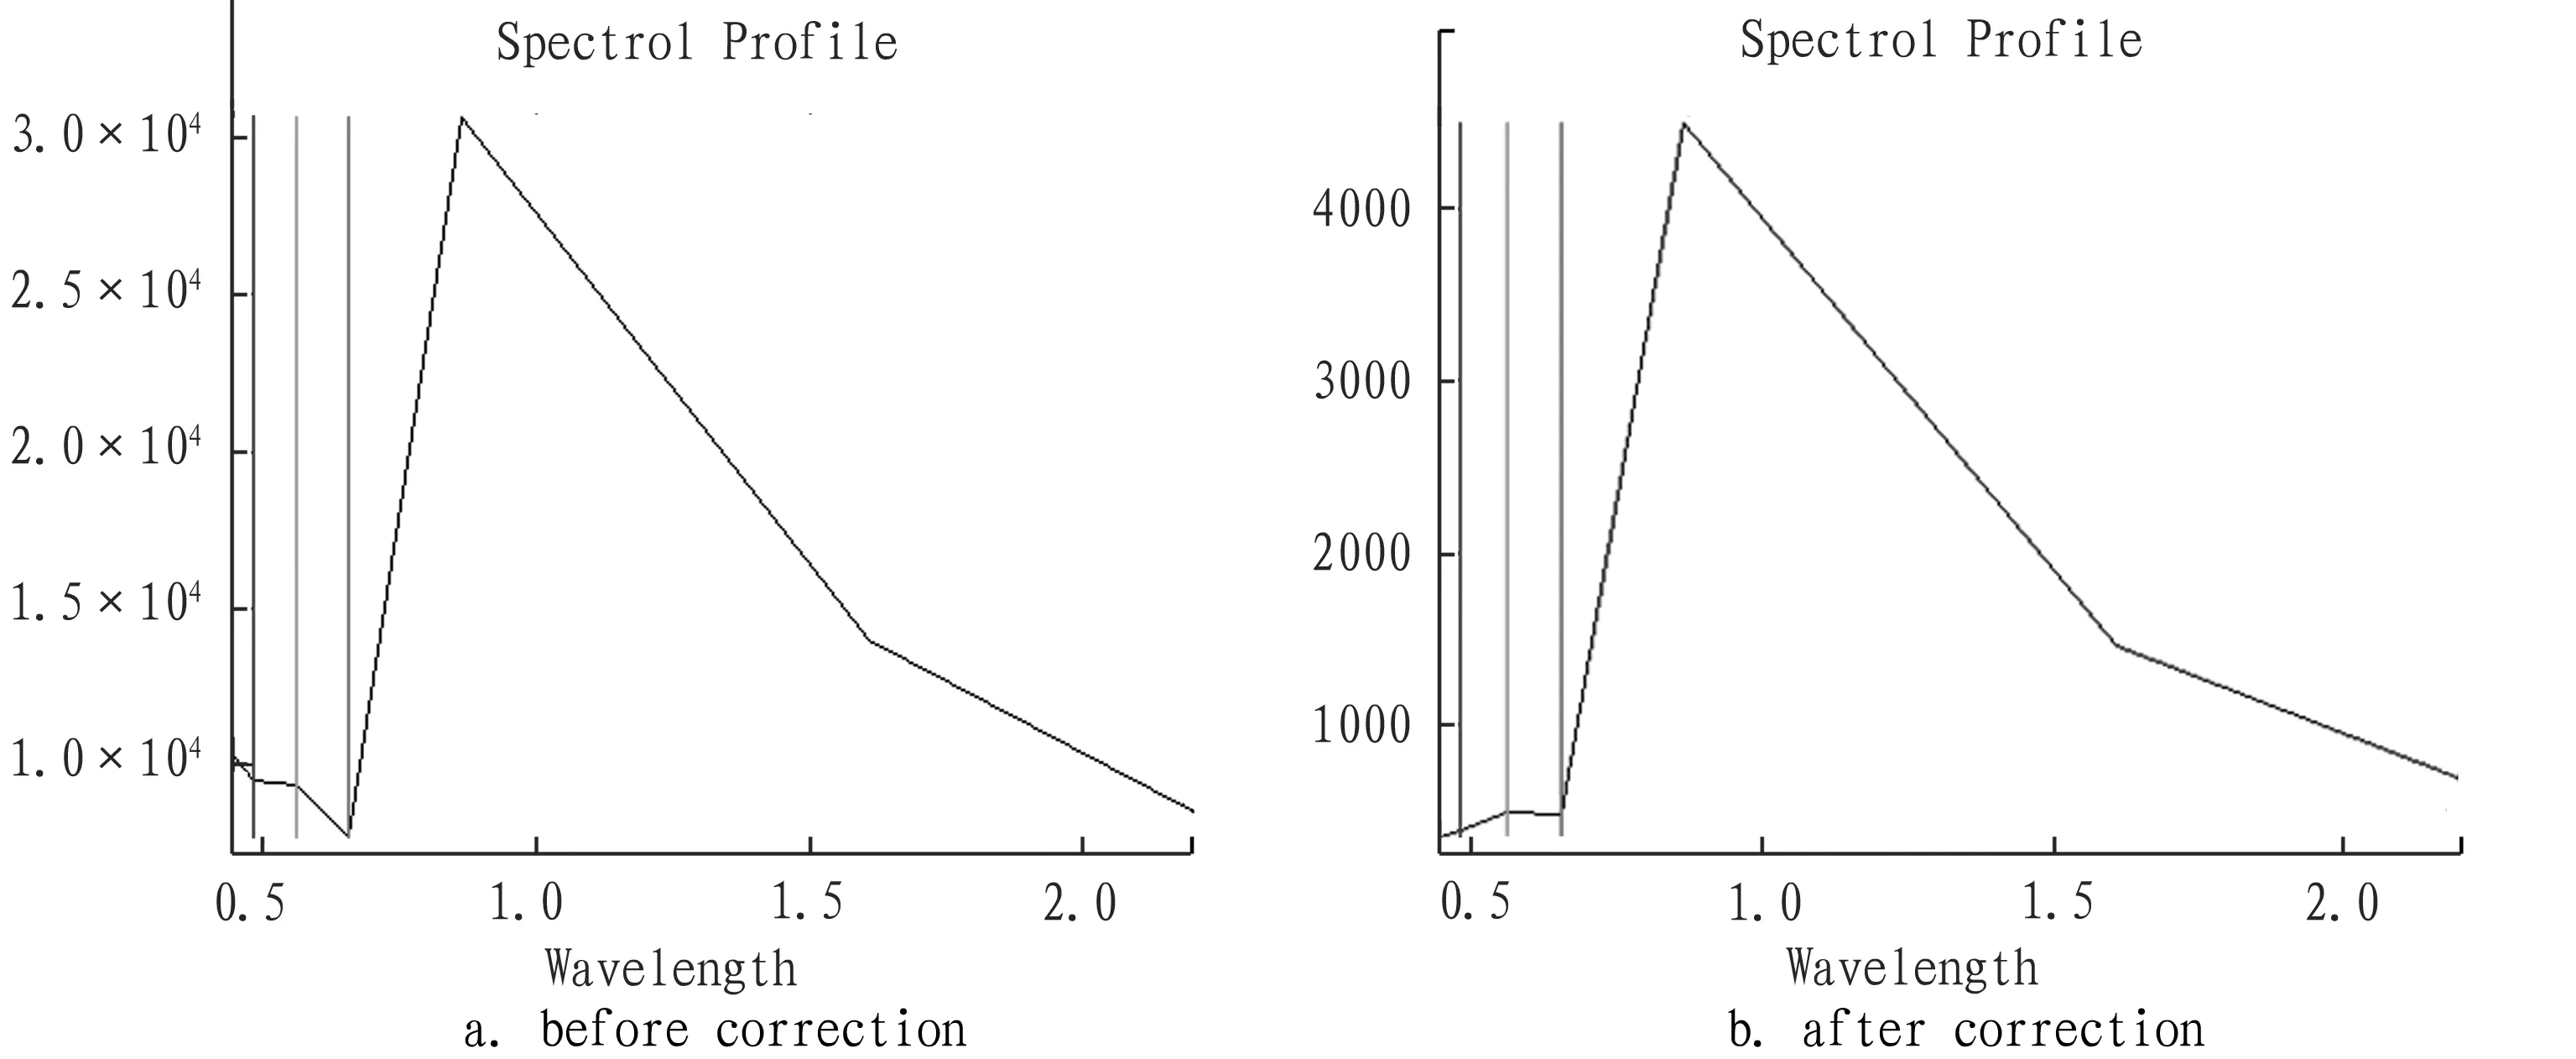
2.2.1Landsat 8 data. The sensor of Landsat8 is the sun-synchronous polar circular orbit, with an orbital altitude of 705 km. The satellite image used in this study was obtained in July 2015, with row number of 143 and column number of 29. The specific parameters are shown in Table 1. The remote sensing image goes through the preprocessing of geometric correction, image fusion and radiation correction, and the software operating environment is ENVI5.2. The geometric correction takes the TM historical image with accurate spatial location as spatial reference. The nearest neighbor method is used for resampling, and Albers projection is adopted. The correction error is controlled within one pixel. The Gram-Schmidt method is used for data fusion on multi-spectral image data and panchromatic waveband, so that the spatial resolution of fused data reaches 15 m. After FLASSH atmospheric correction of image, the boundaries of the study area are used for clipping, to finally get the study area image data. According to Fig. 2, it can be found that the corrected vegetation spectral curve is significantly improved.
Table1Landsat8OLIsensorparameters

SensortypeBandWavelengthrange∥μmSpatialresolution∥mBreadth//km×kmRevisitingperiod∥dLandsat-8OLIBluelight0.45-0.52Greenlight0.53-0.60Redlight0.63-0.68Nearinfrared0.85-0.89Fullcolor0.50-0.683015185×18516

Fig.2Thetypicalvegetationspectralcurvecomparison
2.2.2Measured data. According to the cotton cultivation situation of Division 6 of Production and Construction Corps of Xinjiang in 2015, Regiment 105 was selected as sampling site. Depending on the weather conditions, the fixed-ground testing was conducted on June 24, June 28, July 2, July 5 and July 8, 2015, respectively. Each test point uses the diagonal distribution method, and 30 cotton plants are randomly selected and measured with ruler. The average value is calculated to represent the plant height in the test point[2].
3 Research methods
Based on field test point data, ENVI5.2 is used to calculate the NDVI value of images, and the band operation was used to get LAI value. Using the value extraction function of ArcGIS10.3, NDVI, LAI and B1-B7 pixel value of all sample points is extracted, and the relational analysis is conducted on image spectral characteristics and cotton plant height. The sensitive band and spectrum parameters significantly correlated with cotton plant height are selected[5]to establish linear, logarithmic, quadratic, cubic and power index model, and the most significant regression equation is selected based on R2 value size. The most widely used normalized difference vegetation index (NDVI) is employed, and at the same time, based on previous studies, the leaf area index (LAI) is obtained by calculating NDVI.
3.1NDVINDVI is the ratio of the difference between near infrared band and red light band surface reflectance to the sum of values of the two bands. It is calculated as follows:
(1)
whereρredis red band reflectance (corresponding to the fourth band of LandSat8 image);ρniris near infrared band reflectance (corresponding to the fifth band of LandSat 8 image).
3.2LAILeaf area index (LAI) is an important vegetation canopy structure parameter, and it is the most commonly used composite parameter to describe crop growth in the remote sensing growth monitoring. It is calculated as follows[6]:
LAI=4.639×NDVI+0.01
(2)
3.3KAPPAcoefficientKAPPA coefficient is a method to calculate classification accuracy. It is generally thought to be a more robust measure than simple percent agreement calculation, since KAPPA coefficient takes into account the agreement occurring by chance. The equation fork(KAPPA coefficient) is:
(3)
wherepois the relative observed agreement among raters, andpeis the hypothetical probability of chance agreement, using the observed data to calculate the probabilities of each observer randomly saying each category.
3.4RMSERoot-mean-square error (RMSE) is used to evaluate the deviation between the observed values and the true values. It is calculated as follows:
(4)
whereXestandXobsrepresent the estimated value and observed value of corresponding parameter variables, respectively;Nis the number of variable pairs.
4 Results and analysis
4.1StatisticalanalysisofsamplecharacteristicsBased on field sample collection, the statistical analysis is conducted on the sample characteristics of cotton plant height determined from June 24 to July 8, 2013 (Table 2). There are a total of 18 samples. The maximum plant height is 83.3 cm, the minimum plant height is 29.0 cm, and the average plant height is 57.26 cm. The variance and coefficients of variation are 241.61 and 27.14%, respectively. Through the coefficient of variation, it can be found that the sample point is representative, with moderate variation, and it can be used for follow-up study.
Table2Characteristicstatisticsofthesampleplantheight

DateNumberofsamplepoints(N)Maximum∥cmMinimum∥cmMean∥cmSkewnessKurtosisVarianceCoefficientofvariation(CV)∥%20131883.32957.26-0.1832-0.8386241.627.14
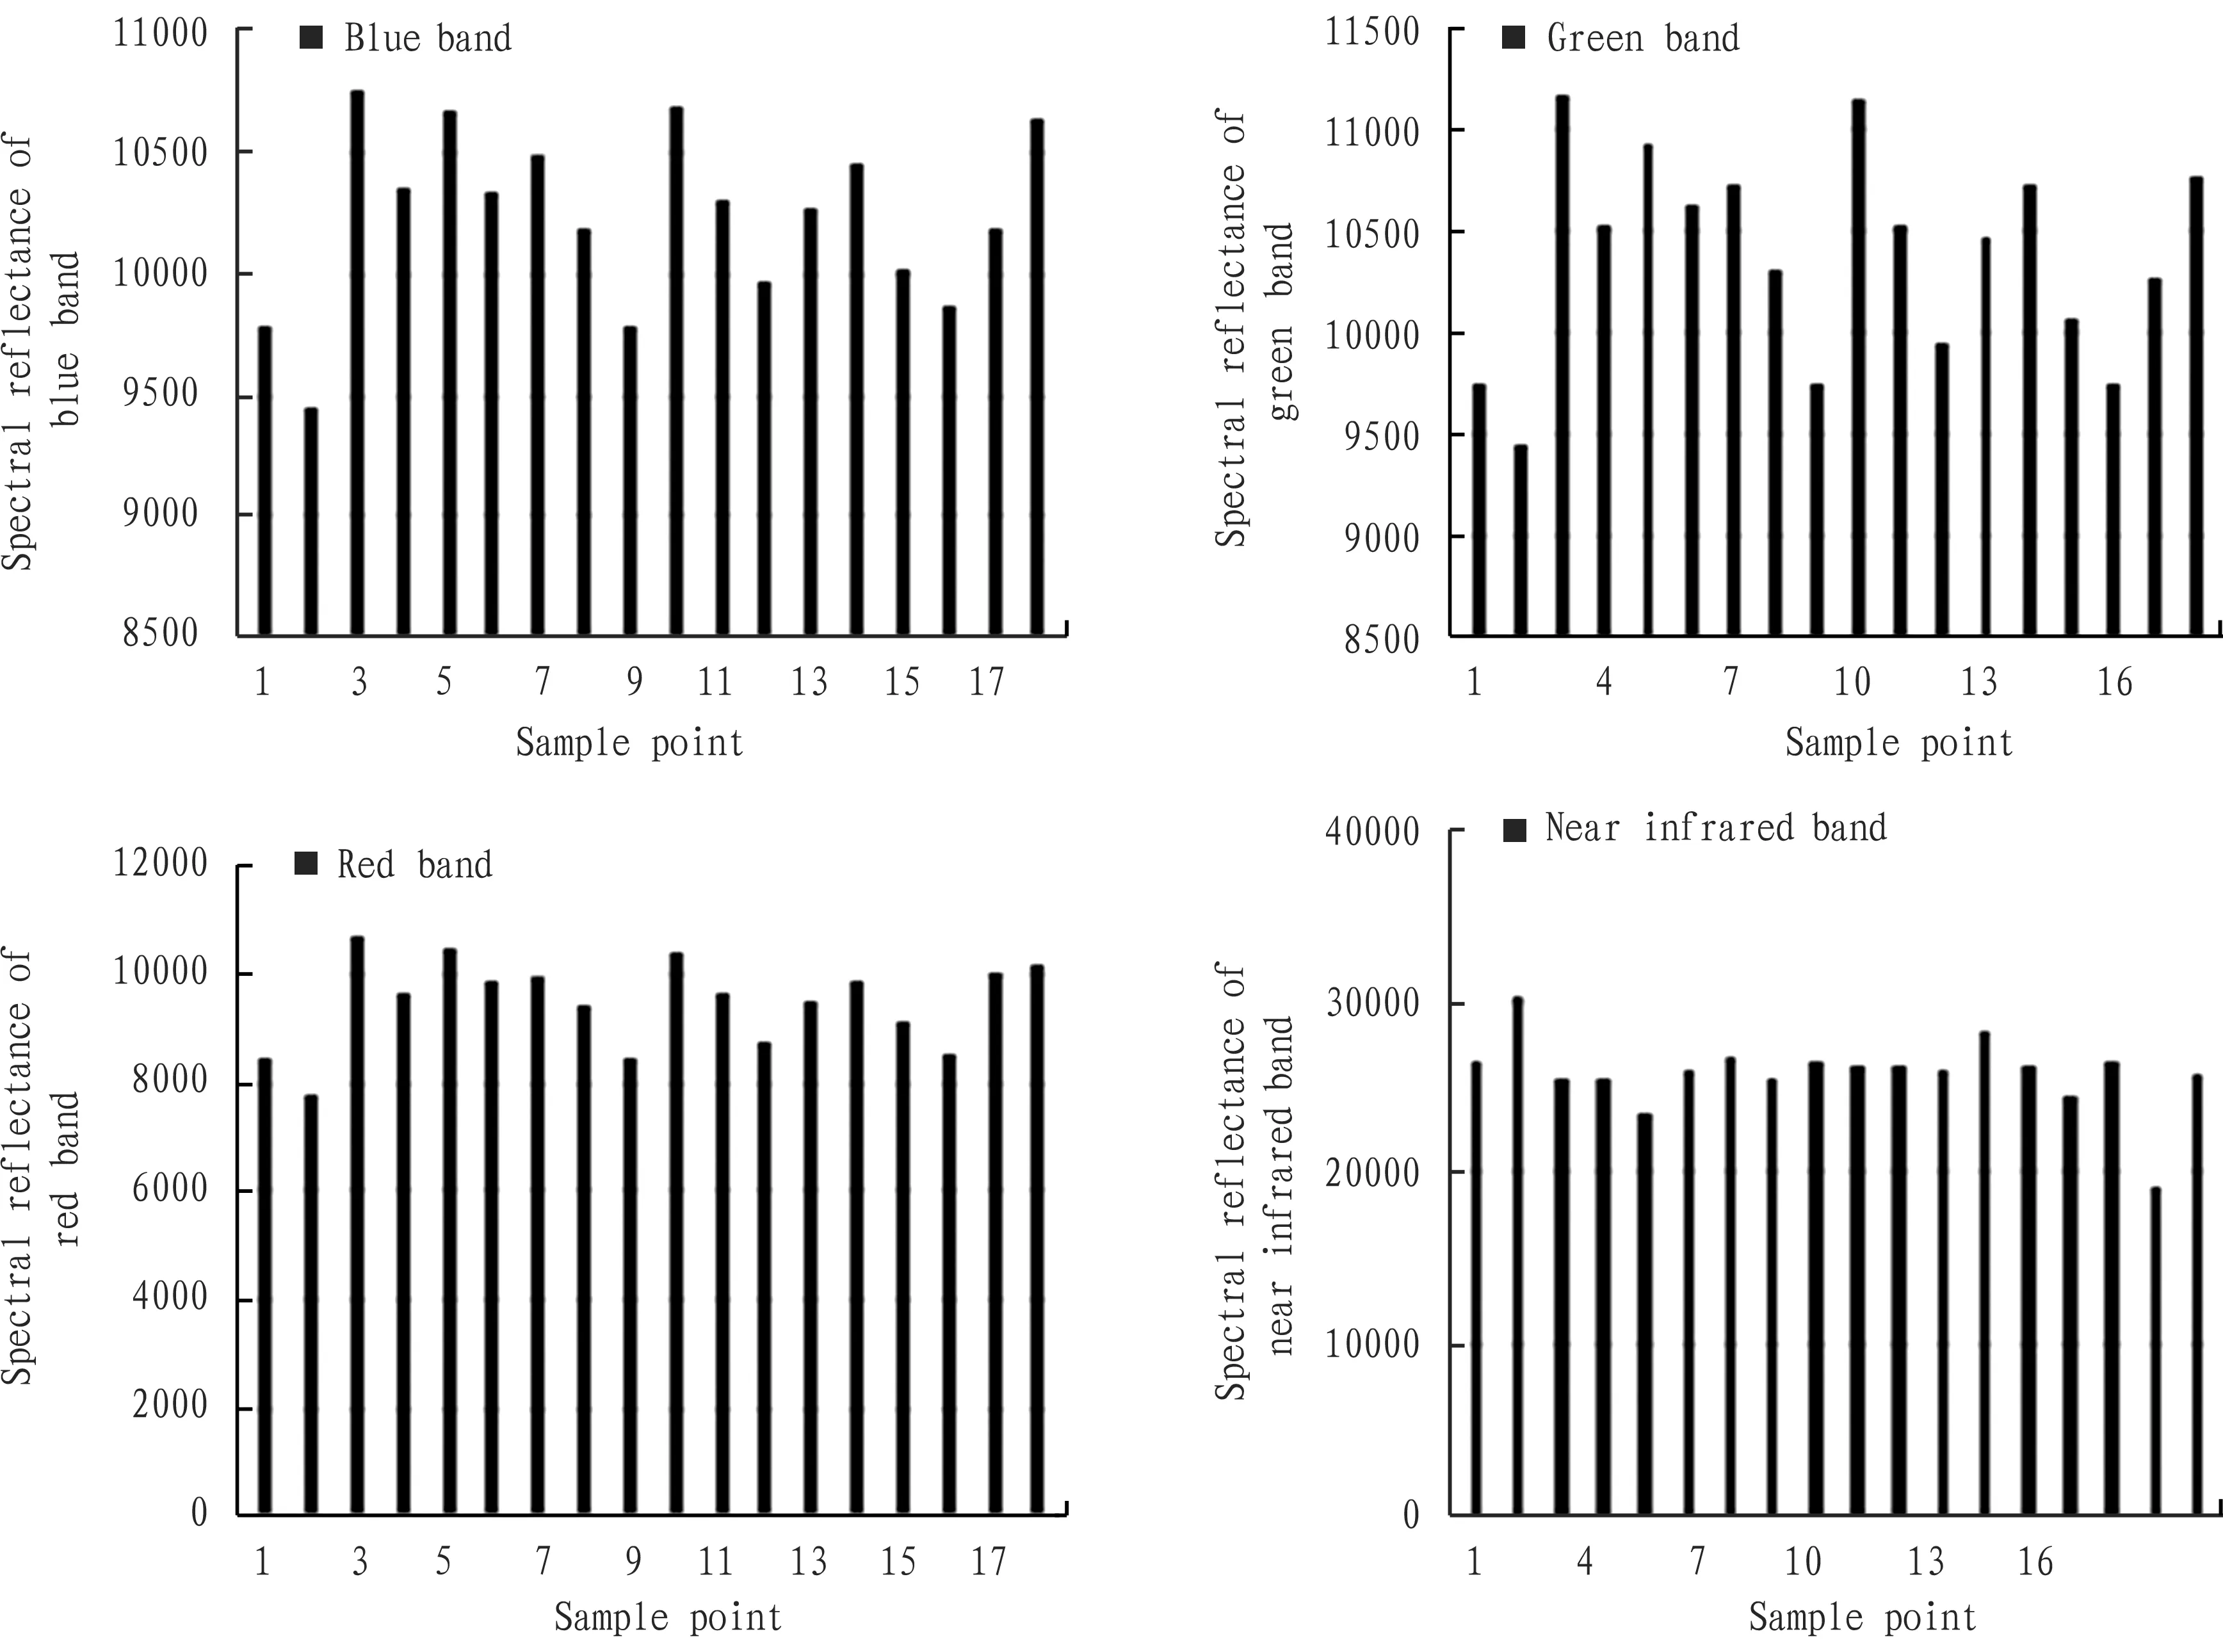
4.2ComparativeanalysisonthespectralreflectanceofmainbandsThere is a trend of gradually rising spectral response in the red, green and blue bands, while the spectral response varies in the near infrared band, and there are fluctuations in the bands of Landsat-8 (Fig. 3).

Fig.3Comparisonofspectralreflectanceindifferentbands
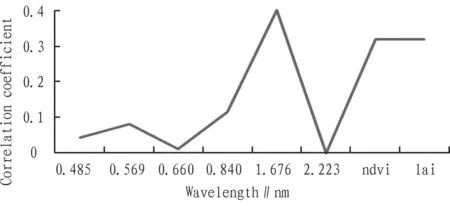
4.3CorrelationbetweencottonplantheightandspectralcharacteristicsThe relational analysis is conducted on the plant height data and spectral reflectance of six bands as well as two vegetation indices. The results are shown in Fig. 4. The figure shows that the correlation coefficient between overall spectral characteristic variables and cotton plant height is not high, and there are great fluctuations, with a minimum value of 0.011 and a maximum value of 0.399. The correlation coefficient is low at 0.485 μm and increases slightly at 0.569 μm. In the red light band, the correlation coefficient reaches the bottom, and then substantially increases with the increase of length. It forms a ridge at 1.676 μm, and reaches the bottom at 2.223 μm. There are great fluctuations in the correlation coefficient between spectral characteristic variables and cotton plant height, but the correlation coefficient between spectral characteristic variables and NDVI or LAI is relatively stable, maintained at about 0.318.
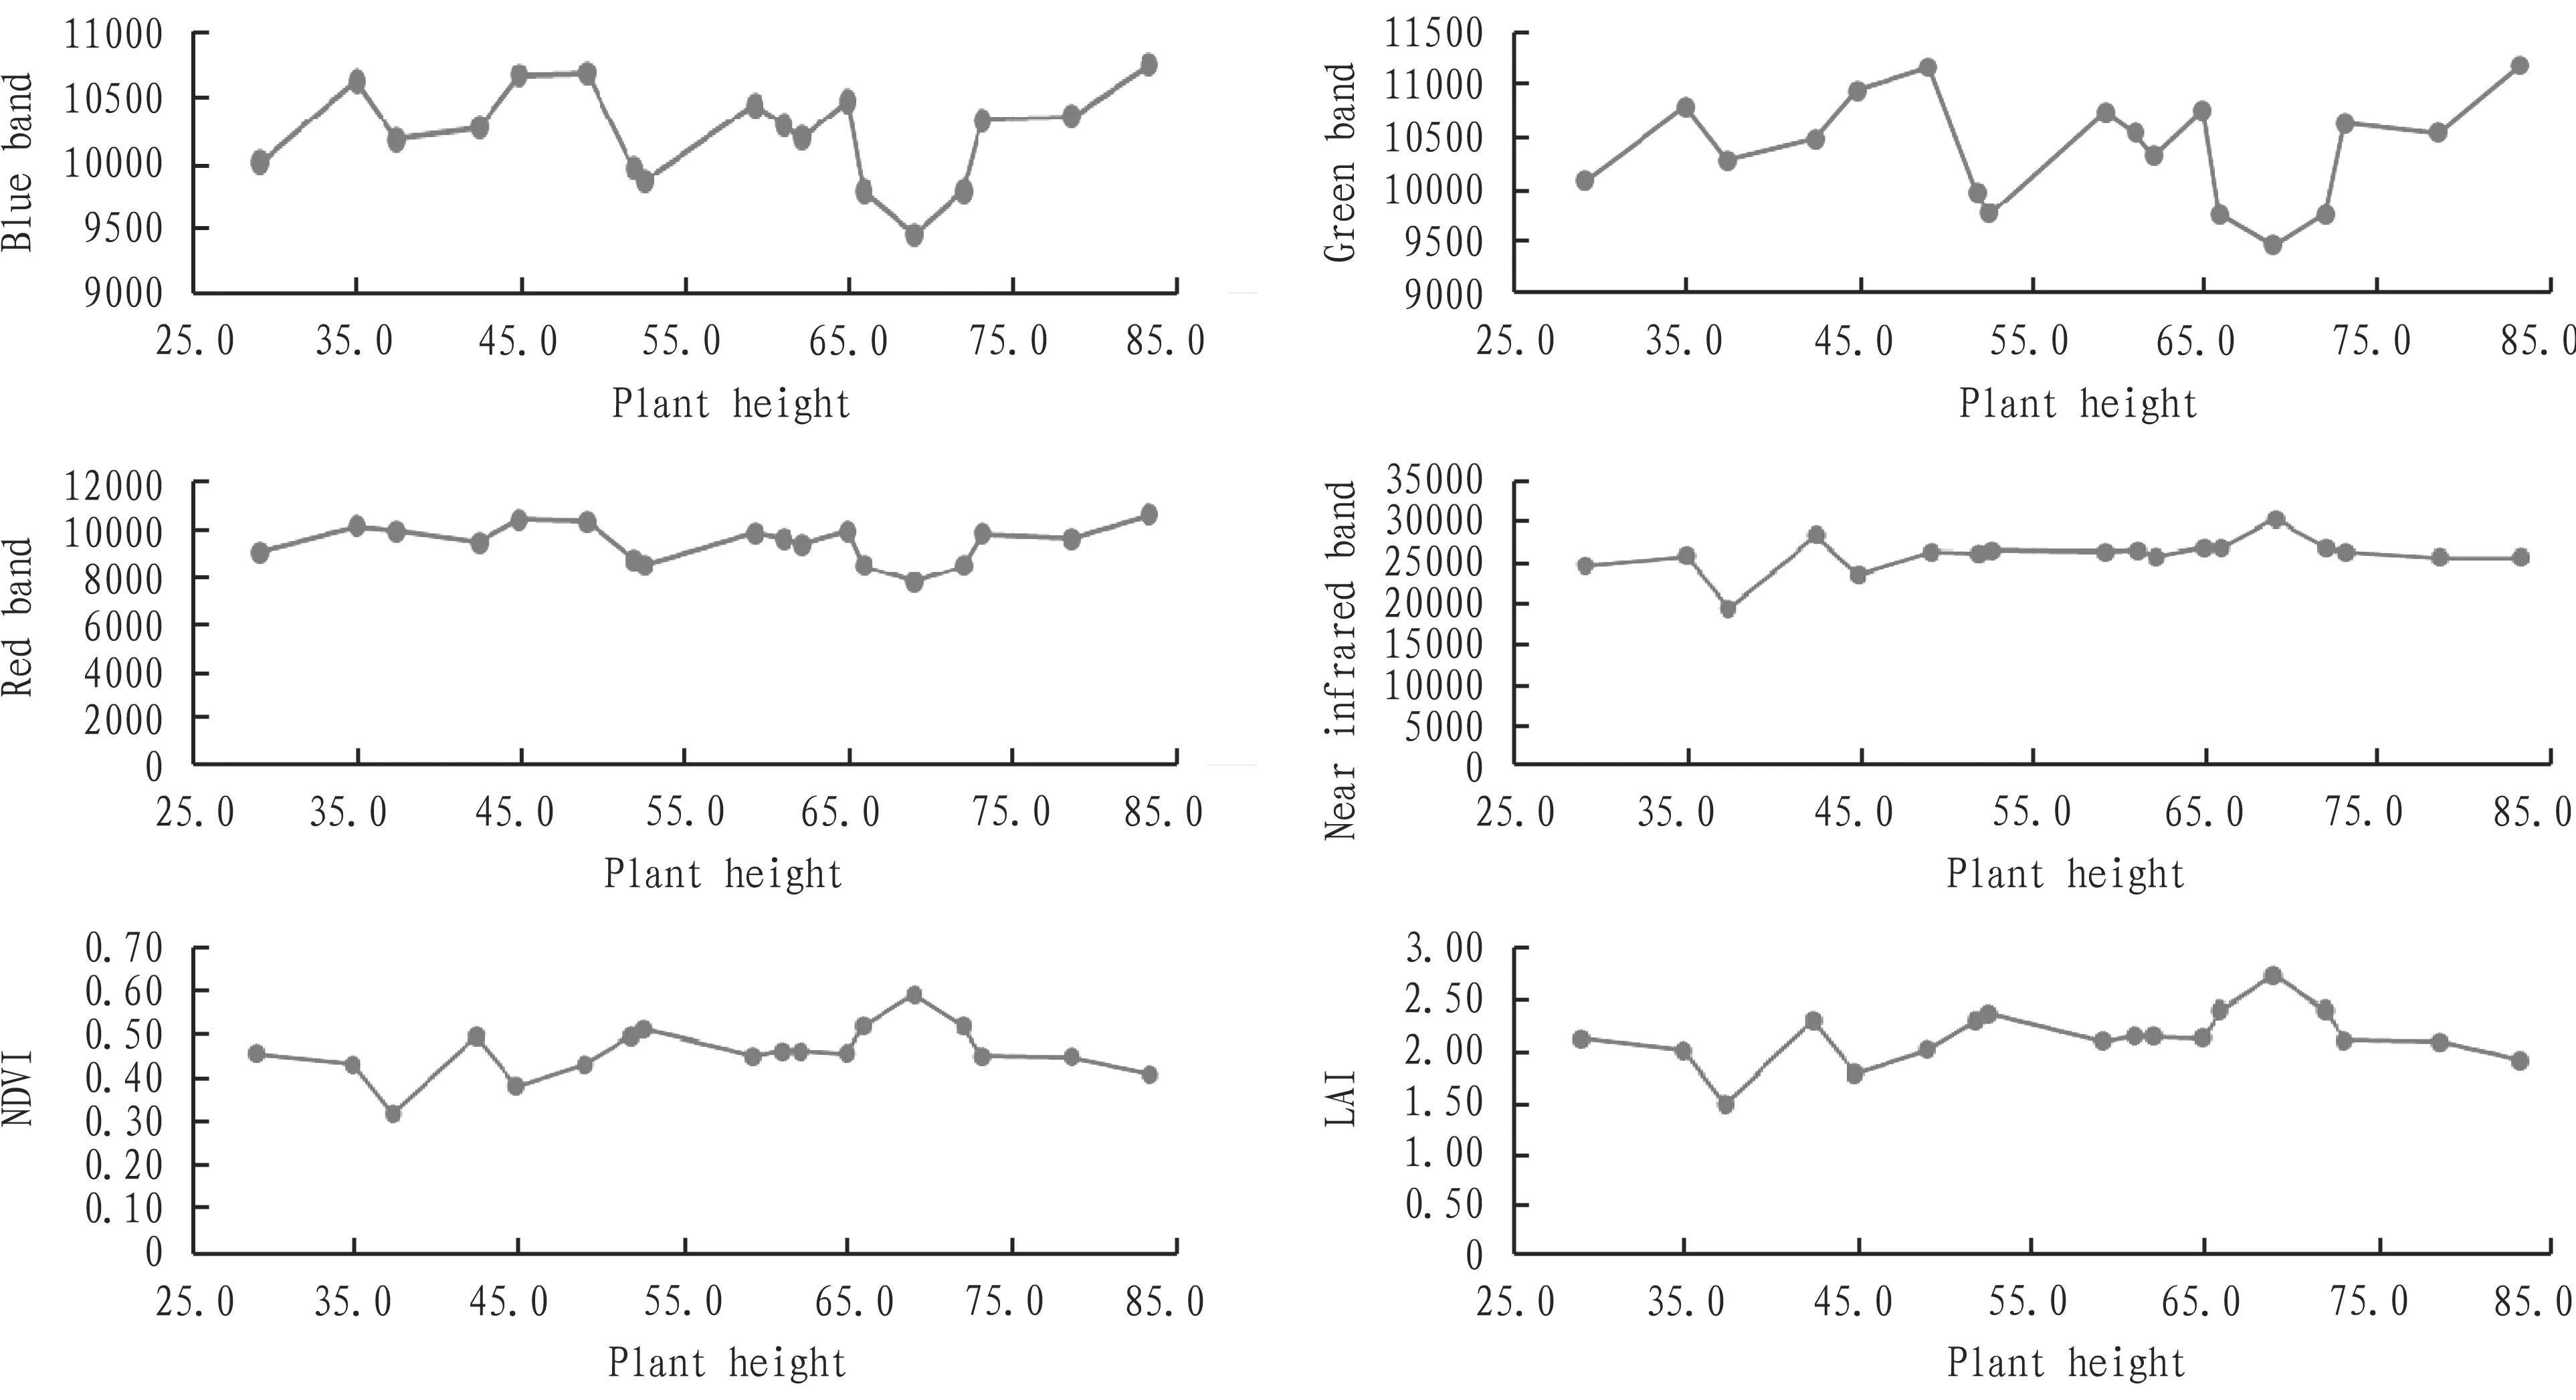
4.4DifferencesinspectralcharacteristicsandindicesofsamplepointThe differences in spectral characteristics and indices of sample point are compared, as shown in Fig. 5.

Fig.4Correlationbetweenspectralparametersandplantheight

Fig.5Differencesinspectralcharacteristicsandindicesofsamplepoint
5 Conclusions and discussions
There are differences in the biochemical components and plant canopy structure of cotton at different growth stages, and the sunlight absorption and reflection properties are also different. The test results also show that under different plant height, there are also some differences in the characteristic spectrum and its correlation index, but the differences are closely related to the image spatial resolution and spectral resolution. Therefore, in order to improve the cotton plant height estimation accuracy, there is a need to use hyperspectral image for further experiment. The aim of using remote sensing image data to estimate cotton plant height is to monitor the cotton growth. The plant height is affected by heredity gene, and different varieties have different plant height. It is difficult to judge the cotton growth status according to the plant height, so it is necessary to further study the relationship between plant height and yield of different varieties, and then estimate cotton yield by the plant height data. Under suitable environment for the growth of cotton, the reasonable plant height and canopy structure can be obtained. In the case of drought, fertilizer shortage or manure surplus, plant height is also affected to some extent[2]. Therefore, using remote sensing to estimate cotton plant height and establishing the ground-based growth environment database can provide a scientific decision-making basis.
[1] GU ZQ, LI YN. Analysis on the correlation between cotton plant height and productivity [J]. Jiangxi Cottons, 1998(2): 13-16.(in Chinese).
[2] SUI XY, ZHU ZL, ZHU CB,etal. Study on estimating wheat plant height with MODIS remote sensing data in Shandong Province [J]. Shandong Agricultural Sciences, 2009(2): 5-7. (in Chinese).
[3] LI JL, ZHANG H, CAO SC. Dynamic monitoring on the summer maize growth based on satellite remote sensing [J]. Journal of Maize Sciences, 2013(3): 149-153.(in Chinese).
[4] ZHANG Y, LAI JC. Review on the influence of climate in 2014 on crop growth of the Sixth Division of Corps [J]. Xinjiang Farmland Reclamation Science & Technology, 2015(6): 75-77.(in Chinese).
[5] LI YQ, ZHANG JJ, XIONG SP,etal. Study on hyperspectral model for estimating the plant height of different winter wheat cultivars [J]. Journal of Triticeae Crops, 2012(3): 523-529.(in Chinese).
[6] GAO L, LI CC, WANG BS,etal. Comparison of precision in retrieving soybean leaf area index based on multi-source remote sensing data [J]. Chinese Journal of Applied Ecology, 2016(1): 191-200. (in Chinese).
杂志排行
Asian Agricultural Research的其它文章
- Feasibility Analysis of Agricultural Product Price Index Insurance Based on Pilot Cases
- Forecast on Price of Agricultural Futures in China Based on ARIMA Model
- Model Building for Community Participating in Rural Tourism and Game Analysis of Core Stakeholders
- Embedded Programmable Single Point Multiple Output Intelligent Data Acquisition and Transmission System
- A Study of the Factors that Affect Farmers’ Willingness to Transfer Land in the Central Regions Based on a Survey of 180 Farmers in Suizhou City
- How to Enhance the Brand Competitiveness of Ginseng Enterprises?
