GARCH-neural network model for forecasting the volatility of bid-ask spread of the Chinese stock market
2015-12-15MUZepingLISiming
MU Zeping,LI Siming
(1.Chongqing College of Electronic Engineering,Chongqing 401331,P.R.China 2.Southwestern University of Finance and Economics,Chengdu 611130,P.R.China)
1 Introduction
In this paper,the so-called bid-ask spread is served as an important indicator to quantify the financial market liquidity and efficiency.Most modern financial markets are order-driven markets,which adopt continuous double auction mechanism.There are two basic types of orders,market order and limit order.The bid-ask spread refers to the price difference between the lowest ask price and the highest bid price based on limit orders.Generally speaking,the lower the spread,the smaller the transaction cost,and also the higher liquidity and efficiency of the stock market.
So far,bid-ask spread has been wildly discussed by empirical study and theoretical analysis[1-8].Groβ-KluβMann et al use long-memory autoregressive conditional Poisson models to predict bid-ask spread in NYSE and NASDAQ[2].Empirical study shows that,the probability distribution of the bid-ask spread obeys a power law behavior,with the exponent around 3.0[3-4].And U-shaped pattern of bid-ask spread is found in Taiwan stock exchange[5].Long-range time correlation of the bid-ask spread is also revealed for different markets,including Chinese stock market[3,6].In addition,the bid-ask spread is reported to be mono-fractal for the Chinese stock market[6].And long-rangcross-correlationsarepresentedforthe spread volatilities of different stocks in Chinese stock market[7].However,the dynamics and forecasts of bid-ask spread volatility have not been analyzed and reported in detail,to our knowledge.
In financial market,one concerns more on the price volatility rather than the price itself.Volatility can be used to model the uncertainty and risk in financial markets.And forecasting price volatility,which is a primary subject of recent empirical studies and theoretical analysis in financial market,can enhance financial applications from risk management to investment decision.So,it is significant to look into the dynamics of bid-ask spread volatility and forecast it to deepen our understanding about the microstructure of financial market itself.
GARCH family models have been extensively used for estimating financial asset volatilities[9-13].They can model financial data with changing variances over time.However,the linear correlation structure assumption in these models,which usually goes against the real word financial data,can result in poor model performances.Neural network,a kind of nonparametric model,can fit on non-linear data set much better,also get better results in forecasting.And the applications of neural network to modeling financial conditions are expanding rapidly[14-18].
The motivation of this paper is to find out the perfect fitness GARCH model for bid-ask spread to better our understanding about the dynamics of volatility,and then a hybrid GARCH-NN model based on it is proposed to enhance the ability in forecasting volatility.Our proposed models are tested by tick-by-tick data of 40 constituent stocks of SZEI(Shenzhen Stock Exchange Index)in Chinese stock market for the whole year 2010,which can be used to present the performance of this exchange.And our empirical results show that SZEI bid-ask spread can be modeled better by GARCH-M model at the first step.Furthermore,our hybrid model GARCH-NN performs better on one-stepahead forecasting than GARCH-M model according to MSE and MAE criteria.
2 GARCH family models
Recently,numerous models based on the stochastic volatility process and time series modeling have been found as alternatives to the implied and historical volatility approach.The most wildly used model for estimating volatility is ARCH model developed by Engel in 1982.Since the development of the original ARCH model,among which GARCH,IGARCH,GARCH-M,EGARCH and GJR-GARCH are the most frequently used models[19-23].
GARCH(p,q)is a generalization of ARCH model by making the current conditional variance dependent on the p past conditional variances as well as the q past squared innovations.
The GARCH(p,q)model can be written as following equation(1)and(2).

where εtis a sequence i.i.d.random variables with mean 0 and variance 1,and α0>0,αi≥0,βi≥0,and
If the AR of the GARCH has a unit root,then GARCH model is substituted by IGARCH model.An IGARCH model can be written as formula(3)and(4).

In finance,the return of a security may depend on its own volatility.To model such phenomenon,one may consider the GARCH-M model,which can be written as equation(5),(6)and(7).

To overcome some weakness of the GARCH model in handling financial time series,Nelson proposes the exponential GARCH(EGARCH)model[22].The EGATCH(p,q)model can be represented as follows equation(8)and(9).
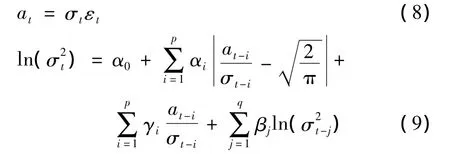
This model allows that the volatility can have asymmetry in response to positive and negative innovations respectively.Here a positive at-icontributesto the log volatility,whereas a negativeat-igives,whereεt-i=at-i/σt-i,where the γiparameter thus signifies the leverage effect of at-i.
Another volatility model commonly used to handle leverageeffectsisthethresholdGARCH(TGARCH).A T-GARCH(p,q)assumes the form as equation(10),(11)and(12):

Here αi,γi,and βiare non-negative parameters satisfying conditions similar to those of GARHC models.From the model,it is seen that a positive at-icontributesto volatility,whereas a negative at-igives larger impactwith γi>0.
In this study,we estimate GARCH family models respectively.And we use two penalized model selection criteria,the Akaike information criterion(AIC)and Schwartz bayesian criterion(SBC)to select best parameters for GARCH models[24-25].
3 Neural network model
GARCH family models assume a linear correlation structure among the time series data while there are non-linear patterns in such data that cannot be captured by these models.This assumption can result in poor modeling fitness and forecasting performance.A popular topic in modern data analysis is neural network,which is classified as a semi-parametric method.The theory of neural network computation provides interesting techniques that mimic the human brain and nervous system.Generally speaking,a neural network model is a set of connected input and output units where each connection has a weight associated with it.During the learning phase,the network learns by adjusting the weights so as to be able to correctly predict or classify the output target of a given set of input samples.
Neural networks can be divided into feed forward and feedback networks.In this study,we apply a back propagation neural network,which is the most widely used network in financial applications[26-29].A generic two-layer feed-forward neural network is shown in Fig.1.
In this study,the dataset is divided as:70%for training,15%for validation and 15%for testing.They are used for fitting model,selecting model and assessing model respectively.

Fig.1 A two-layer feed-forward network
4 Hybrid model
In this section,we propose a hybrid model.As firstly,a perfected GARCH model is identified by AIC and SBC information criterions,and then upon which the hybrid model is proposed.For evaluation,we compare the forecasting result of these two models by selected measures,including MSE(mean square error)and MAE(mean absolute error).
4.1 Bid-ask spread data and model
The Chinese stock market is an order-driven market based on the continuous double auction.Our analysis is based on the tick-by-tick limit order book data of the liquid stocks listed on the Shenzhen Stock Exchange(SZSE).SZSE was established on December 1,1990 and has been in operation since July 3,1991.SZSE is open for trading from Monday to Friday except for the public holidays and other days as announced by the China Security Regulatory Commission.With respect to securities auction,opening call auction is held between 9:15 and 9:25 on each trading day,followed by continuous trading from 9:30 to 11:30 and 13:00 to 15:00.In this study,trading data on SZSE from 9:30 A.M.to 11:30 A.M.and 13:00 P.M.to 15:00 P.M.Beijing Time during 2010 are included only.What’s more,particular data of 40 constituent stocks issued in SZSE are collected at the same time.The data for this study comprise every quotation for the 40 stocks during 2010,which were obtained from the Guotaijunan Security Company.
The raw limit-order book recorded high-frequency data we got firstly whose time stamps are accurate to 0.01 s.And the length of time between the reporting of quotation varies slightly depending on the trade and quote activity levels.Then a minute-by-minute series of time-weighted percentage bid-ask spreads over the trading day in SZSE market is constructed by the time weighted method in Mcinish[30].
The time-weighting is based on the number of seconds the quotation is outstanding during the one-minute or thirty-minute interval.A percentage bid-ask spread is computed for every quotation as the following equation(13),where askkis the price a seller states she will accept for stock k,while bidkis the highest price that a buyer(i.e.,bidder)is willing to pay for stock k.

Suppose that in the interval(T,T')there are N quotation updates,occurring at times ti,i=1,…,N,with spreads BASi,i=1,…,N where t0=T and tN+1=T'.The time-weighted spread is calculated by the following equation(14).

After weighting,our dataset contains 50 905 minute-by-minute records for each 40 constituent stocks of SZEI.And then the spread average of these 40 stocks is calculated as the final bid-ask spread data we test for proposed model,and which represent the performance of SZSE in 2010.This time-weighting and average methods are used to process other time series variables in our model as well.And all the variances included in our model are logarithm transformed.The Tab.1 shows basic statistics of final bid-ask spread data.
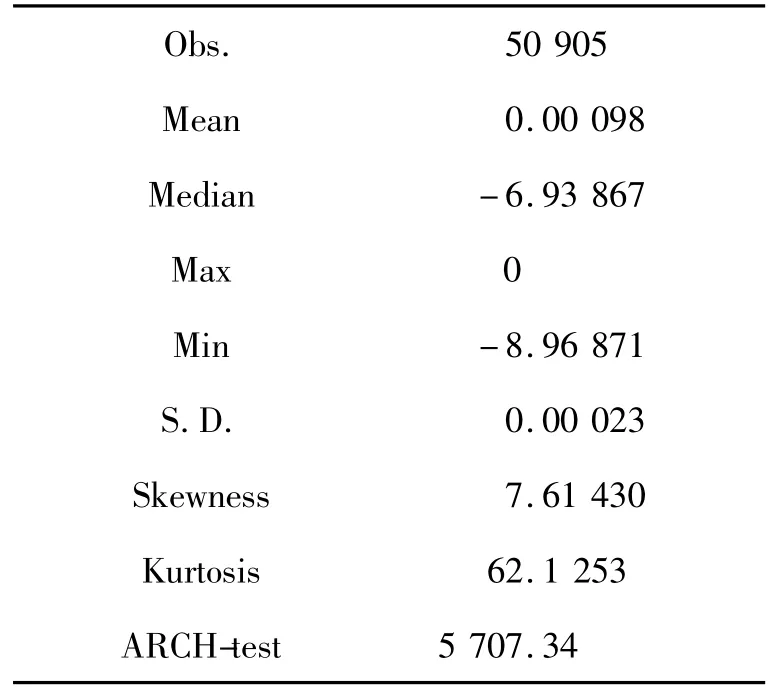
Tab.1 Data description and preliminary statistics of BAS
Schwartz identifies four classes of variables as determinants of bid-ask spreads:activity,risk,information,and competition[31].Previous researchers show that a number of variables are significant determinants of bid-ask spreads including:the average numbers of shares per trade[32],the trading volume[32],Branch and Freed[33],stoll[34]average variance of the time-weighted bid-ask spread[35],the average return for weighted bid-ask return[35],the variance of return for weighted bid-ask spread[35],the last trading price[35].
Based on prior researches,6 independent variables are selected by significantly correlating to the estimated volatility based on the GARCH models,which are presented in the following Tab.2.

Tab.2 Selected independent variables
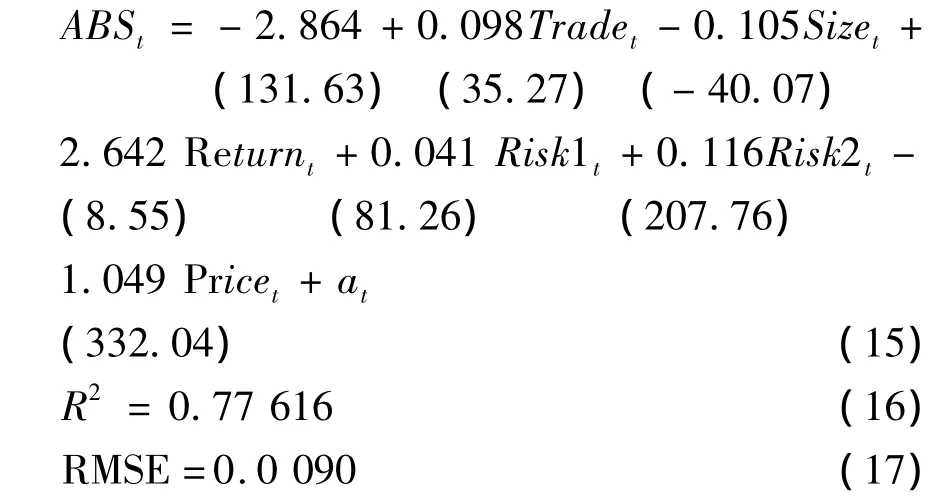
The linear model is formed in the equation(15)and the OLS(ordinary least square)regression results are shown in equations(16)and(17).The values in brackets are t-statistic used to test whether any of the coefficients might be equal to zero.Large values of t indicate that the null hypothesis can be rejected and that the corresponding coefficient is not zero.From our results,all the coefficients are significantly not equal to zero.
4.2 Hybrid model
To this stage,the input variables to the neural network model have been specified by GARCH model.Specifically,the estimated conditional variance is considered to be the target for training the network,while the estimated error term from the structure model is the input variable.Fig.2 shows the process of our hybrid model.

Fig.2 Process of hybrid model
5 Results
In this section,we report the results of applying GARCH-type models as well as the proposed hybrid model for forecasting volatility of bid-ask spread.At firstly,GARCH,E-GARH,I-GARCH,GARCH-M,and T-GARCH models with various combination of(p,q)parameters ranging from(1,1)to(2,2)were estimated,of which some models are not converged.And the AIC and SBC results of converged models are represented as Tab.3.

Tab.3 AIC and SBC criteria for GARCH-type models
According tothevaluesoffitnessmeasure,GARCH-M(1,1)has shown the best performance and thus is selected for construction of hybrid model.Specifically,the model can be represented in the following equation(18),(19)and(20).
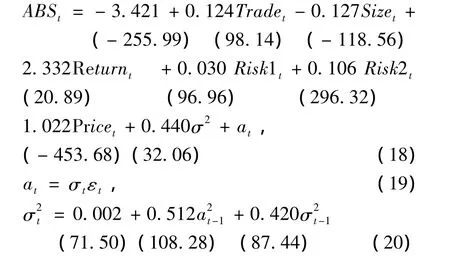
According to above model results,the coefficient of ln_trade is significantly positive which is against the result in New York Stock Exchange[35],however,it is reasonable for Chinese stock market,since more trading volume means higher probability inside trading involved in.The coefficient of ln_size is significant negative confirming that the spread will decrease when the market is more activity.The coefficient of risk1 and risk2aresignificantlypositivedemonstratingthat spreads are larger during intervals with greater risk.The coefficient of price shows that higher priced stocks have smaller spreads.In addition,more volatility which means more risk in the market accompanies higher spread.
To this stage,the realized conditional variance time series data produced by GARCH-M model is inputted to be the target for training the network,while a time lag of conditional variance and a time lag of the estimated error term from the structure model are the input variables.And the statistic properties are shown in the Tab.4.

Tab.4 Data description of BAS conditional variance and error term
Then,we use these two models to do one-step-ahead forecast for volatility.To evaluate forecast accuracy,we compare the volatility forecasts of the proposed hybrid models with the GARCH-M(1,1)model by the threefollowingcriterions:meansquareerror(MSE),mean absolute error(MAE).And the results are shown in the Tab.5.
The results show that hybrid model which is proposed in this paper has much lower MSE and MAE than GARCH-M(1,1)model.So,the GARCH-NN model outperforms GARCH-M(1,1)model on forecasting bidask spread of Chinese Shenzhen stock market.

Tab.5 MSE and MAE criteria for GARCH-M and GARCH-NN models
6 Conclusions
Price spread is an important indicator for stock market liquidity and efficacy,and is discussed a lot in recently studies.However,the study of spread volatility is not detailed,either on the dynamics of volatility or forecasting topics.In this research,we propose a hybrid GARCH-Neural Network model,which broadens the applications of GARCH-type models in Chinese stock market.Furthermore,by comparing forecasting performances,the proposed hybrid model in this paper outperforms the perfected GARCH-M(1,1)model based on MSE and MAE criteria.Future research includes the application of such high quality forecasts of volatilities in various financial decision making problems such as asset pricing,portfolio selection and investment strategy.
[1]PLEROU V,GOPKRISHNAN P,STANLEY H E.Quantifying fluctuations in market liquidity:analysis of the Bid-Ask Spread[J].Physical Review E,2005(7):046131-1-046131-8.
[2]GROB-KLUBMANN A,HAUTSCH N.Predicting bid-ask spread using long-memory autoregressive conditional poisson models[J].Journal of Forecasting,2013,32(8):724-742.
[3]MIKE S,FARMER J D.An empirical behavioral model of liquidity and volatility[J].Journal of Economics&Control,2008,32(1):200-234.
[4]ZHAO Yan,CHENG Lee-Young,CHANG Chong-Chuo,et al.Short sales,margin purchases and bid-ask spreads[J].Pacific-Basin Finance Journal,2013(24):199-220.
[5]FARMER J D.What really cause large price changes?[J].Quantitative Finance,2004(4):383-397.
[6]GU Gaofeng,CHEN Wei,ZHOU Weixing.Empirical regularities of order placement in the Chinese stock market[J].Physica A,2008:3173-3182.
[7]QIU Tian,CHEN Guang,ZHONG Lixin,et al.Dynamics of Bid-ask Spread return and volatility of Chinese stock market[J].Physica A,2012,391(6):2656-2666.
[8]ZHANG Xindong,YANG Junxian,SU Huimin et al.Liquidity premium and the Corwin-Schultz bid-ask spread estimate[J].China Finance Review International,2014,4(2):168-186.
[9]GRANGER C W J,DING Zhuanxin.Modeling volatility persistence of speculative returns:A new approach[J].Journal of Econometrics,1996,73(1):185-215.
[10]GRANGER C W J.Overview of non-linear time series specification in Economics[M].Berkeley NSF-Symposia,1998.
[11]HAN H,PARK J Y.Time series properties of ARCH processes with persistent covariates[J].Journal of Econometrics,2008:275-292.
[12]GOKBULUT R I,PEKKAYA M.Estimating and Forecasting Volatility of Financial Markets Using Asymmetric GARCH Models:An Application on Turkish Financial Markets[J].International Journal of Economics and Finance,2014,6(4):23.
[13]ZHANG Huannan,LAN Qiujun.GARCH-Type Model with Continuous and Jump Variation for Stock Volatility and Its Empirical Study in China[J].Mathematical Problems in Engineering,2014:1-8.
[14]HAMID S A,IABAL Z.Using neural networks for forecasting volatility of S&P 500[J].Journal of Business Research,2004:1116-1125.
[15]KIM K J.Artificial neural networks with evolutionary instance selection for financial forecasting[J].Expert System with Application,2006:519-526.
[16]WANG Y H.Nonlinear neural network forecasting model for stock index option price:Hybrid GJR-GARCH approach[J].Expert System with Application,2009:564-570.
[17]YU Lean,WANG Shouyang,LAI K K.A neural-networkbased nonlinear meta-modeling approach to financial time series forecasting[J].Applied Soft Computing,2009:536-574.
[18]KOURENTZES N,BARROW D K,CRONE S F.Neural network ensemble operators for time series forccasting[J].Expert Systems with Applications,2014,41(9):4235-4244.
[19]BOLLERSLEV T.Generalized autoregressive conditional heteroskedasticity[J].Journal of Econometrics,1986(31):307-327.
[20]ENGEL R.BOLLERSLEV T,Modeling the persistence of conditional variance[J].Econometric Reviews,1986(5):1-50.
[21]ENGEL R,LILLIEN D,ROBIN R,Estimating time varying risk premia in the term structure:the ARCH-M model[J].Econometrica,1987(55):391-407.
[22]NELSON D B.Conditional heteroskedasticity in asset return:A new approach[J].Econometrica,1991(59):347-370.
[23]GLOSTEN L R,JAGANNATHAN R,RUNKLE D E.On the relation between the expected value and the volatility of the nominal excess return on stocks[J].Journal of Finance,1993(48):1779-1801.
[24]AKAIKE H.A new look at the statistical model identification[J].IEEE Transactions on Automatic Control,1974:716-723.
[25]SCHWARZ G.Estimating the dimension of model[J].Annuals of Statistics,1978:461-464.
[26]KO P C.Option valuation based on the neural regression model[J].Expert System with Application,2009,36(1):464-471.
[27]TSENG C H,CHENG S T,WANG Y H et al.Artificial neural network model of the hybrid EGARCH volatility of the Taiwan stock index option prices[J].Physica A,2008,387(13):3192-3200.
[28]WANG Y H.Nonlinear neural network forecasting model for stock index option price:Hybrid GJR-GARCH approach[J].Expert System with Application,2009,36(1):564-570.
[29]HAJIZADEH E,SEIFI A,ZARANDI M H F et al.A Hybrid Modeling Approach for Forecasting the Volatility of S&P 500 Index Return[J].Expert System with Applications,2012,39(1):431-436.
[30]MCINISH T H,WOOD R A.An analysis of intraday pattern in Bid/Ask Spread for NYSE stocks[J].The Journal of Finance,1992,47(2):753-764.
[31]SCHWARTZ R A.Equity markets:structure,trading,and performance[M].New York:Harper&Row,inc,1988.
[32]TINIC S,WEST R.Competition and the pricing of dealer services in the over-the-counter market[J].Journal of Financial and Quantitative Analysis,1972,7(3):1707-1727.
[33]BRANCH B S,FREED W.Bid-ask Spreads on AMEX and the big board[J].Journal of Finance,1977,32(1):159-163.
[34]STOLL H R.The pricing of security dealer services:an empirical study of NASDAQ stocks[J].Journal of Finance,1978,33(4):1153-1172.
[35]TINIC S M.The economics of liquidity service[J].Quarterly Journal of Economics,1972,86(1):1707-1727.
