Vertical Variation Characteristics of Basic Physical Properties in the Daxia lrrigated Area of Qinghai Province
2015-11-08WengxingLUHongboTANGDongxuLlUGuozhongWANGYumingWANGDongLl
Wengxing LU,Hongbo TANG,Dongxu LlU,Guozhong WANG,Yuming WANG,Dong Ll
1.Yellow River Institute of Hydrology and Water Resources,Zhengzhou 450004,China;
2.Qinghai Hydrographic and Water Resources Survey Bureau,Xining 810008,China
Vertical Variation Characteristics of Basic Physical Properties in the Daxia lrrigated Area of Qinghai Province
Wengxing LU1*,Hongbo TANG2,Dongxu LlU1,Guozhong WANG1,Yuming WANG1,Dong Ll1
1.Yellow River Institute of Hydrology and Water Resources,Zhengzhou 450004,China;
2.Qinghai Hydrographic and Water Resources Survey Bureau,Xining 810008,China
Influenced by climate,biology and soilproperties,verticalsoilprofile showed stratification character in terms of basic physical properties.The research conducted measurement and analysis on basic physical properties of typical field in the Daxia irrigation area in Qinghai Province.The results showed that soil bulk density changed from decreasing to increasing upon soil horizon;the soil horizons in 0-40 and 90-150 cm were high porosity zones,and the others were low porosity area;the saturation moisture capacity,water retention of capillary porosity and field water retention all changed from decreasing to increasing upon soil horizon featured by arithmetic progression.In addition,the research area in Daxia irrigated area showed loose structure in soil horizon of 0-40 cm,compacted in 40-60 cm,and loose again in 60-200 cm vertically.
Daxia irrigated area;Soil basic physical properties;Vertical variation
D axiairrigatedarea isgeographically located within the Chuanshui area of Hegu Plain in belt-shape along the Huangshui River trunk stream and the first-grade tributary,consisting of a benchland and diluvial fans at grades 1-5 slopes. It is a major crop-producing area in the county,characterized by better soil profile pattern and loose soil and has a semi-arid plateau continental climate. Under influence of climate,biology and soil characters,soil profile showed hierarchy[1-2].The research conducted measurement and analysis on basic physical properties on soils in horizon of 200 cm in the Daxia irrigated area in order to explore the variation characters vertically and provide theoretical references for research on soils in Daxia irrigated area in Qinghai Province.
Materials and Methods
Research area
The research area is situated in Daxia irrigated area in the Yellow River,Qinghai Province at 102°15′-102° 24′E and 36°13′-36°30′N,with elevations of 1 650-4 400 m.
Superficially,Daxia irrigated area is in Hetanzhai Village,Gaodian Town on the left bank of Huangshui River,with watersource of Huangshui River and supplemented by the first-grade tributary.Besides,the irrigated area goes through 43 administrative villages and departments of 5 towns,including Gaodian,Yurun,Gonghe,Nianbo and Gaomiao.
It has a semi-arid plateau continental climate,featured by annual mean temperature in 4.5-7.5℃and frost-free period of 130-150 d.On the other hand,the geographical terrain is so complicated upon elevation,so that precipitation tends to be volatile.For example,precipitation in mountainous area is generally higher than that in stream areas.In stream areas,annual mean precipitation is in the range from 320 to 340 mm,where evaporationcapacity keeps higher than that in mountainous areas.For instance,annual evaporation capacity reaches 843 mm and frozen earth is as deep as 86 cm.Besides,soils in Daxia irrigated area mainlyinclude sierozem and chestnut soil and parent material covers alluvial deposit,diluvium and redeposited loess.The soils are loose and soil textile is uniform,with granular aggregate.
The sample site is farmlands where wheat is grown at 36°29′16.4″N and 102°13′34.8″E,with an elevation of 1 950 m and average slope of 3°. And soils are dominated by sierozem(Fig.1).
Soil sample collection and treatment
Based on survey on experimental sites,the lands with good water diversion and subsiding were chosen as a test site to be grown with wheat according to the principle of typicality in mid-October in 2014.Within the experimental sites,the sample plot was set at 2 m×2 m.The soil profile was dug in the depth of 200 cm provided soil structure complete and soil samples were collected from different horizons with the limit of 10 cm with a standard cutting ring(100 cm3).Every layer included three replications,and the samples were finally brought back into a laboratory for use.
Measured items and methods
Some items were measured in mid-October 2014 by cutting-ring permeation[3],involving soil bulk density,porosity (total porosity, capillary porosity and noncapillary poropsity),saturation capacity,capillary moisture,field capacity,and soil moisture.
Firstly,lower cover of the cutting ring was opened and then covered with filter papers to weigh soil bulk density (m1);roof cover was taken down and the end with mesh of cutting ring was placed in a basin where water height should be up to top edge.After 12 h,the cutting ring was taken out,covered with the roof cover and dried,followed by weighing (m2).Dry sands were spread on a flat tray,which were weighed before the cutting ring was placed in.After 12 h permeation,the weight was weighed(m3).Subsequently,filter paper was spread on the flat tray and weighed.Then,the cutting ring as placed on the flat tray and weighed after 12 h permeation(m4). The roof cover of the weighed cutting ring was opened and baked in an oven at 105℃for 24 h;the roof cover was equipped again and weighed(m5);the soil sample was collected and the cutting ring with filter paper was weighed(m6).The concerning equations were as follows:
where r represents soil bulk density.
where P refers to total porosity and v refers to the volume of the cutting ring.
where P1represents soilcapillary porosity.
where P2refers to noncapillary porosity.
where P3refers to the maximal waterholding capacity.
where P4indicates the minimal waterholding capacity.
where P5refers to field capacity.
where P6refers to soil natural moisture content.
Data analysis
All test data were ordered with Excel and analyzed with SPSS16.0. Besides,the figure was drawn by AutoCAD and sigmaplot 10.0.
Results and Analysis
Analysis on vertical variation of soil bulk density
Soil bulk density refers to the ratio of dry soil mass to bulk soil volume and the unit for the density is represent by g/cm3.It is notable that the value is always lower than soil particle density and the masses are computed on the premise of dried soils in 105-110℃. Besides,soil bulk density is under influence of both soil particle density and porosity,and porosity dominates.On the other hand,soil bulk density reflects soil structure,air permeability,water permeability and water retention capacity.For example,a small bulk density suggests that soils have a better structure,featured by good air/water permeability;soil bulk density is also the reflection of soil-ripening and ripened soils generally keep lower in the bulk density;the change of bulk density has effects on soil porosity,as well as root growth and biomass accumulation.
Specifically,the bulk density of soil depends greatly on soil texture,structure,organic matter content,as well as other natural and human influences[4].Generally speaking,it is lower in the soils with loose structure or high porosity,or the bulk density is higher. On the other hand,it is usually small on surface soils,and keeps growing upon soil horizon.It is notable that the bulk density is decreasing on surface soils with increasing of organic matter and improving of soil structure.
As shown in Fig.2,the bulk density changed from increasing to decreasing upon soil depth in the research area.For instance,the bulk density surged within the depth of 0-50 cm,reaching the peak at 1.81 g/cm2,and dropped substantially within the range of 50-90 cm,followed by a stable status in 90-200 cm.These indicated that soil bulk density grows with soil depth of 40-50 cm.It can be concluded from the profile view of soils that there is a hardened sand layer reducing water permeability and preventing rainfallinfiltration. Consequently,a temporary “aquiclude”would form after irrigation or rainfall[5].
Analysis on soil porosity vertical variation
Soil porosity refers to the percentage of the void spaces in soils per unit volume and a fraction of the volume of voids over total volume of soils. The size and quantity of void decide the factors such as moisture,fertilizer,gas and heat.It is generally as a percentage between 30%-60%.However,soil porosity just indicates quantity of soil void spaces and it is necessary for better learn its property to explore porosity diameter class.It is usually
classified into ineffective porosity,capillary porosity and non-capillary porosity.
Ineffective porosity refers to the void space with diameter below 0.001 mm,fully filled with fluids,so that the contained water is absorbed by soil particles and can not be taken in by plants any more.The thinner soil particle or the more scattered,the more ineffective porosity,and the increase of ineffective porosity would reduce air and water permeability in soils.Capillary porosity refers to the void space with diameter of 0.001-0.100 mm,functioning well in capillary action and guaranteeing water stored in soils depending on meniscus.Therefore,water there is the most conductive to plantgrowth.As fornon-capillary porosity,it refers to pores greater than 0.1 mm in diameter,and capillary ac-tion declines significantly,so that water storing capacity is degrading.Besides,it is a channel where fluids and gases flow,and also named air porosity.It can be concluded that the quantity of non-capillary porosity directly affects soil permeability.
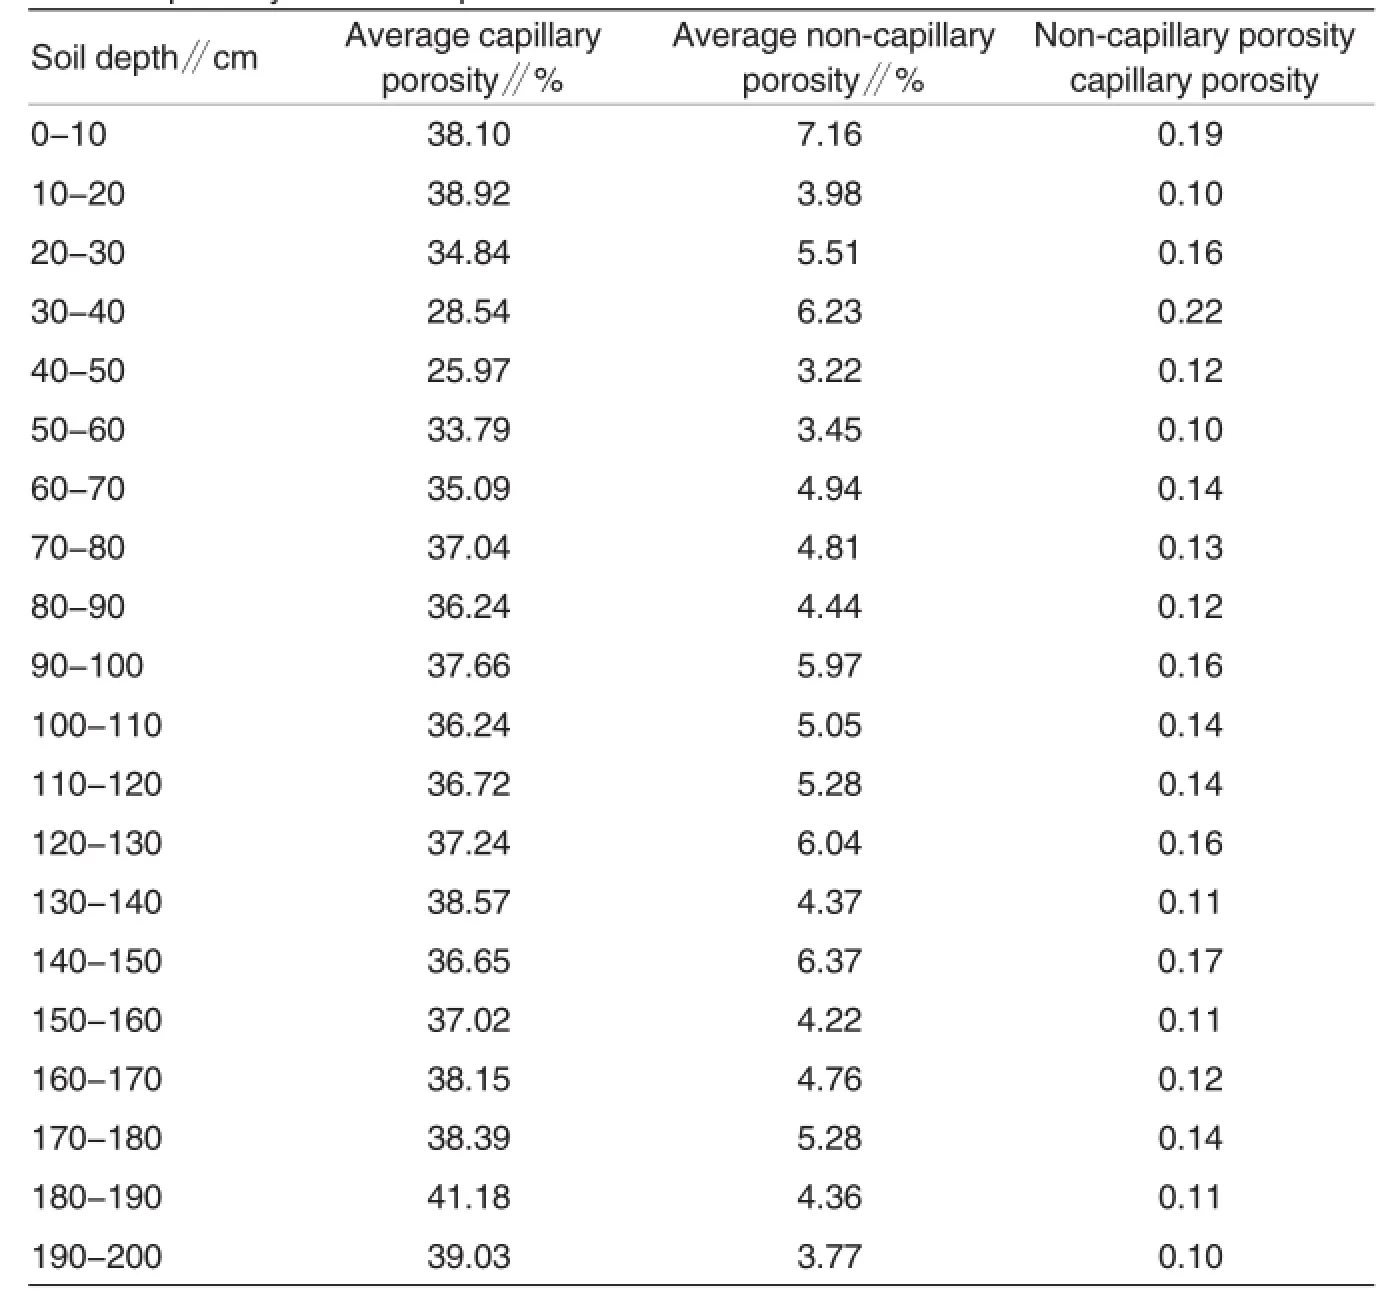
Table 1 The changes of the specific value between noncapillary porosity and capillary porosity with soil depth
In research of soil and water conservation,ineffective porosity is generally included by capillary porosity,so that total porosity of soil actually covers capillary and non-capillary porosity.Soil total porosity is a physical property affecting soil fertility and primary references for calculation of solid,liquid and gaseous phases of soil[6].
As shown in Fig.2,non-capillary porosity declined in the depth of 20 and 50 cm and dropped to the minimum at 3.22%in 50 cm.The maximum reached with the depth of 10 cm,which was 2.22 times as high as the minimum.Besides,it was increasing gradually within the depth of 50-70 cm and kept stable below 70 cm,with high coefficients of variation.As for capillary porosity,it changed remarkably at the depth of 40 cm,with the largest differences of 8.87%and dropped to the minimum at 25.97%with the depth of 50 cm.On the other hand,total soil porosity showed the change similar to capillary porosity.
It can be concluded from Table 1 that non-capillary porosity-to-capillary porosity rate kept higher in the ranges of 0-40 and 90-150 cm,with averages at 0.17 and 0.15,respectively,which proved the areas are highporosity region.The rate in other soil horizons averaged 0.12,suggesting the other areas are low-porosity region in which plants are much few.
Analysis on vertical variation of water retention
Soil retained water refers to moisture content taken in by soils,and it is a key index for the function of water conservation,represented by water retention of soil pores.Besides,quantity of stored water is decided by soil texture,thickness,and porosity and water retention,therefore,directly affects anti-water erosion,reflecting soil ecological function[7].
The maximal stored water computed based on soil porosity is equal to that when capillary porosity and noncapillary porosity are both fully filled with water.The saturation moisture capacity is generally computed on basis of total soil porosity.
It can be concluded from Fig.2 that saturation moisture capacity,water retention of capillary porosity and field water retention all changed from decreasing to increasing upon soil horizon featured by arithmetic progression and the inflection point was in soil horizon of 50 cm,where saturation moisture capacity,water retention of capillary porosity and field water retention were 16.11%,14.33%and 14.22%,respectively.Within the range of 100-200 cm,the indices were growing.
As for volumetric moisture content of soil,it changed much similar to indices above in soil depth of 0-100 cm,but decreased in 100-120 cm;it then kept stable in the range of 120-160 cm and grew again in 160-200 cm. The inflection points occurred in the soil horizons of 120 and 160 cm respectively.
Conclusion
In the research area,soil bulk density changed from increasing to decreasing upon soilhorizon,and reached the highest with the depth of 50 cm,which has been linked to local hardened sandstone.
Non-capillary porosity declined remarkably with the depths of 20 and 50 cm and gradually increased in the range of 50-70 cm;below 70 cm,it maintained stable in general,with high coefficient of variation.As for capillary porosity,it changed significantly in the depth of 40 cm and dropped to the minimum with the depth of 50 cm,which coincided with total soil porosity. In conclusion,the areas with depth of 0-40 and 90-150 cm belonged to high porosity regions and the rest soil horizons were low porosity regions.
The saturation moisture capacity,water retention of capillary porosity and field water retention all changed from decreasing to increasing upon soil horizon featured by arithmetic progression and the inflection point was in soil horizon of 50 cm.Within the range of 100-200 cm,the indices were growing.
The research area in Daxia irrigated area showed loose structure in soil horizon of 0-40 cm,compacted in 40-60 cm,and loose again in 60-200cm vertically.The inflection point occurred in soil depth of 50 cm,because of local hardened sandstone in soil depth of 40-60 cm dividing soil profile into three discrete layers and the temporary “aquiclude”actually lowers water permeability and reducing use rate of irrigation water.
[1]MENG K(孟凯),ZHANG XY(张兴义),SUI YY(隋跃宇),et al.Black soil water characteristic in Hailun,Heilongjiang(黑龙江海伦农田黑土水分特征)[J].Chinese Journal of Soil Science(土壤通报),2003,34(1):11-14.
[2]ZHANG LK(张科利),PENG WY(彭文英),WANG L(王龙),et al.Variation of soil temperature and soil moisture on black soil profile in seasonal frozen area of northeast China(东北区土壤剖面地温和水分变化规律)[J].Geographical Research(地理研究),2007,26(2):314-320.
[3]ZHANG HJ(张洪江).Preferential flow in flood process in woodland in the Three Gorge of Yangtze River region and its simulation(长江三峡花岗岩地区优先流运动及其模拟)[M].Beijing:Science Press(北京:科学出版社),2005.
[4]HUANG CY(黄昌勇).Edaphology(土壤学)[M].Beijing:China Agriculture Press(北京:中国农业出版社),2000:68.
[5]CHEN M (陈敏).Study on vertical change regularities of physical properties of water in typical black soil(典型黑土水分物理性质的垂直变化规律研究)[J].Journal of Anhui Agricultural Sciences(安徽农业科学),2010,38(13): 6847-6848.
[6]LIN CG(林成谷).Edaphology(土壤学)[M].Beijing:China Agriculture Press(北京:农业出版社),1983:48.
[7]ZHANG XB(张希彪),SHANGGUAN ZP(上官周平).Effect of human-induced disturbance on physical properties of soil in artificial Pinus tabuliformis forests of the Loess Plateau(人为干扰对黄土高原子午岭油松人工林土壤物理性质的影响)[J].Acta Ecologica Sinica(生态学报),2006,26(11):3685-3695.
Responsible editor:Xiaoxue WANG
Responsible proofreader:Xiaoyan WU
青海省大峡灌区土壤基本物理性质垂直变异特征
吕文星1*,唐洪波2,刘东旭1,王国重1,王玉明1,李东1(1.黄河水文水资源科学研究院,河南郑州450004;2.青海省水文水资源勘测局,青海西宁 810008)
由于受气候、生物、土壤属性等因素的影响,土壤基本物理性质垂直剖面分布也表现出相应的层次性。该研究对青海省大峡灌区典型地块土壤基本物理性质分层次进行测定和分析。结果表明,土壤容重随土层深度的增加呈先增大后减小趋势;土壤孔隙度随土层深度的增加呈先减小后增加趋势,整个土壤层次中0~40和90~150 cm两处为高孔隙度区,其他土层属于低孔隙度区;土壤持水性能指标中的土壤饱和持水量、毛管持水量及田间持水量均随土层深度的增加呈先减小后增加趋势,且三者变化趋势基本一致,均呈近等差递减的趋势。大峡灌区典型样地土壤在垂直方向呈现出上部(0~40 cm)疏松,40~60 cm范围较紧实,下部(60~200 cm)再次趋于疏松。
大峡灌区;土壤物理性质;垂直变异
青海省黄河流域灌区耗水系数研究(QX2012-019)
吕文星(1985-),男,辽宁盖州人,工程师,博士,从事水土保持、水文水资源方面的研究。*通讯作者。
2015-09-10
Supported by Water Consumption Coefficient in the Yellow River Basin in Qinghai Province(QX2012-019).
*Corresponding author.E-mail:489428073@qq.com
Received:October 3,2015 Accepted:November 15,2015
修回日期 2015-11-02
猜你喜欢
杂志排行

Agricultural Science & Technology的其它文章
- An lnnovative Strategy for Reciprocal Distant Hybridization between Spartina alterniflora and Rice
- Study on Absorptive Capacity to Formaldehyde and Physiological and Biochemical Changes of Scindapsus aureus Based on the Regulation of LaCl3
- Dynamic Variation in Sugar,Acid,and ASA Contents of‘Ganmi 6’Kiwifruit(Actinidia eriantha Benth)Fruits
- Construction and Development of GMS Agricultural lnformation Network Based on Stakeholder Analysis
- Effects of Different Decolorants on Retention Rate of Total Triterpenes in Fruit and Rattan Stems of Schisandra chinensis(Turcz.)Baill
- Determination of Heavy Metals inDendrobium candidiumWall.ex Lindl.by lCP-MS